Test Case Status Analysis Report
This document explains how to use the Test Case Status Analysis Report to assess test execution health and identify problematic test cases within a given time frame.

With this dashboard, you can simply select a date range and filter criteria to visualize execution quality and pinpoint issues instantly.
Why Use This Report
- Quickly visualize the overall execution status distribution (Passed, Failed, Error, Skipped)
- Identify test cases requiring immediate attention (failed, error, or skipped)
- Prioritize QA efforts based on test case outcomes
- Assess the effectiveness of automated testing compared to manual execution
- Track quality metrics and execution trends across authors, executors, and test types
Explore the Report
- Navigate to Home > All Reports > Test Case Status Analysis section from the main dashboard.
- Set the Analysis Scope - Set the time frame, release, or sprint for test case executions you want to analyze.
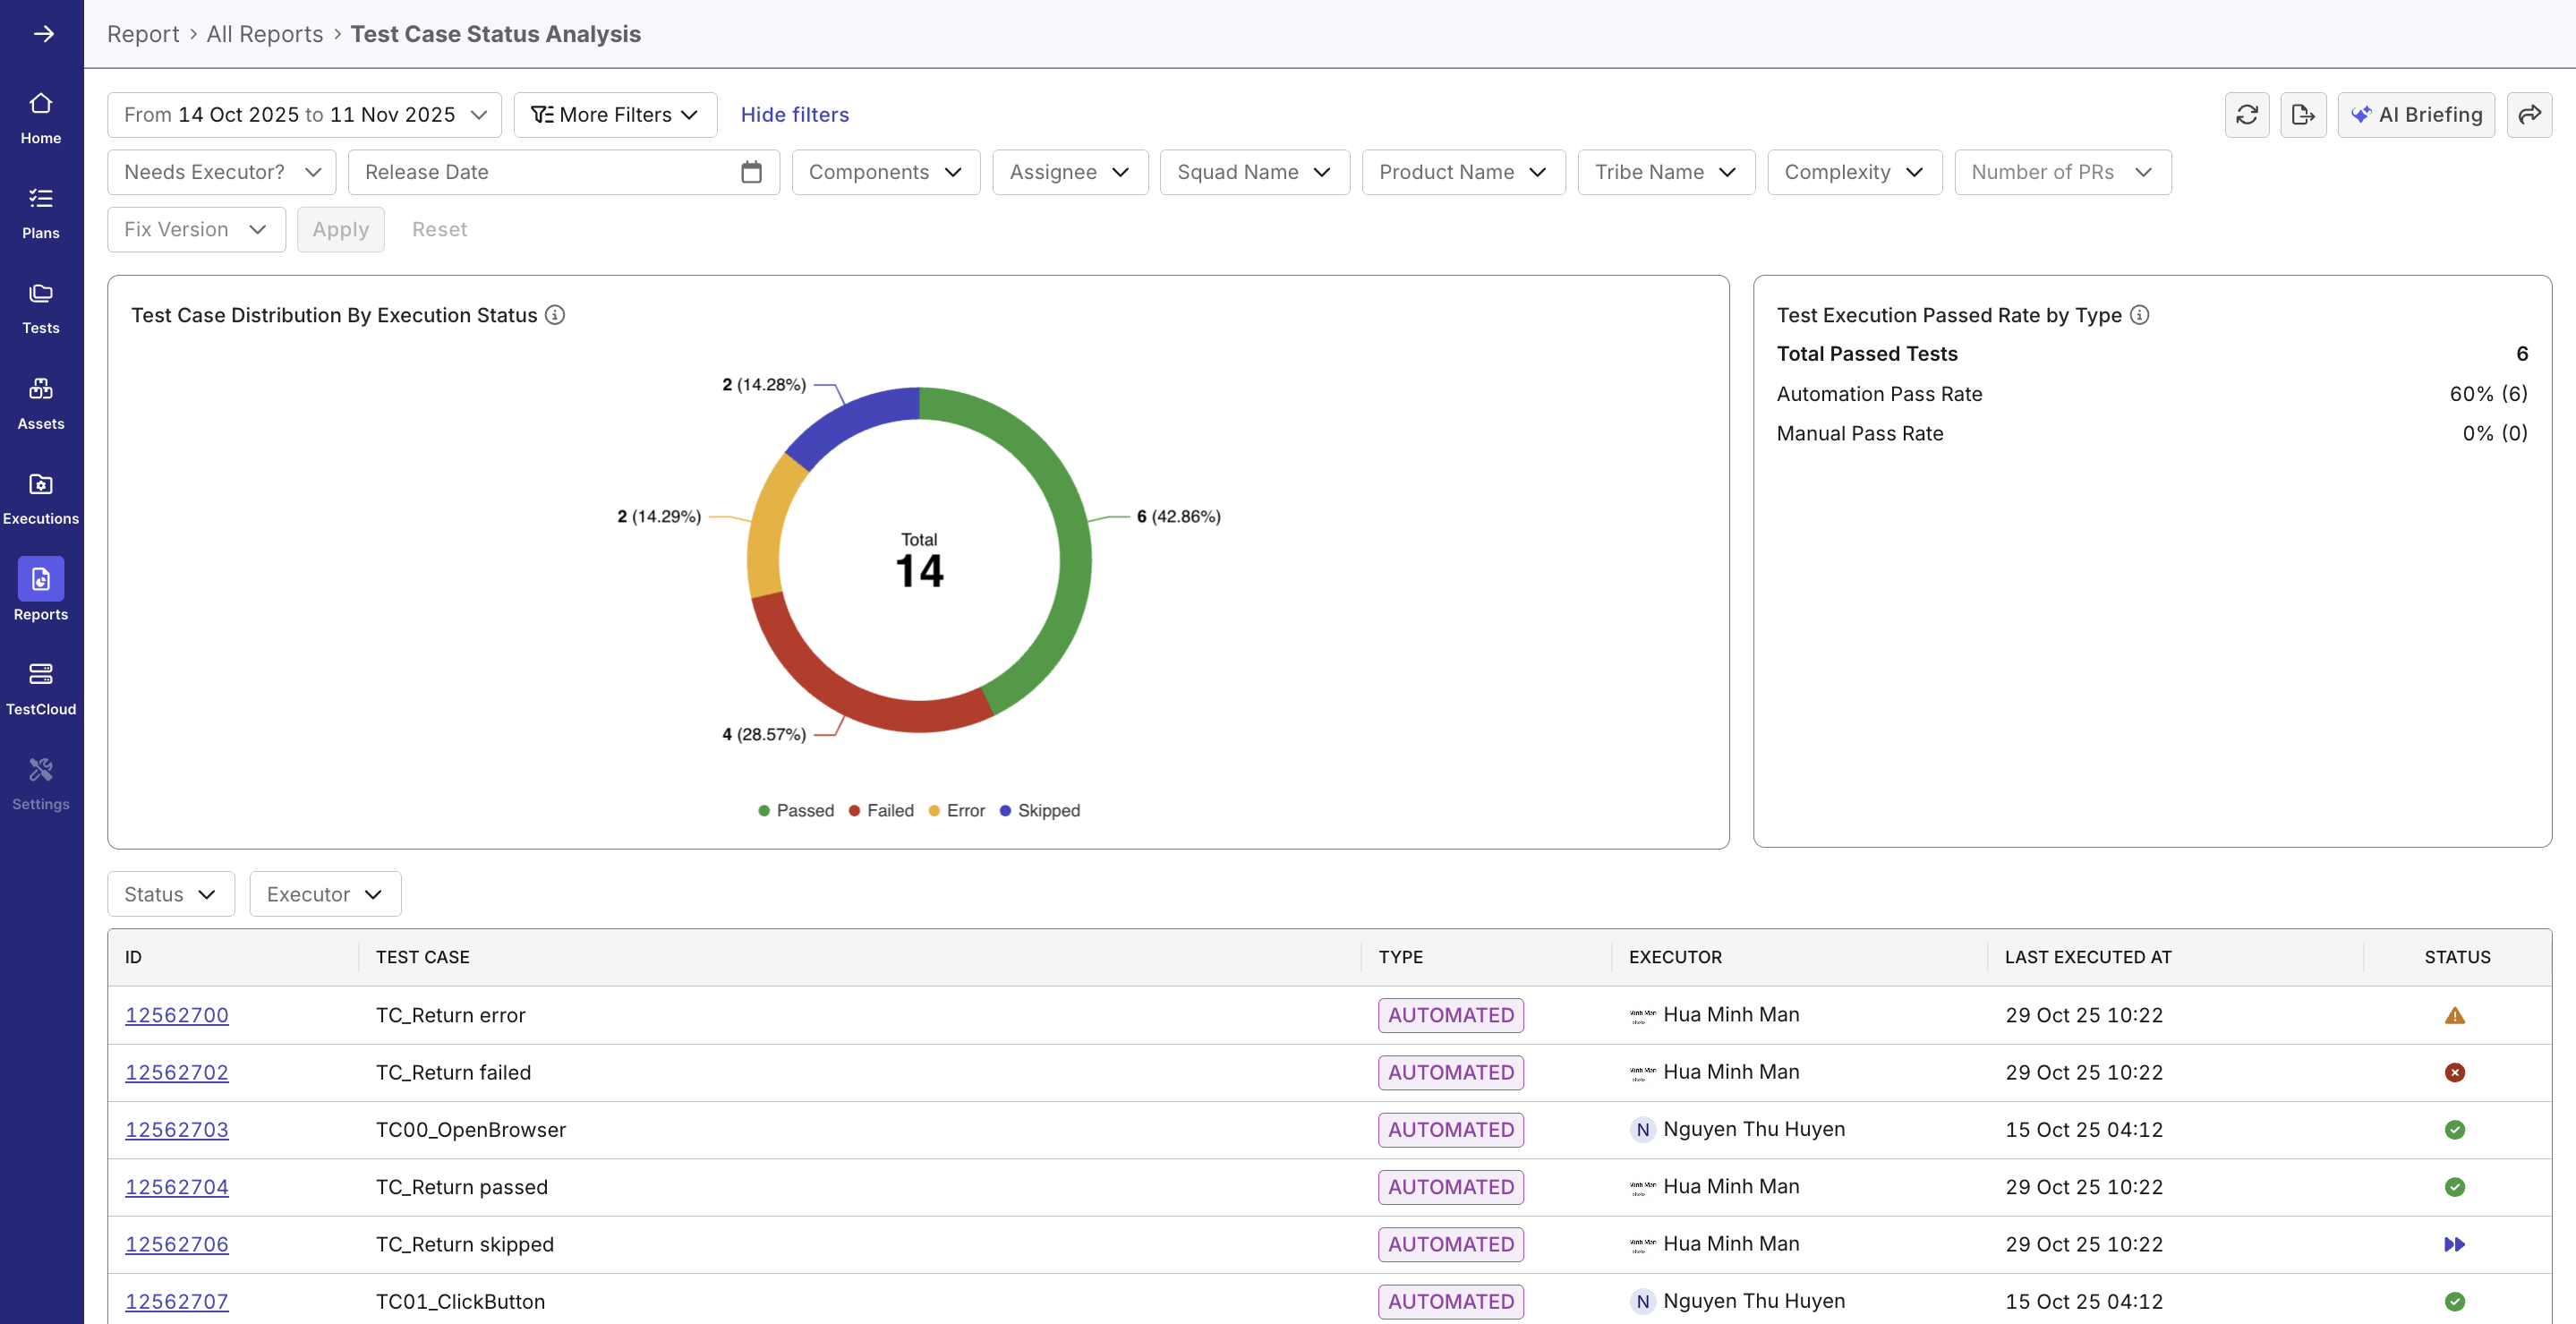
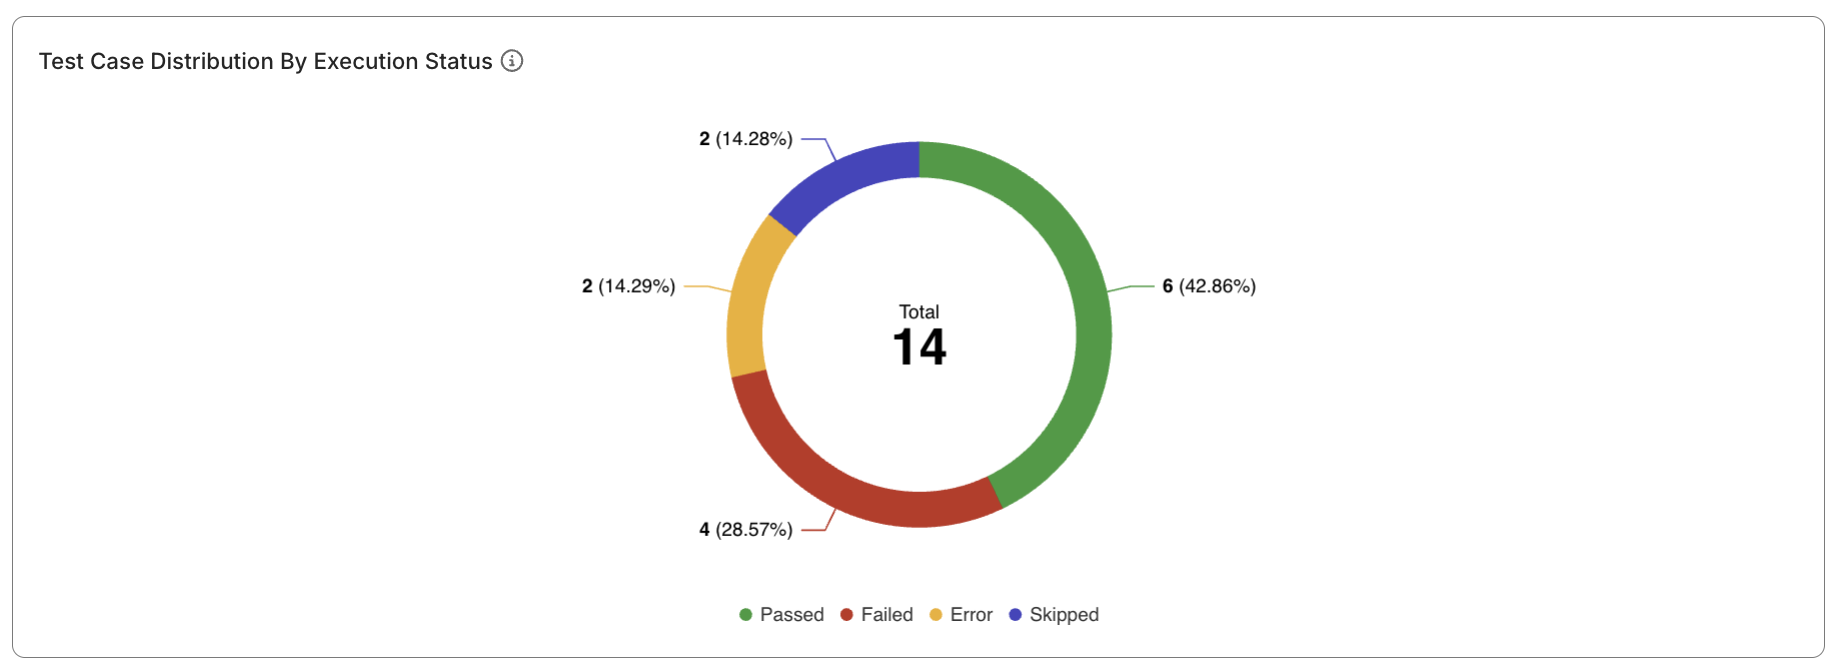
- Examine the Pie Chart showing the distribution of test case statuses — Passed (green), Failed (red), Error (yellow), Skipped (blue). Hover over segments to view percentages and counts.
- Observe the Pass Rate by Test Type chart to understand the success ratio between automated and manual executions.
- Scroll to the Test Case Table displaying ID, name, type, executor, last execution timestamp, and current status.
- Click on a Test Case ID link for direct access to detailed execution results.
- (Optional) Apply Filters for Specific Insights
- Export or Share Findings
Use export options to download the data for reporting or share dashboard snapshots with stakeholders.
Report Features
- Status Distribution Pie Chart
- Displays the proportion of Passed, Failed, Error, and Skipped test cases.
- Passed: Test case executed successfully without issues.
- Failed: Test case failed due to assertion mismatch or defect.
- Error: Execution interrupted by environmental or system errors.
- Skipped: Test case was not executed, possibly due to dependencies.
- Helps identify the percentage of unstable tests requiring attention.
- Displays the proportion of Passed, Failed, Error, and Skipped test cases.

- Pass Rate by Test Type
- Compares execution outcomes between Automated and Manual test cases.
- Useful for assessing automation efficiency and reliability.

-
Comprehensive Filtering Options
- Date Range Selector: Narrow focus to a specific testing period.
- Author Filter: Analyze productivity and quality per contributor.
- Test Type Filter: Distinguish automation from manual effort.
- Latest Status Filter: Target unstable or skipped tests for deeper investigation.
- Executor Filter: Attribute issues to specific execution sessions or users.
-
Interactive Data Table
- Presents essential metadata per test case (ID, name, type, executor, timestamp, status).
- You can click on the ID to navigate directly to the test case details page.
