About the Release Quality Dashboard
This explains what the Release Quality Dashboard is and what its components are.
Prerequisites
- You must possess the Test Lead, Tester, or Member role to view this page. Go to Roles or Permissions for more information or learn how to assign a Project Admin here.
Overview
The Release Quality Dashboard provides you with a consolidated view of your release quality metrics and testing progress. This dashboard transforms complex testing data into actionable insights, helping you determine release readiness at a glance.
This dashboard serves as your central hub for release quality assessment. It organizes critical quality data to answer two fundamental questions about your release cycle:
- What testing work remains incomplete?
- Does the release meet quality thresholds for deployment?
The Release Quality Dashboard eliminates the need to compile quality data from multiple sources, reducing the complexity of release decisions. By presenting critical metrics in a unified interface, it enables quick identification of quality issues and supports data-driven release planning.
View the Release Quality Dashboard
Find this feature by going to Home > Release Quality.
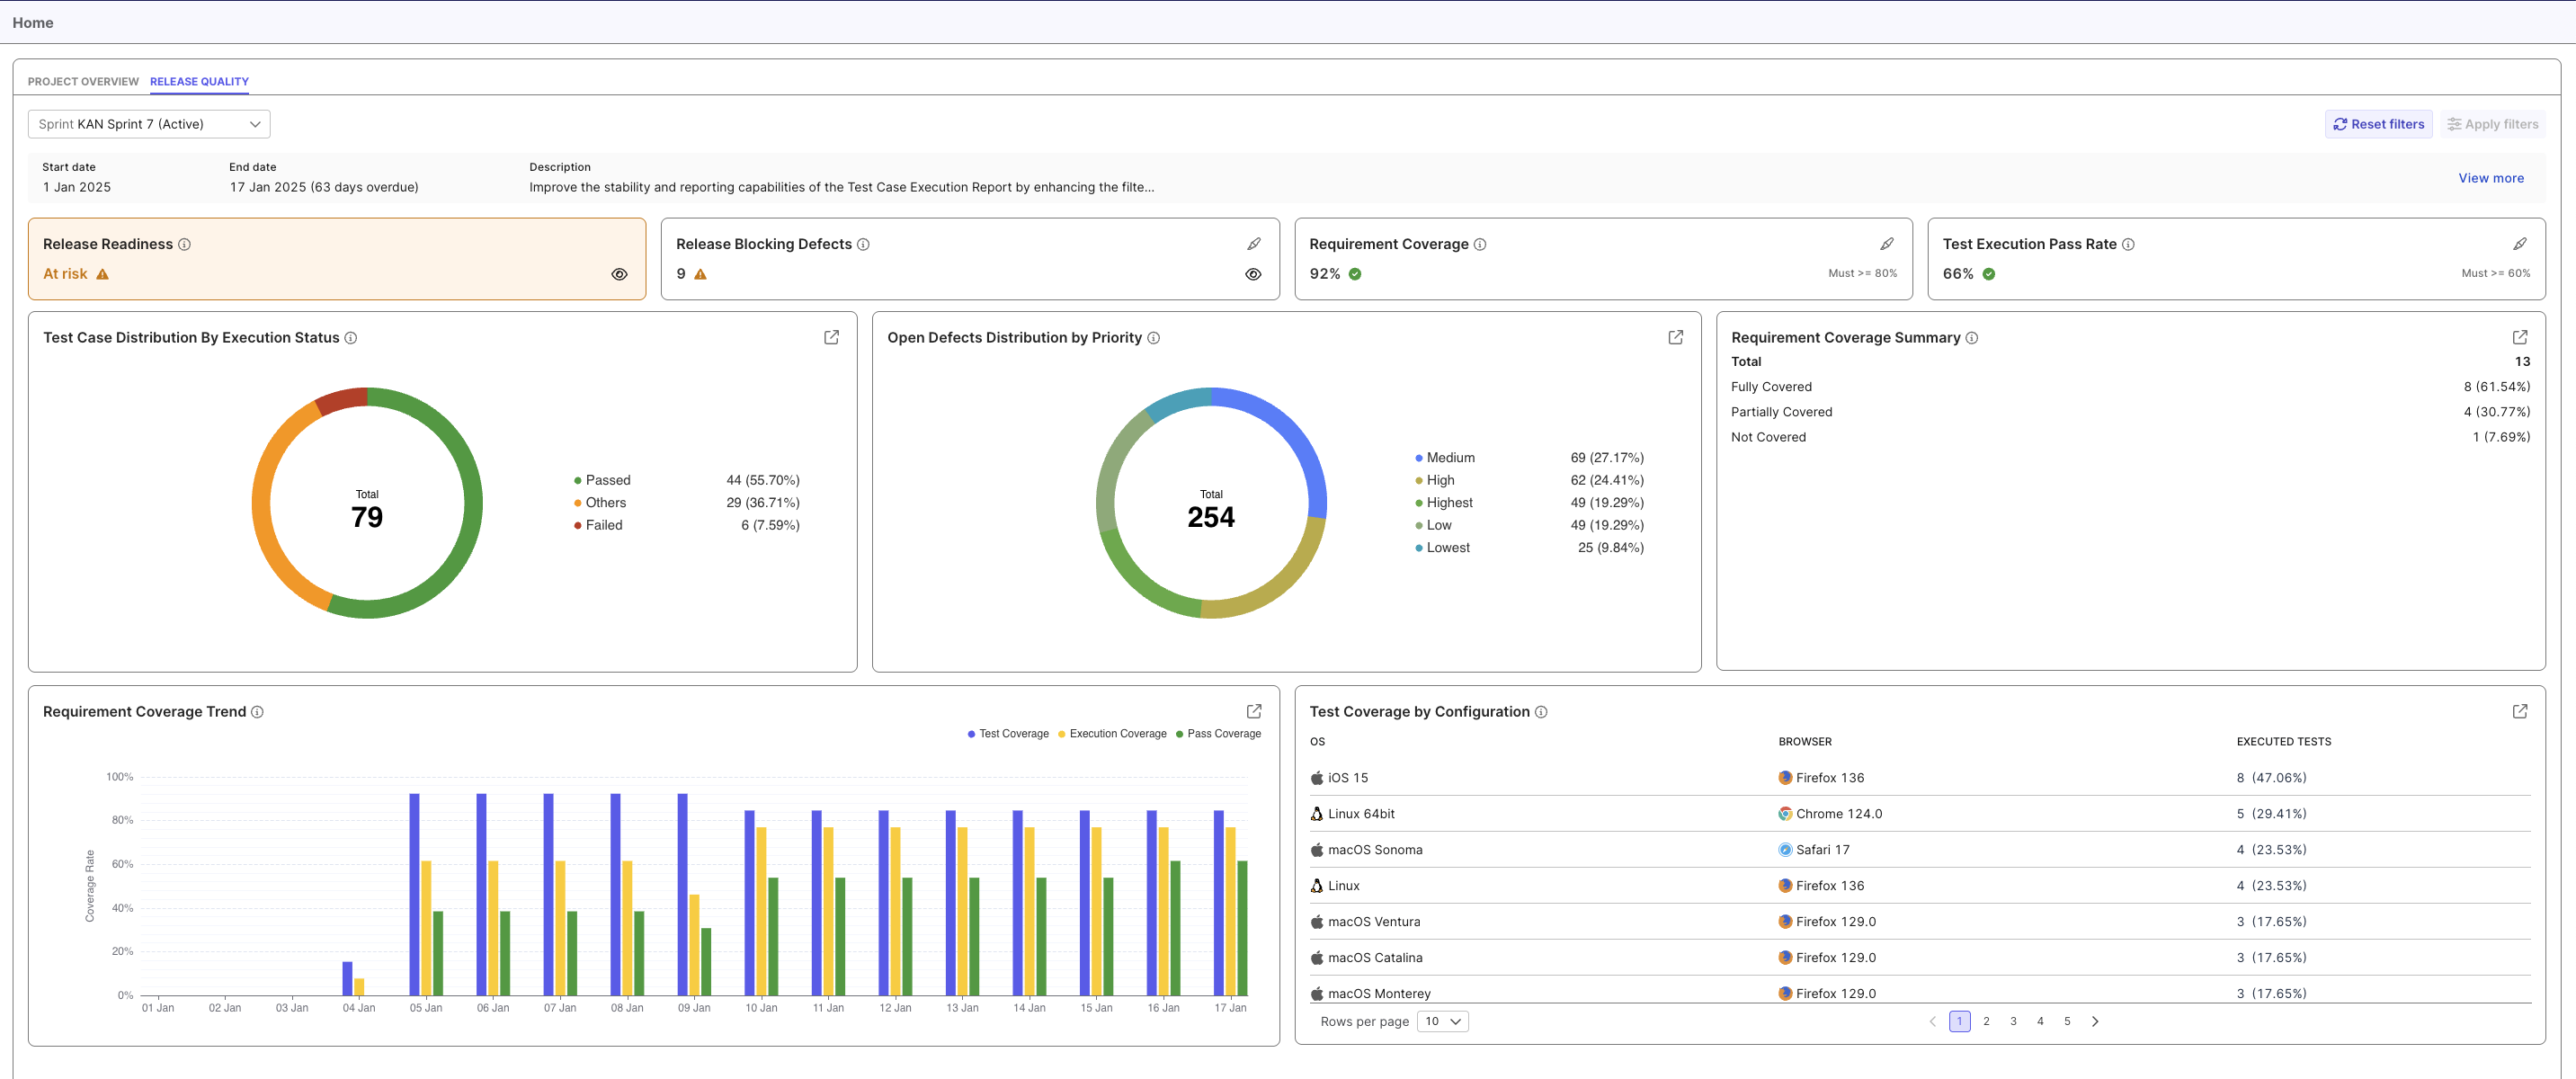
This is a sample of the Release Quality Dashboard.
Select your Sprint or Release in the dropdown menu to view the release quality metrics for the selected Iteration.
You could also click on View more to go to Plans and view your sprint/release details.
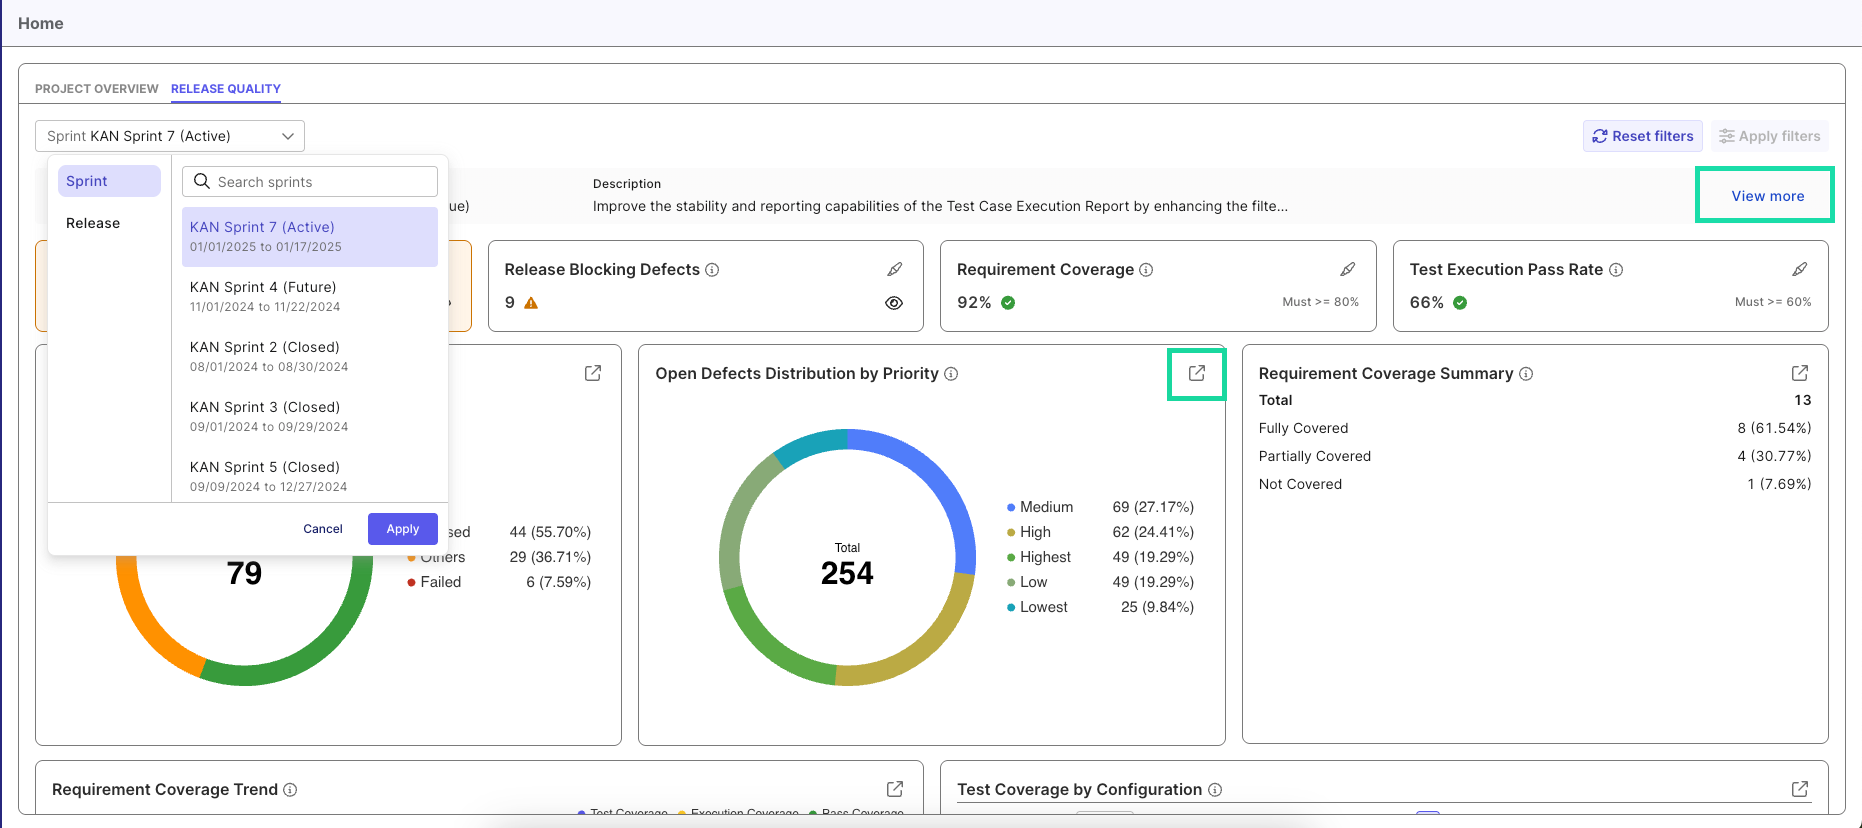
The Iterations are shown. The expand icon ([↗]) and View more button are highlighted.
You can access detailed information for any visualization on this screen by clicking the expand icon ([↗]) in the chart header. This action opens a new tab of the report with more comprehensive metrics and additional data points as it shows in the Reports section.
This feature eliminates navigation to the Reports section by allowing you to access comprehensive testing details directly within the Release Quality Dashboard interface. It centralizes all necessary metrics in one location, streamlining your workflow and enabling informed decision-making without switching between application sections.
About the Release Quality Dashboard Components
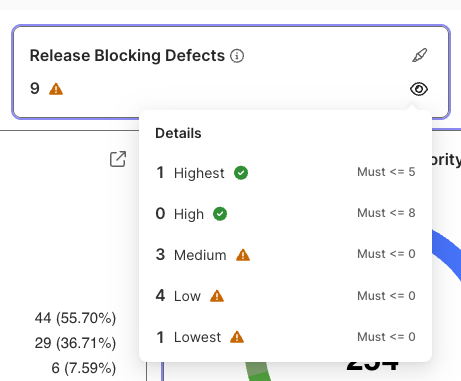
- Click on the eye icon (👁) to view more details.
- Click on the highlight (🖋️) icon to identify related charts.
This dashboard displays the following information:
Release Readiness: This provides an overall assessment of your release quality status based on thresholds. The status displays as Ready (Green) when all criteria are met and At risk (Red) when any criteria are not met.
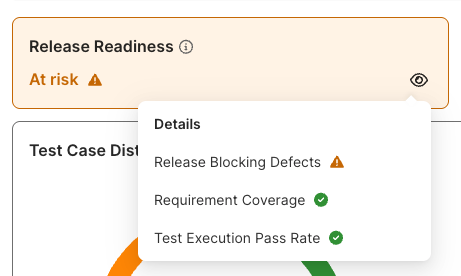
Release Blocking Defects: This displays the number of open defects that could potentially block your release according to priority levels.
Requirement Coverage: The minimum allowed percentage of requirements needed to be covered by test cases.

Test Execution Pass Rate: The minimum allowed percentage of test cases that need to pass.

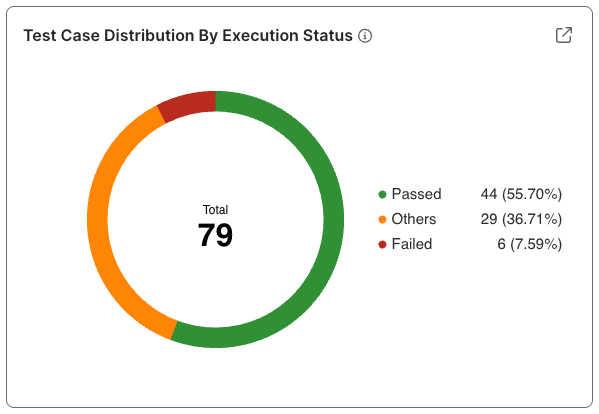
Test Case Distribution by Execution Status: A pie chart that displays test cases organized by execution result (Passed, Failed, etc.), showing both counts and percentages for each status category. You can use this to quickly assess your overall test quality and identify problematic areas. This links to the Test Case Execution report.
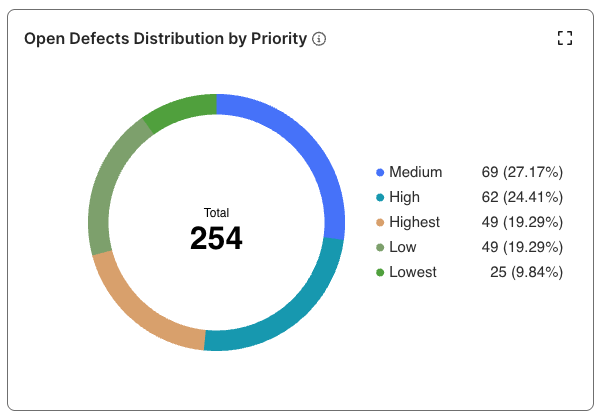
Open Defects Distribution by Priority: A pie chart that displays defects organized by priority levels. This links to the Total Defects During Period by Status report.
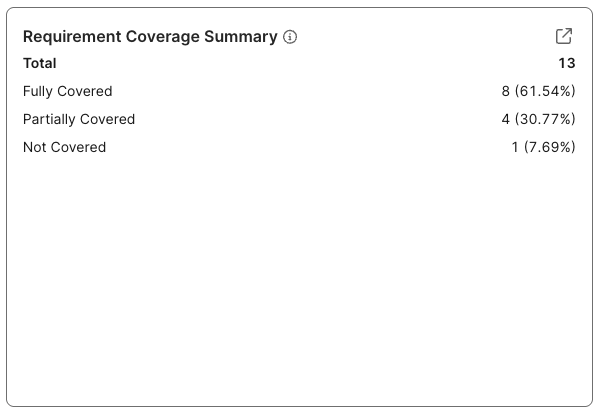
Requirement Coverage Summary: A quanititative metrics panel that categorizes requirements as Fully Covered (all tests published and passed), Partially Covered (tests in development or with mixed results), or Not Covered (no published linked tests), displaying both counts and percentages for each status. This links to the Requirement Coverage report.
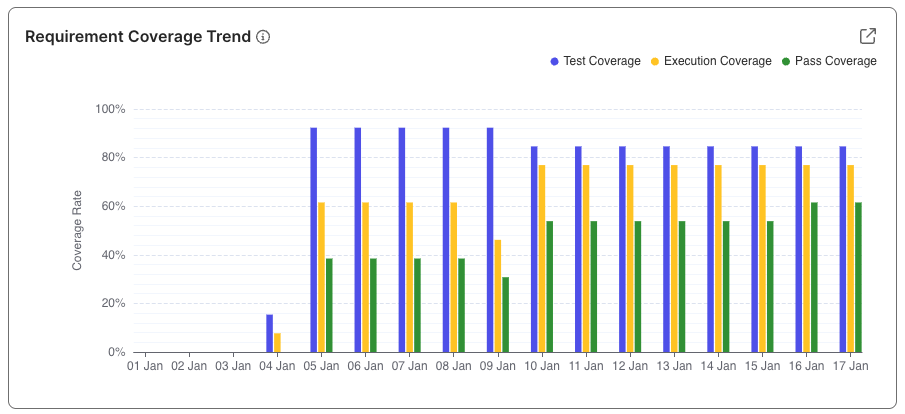
Requirement Coverage Trend: A bar chart that tracks three metrics through your iteration: Test Coverage (% of requirements with linked, published test cases), Execution Coverage (% with executed tests), and Pass Coverage (% with passing tests). It spans iteration dates, with higher values indicating better testing progress. This links to the Requirement Coverage report.
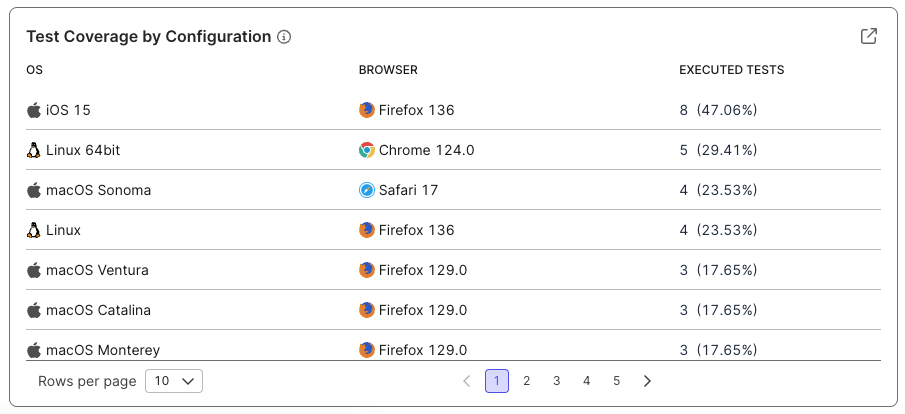
Test Coverage by Configuration: View test execution coverage across operating systems and browsers, displaying the executions count for each. This links to the Configuration Coverage report.
