About the Project Overview Dashboard
This explains what the Project Overview Dashboard is and what its components are.
Prerequisites
- You must possess the Test Lead, Tester, or Member role to view this page. Go to Roles or Permissions for more information or learn how to assign a Project Admin here.
Overview
The Project Overview Dashboard gives you a consolidated view of your testing activities across your project. This visual interface aggregates key metrics and trends, enabling you to monitor testing progress efficiently.
The dashboard presents testing data through organized charts and statistics that highlight performance patterns and potential issues. You can quickly assess overall project health, track completion rates, and identify testing bottlenecks without navigating through multiple screens.
The at-a-glance format helps you maintain continuous awareness of your testing status throughout the development lifecycle.
View the Project Overview Dashboard
Find this feature by going to Home > Project Overview.
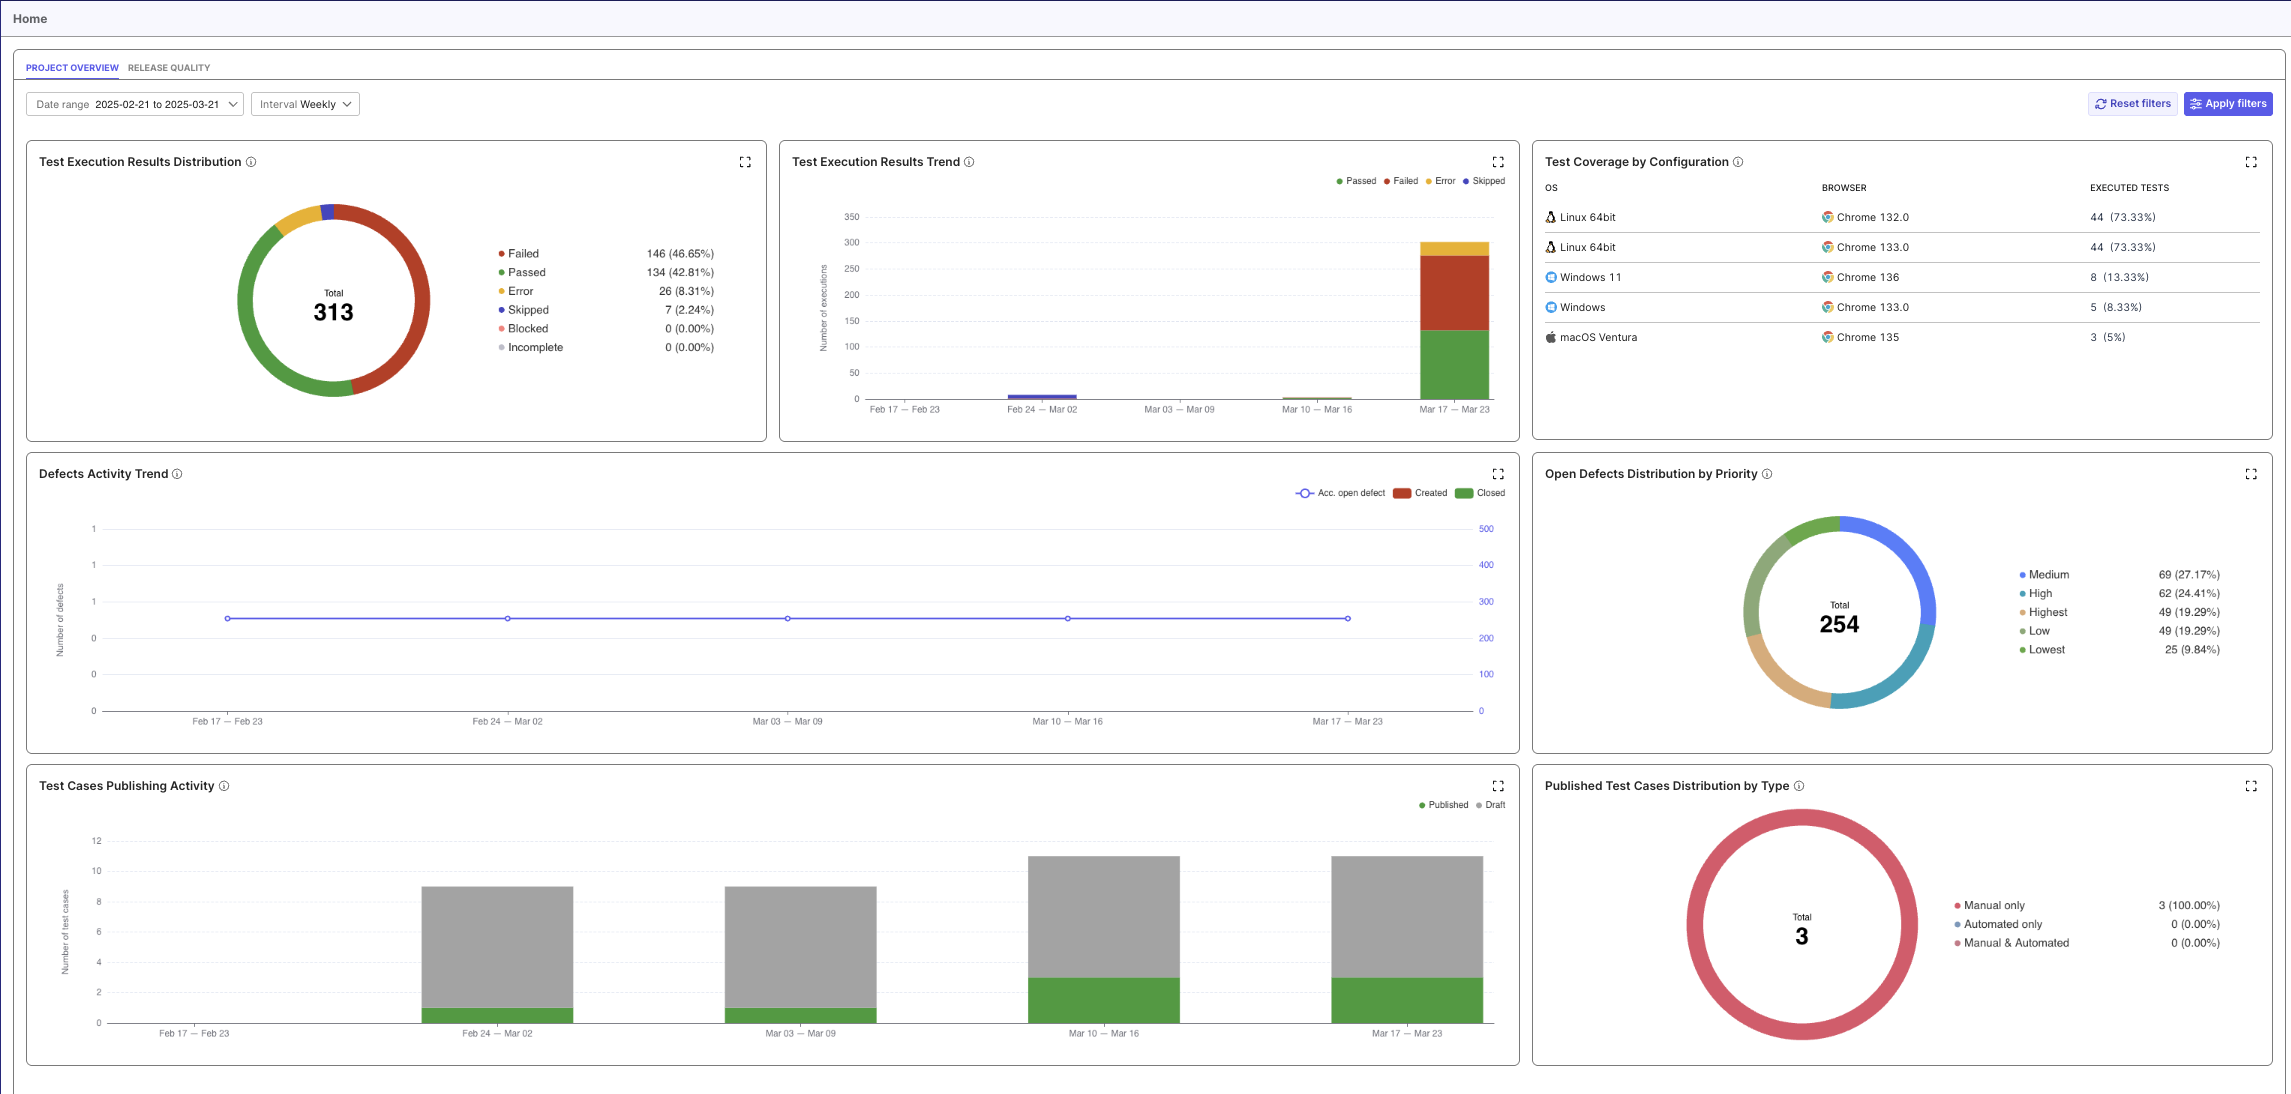
This is a sample of the Project Overview Dashboard.
You can access detailed information for any chart on this screen by clicking the expand icon ([ ]) in the chart header. This action opens an enhanced version of the report with more comprehensive metrics and additional data points as it shows in the Reports section. You could also Go to report from the expanded view.
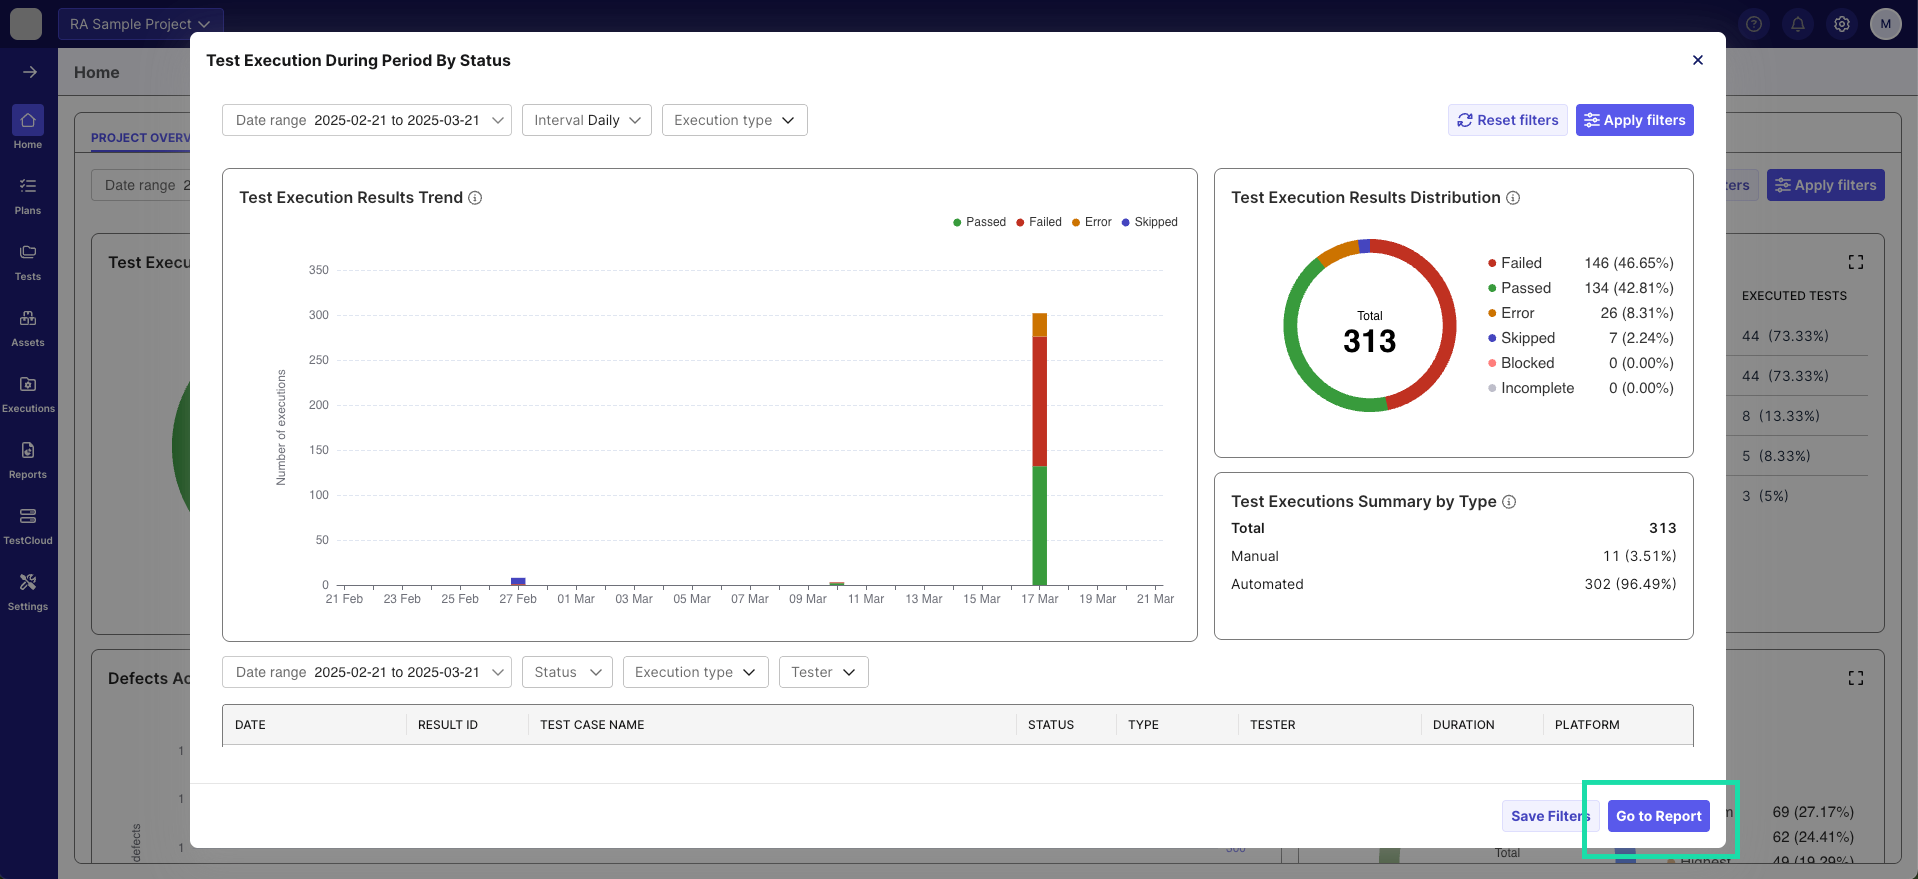
The Go to Report button is highlighted in the lower right corner of the expanded view.
This feature eliminates navigation to the Reports section by allowing you to access comprehensive testing details directly within the Project Overview Dashboard interface. The expanded views centralize all necessary metrics in one location, streamlining your workflow and enabling informed decision-making without switching between application sections.
About the Project Overview Dashboard Components
This dashboard displays the following information:
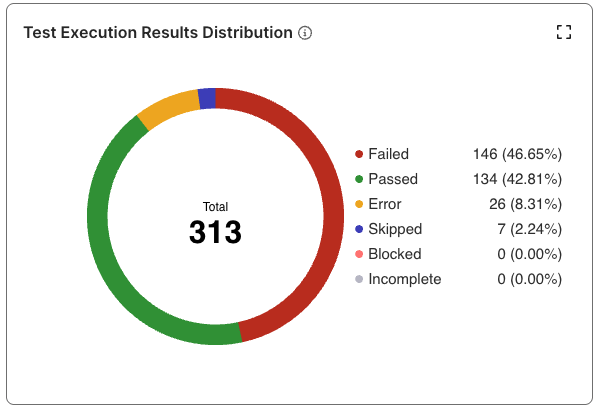
Test Execution Results Distribution: A pie chart showing the percentage breakdown of all test execution results by status (Passed, Failed, etc.) with corresponding count and percentage values. This expands to the Test execution during period by status report.
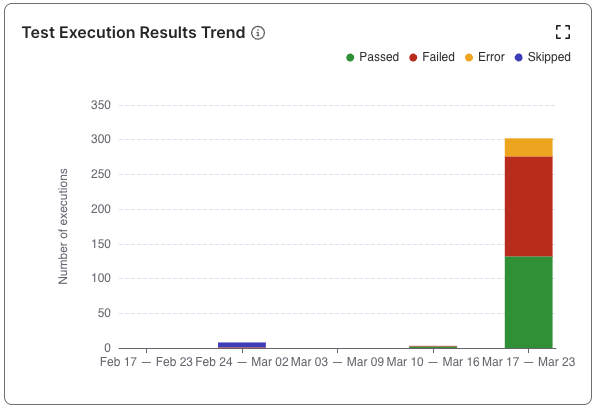
Test Execution Results Trend: A stacked bar chart displaying daily test execution results with color-coded breakdown of passed, failed, error, incomplete, blocked, and skipped test counts. This expands to the Test execution during period by status report.
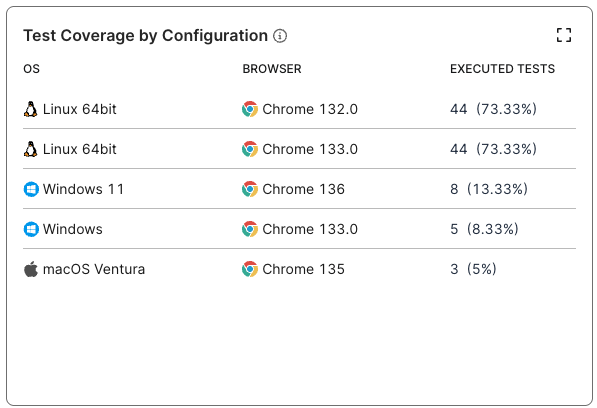
Test Coverage by Configuration: View test execution coverage across operating systems and browsers, showing the execution count for each. This expands to the Configuration Coverage report.
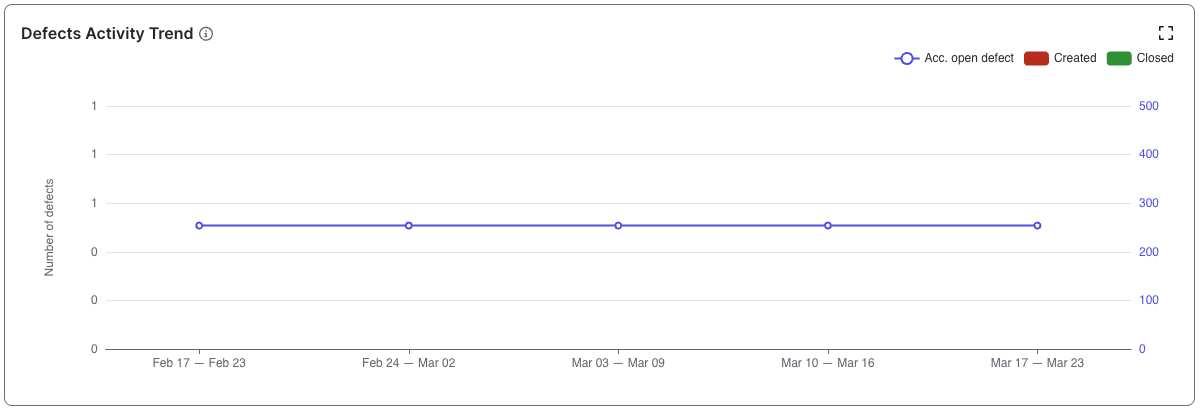
Defects Activity Trend: A dual-axis chart where bars represent daily defect creation and closure counts, while a superimposed line plots the cumulative number of open defects over time. This expands to the Total Defects during period by status report.
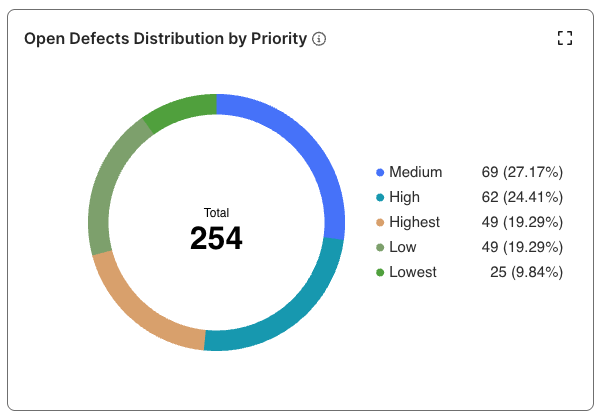
Open Defects Distribution by Priority: A pie chart showing the percentage breakdown of open defects by priority (High, Medium, Low, etc.) with corresponding count and percentage values. This expands to the Total Defects during period by priority report.
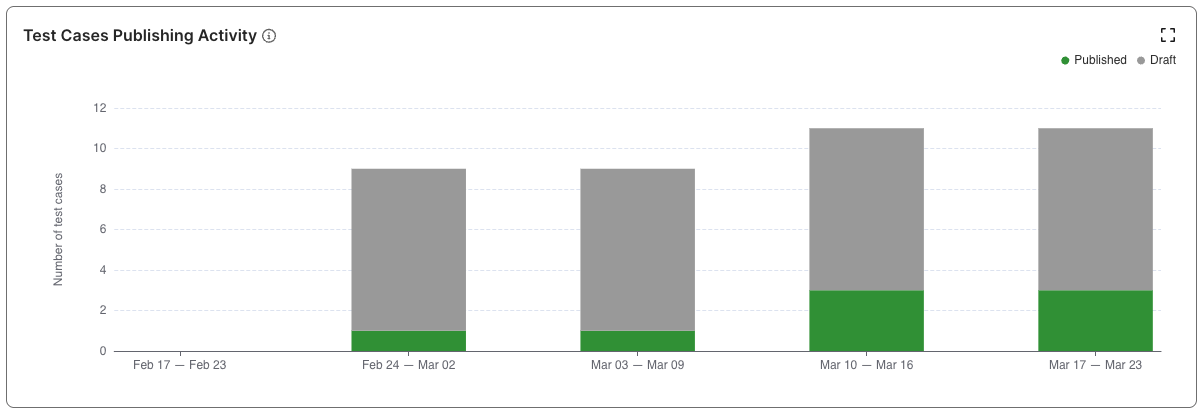
Test Cases Publishing Activity: A stacked bar chart tracking the daily number of test cases by status (Draft, Review, Published) over your selected time period. This expands to the Test Case Activity During Period by Status report.
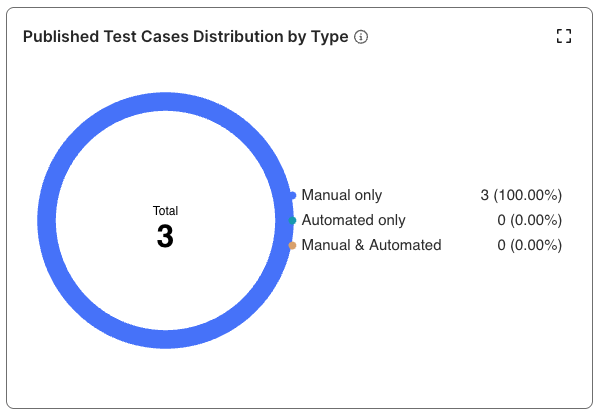
Published Test Cases Distribution by Type: A pie chart showing the percentage breakdown of published test cases by type (Manual, Automated, etc.) with corresponding count and percentage values. This expands to the Test Case Activity During Period by Status report.
Related Articles
Now that you understand the Project Overview Dashboard, you can learn more about reports by visiting: