Debug a test case in Katalon Studio
Creating automation test cases is a repetitive task that often requires editing and rerunning the same test many times. When a test case fails and you update the script, rerunning the entire flow can be time-consuming.
To make debugging easier and reduce unnecessary reruns, Katalon Studio provides the following utilities:
- License: an active Katalon Studio license.
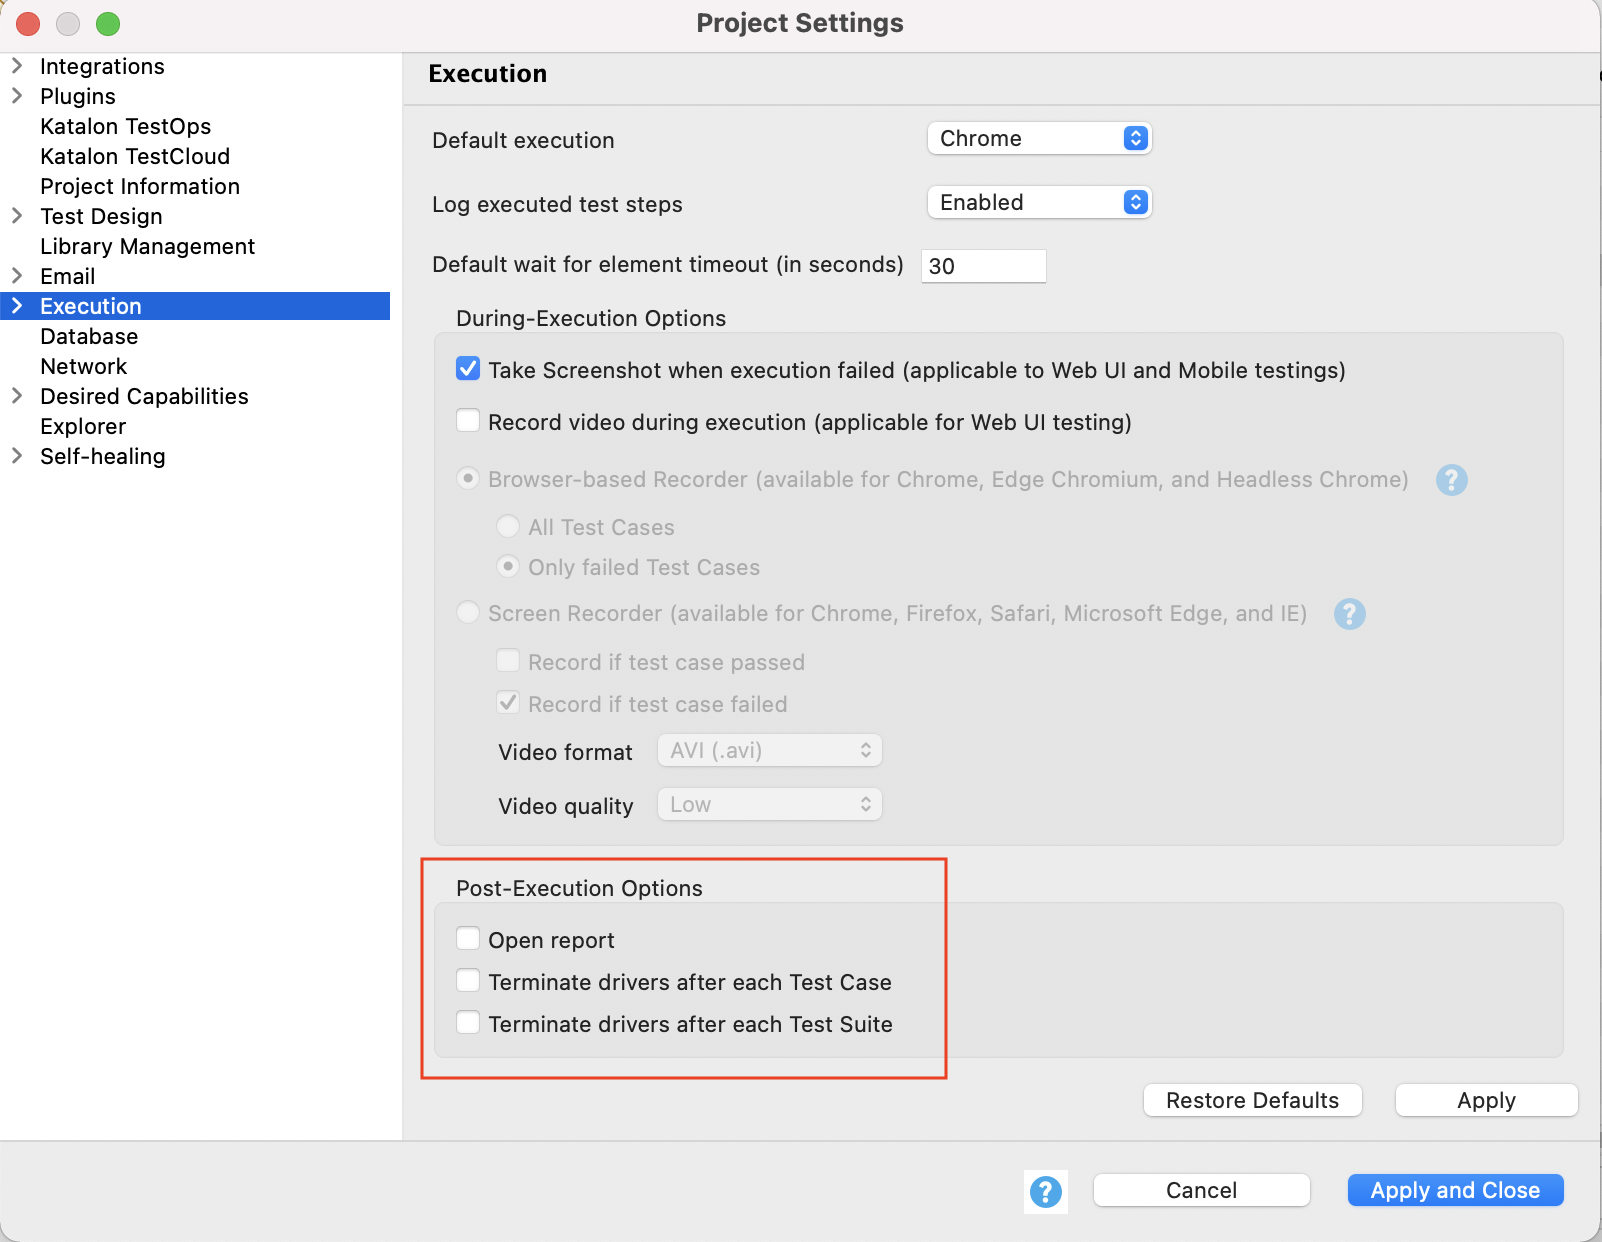
- Project configurations: Go to Project > Settings > Execution, and clear Terminate browser/application after a test case/suite finishes option under Post-Execution Options.
- Test case readiness:
- The test case for debugging must be opened in either Manual/Script view.
- (For session-based debugging) A browser instance (Chrome, Firefox,...) for the debugging test case must still be running.
Debug: Run from here
With this feature, you can quickly resume an existing execution. Katalon Studio currently supports Run from here with Chrome, Firefox, and Edge Chromium only.
To use it from the Manual view of a test case:
-
Start a browser with the
Open Browserstep, or use a browser instance that is already running. -
Make sure the browser session is not terminated when the execution finishes.
-
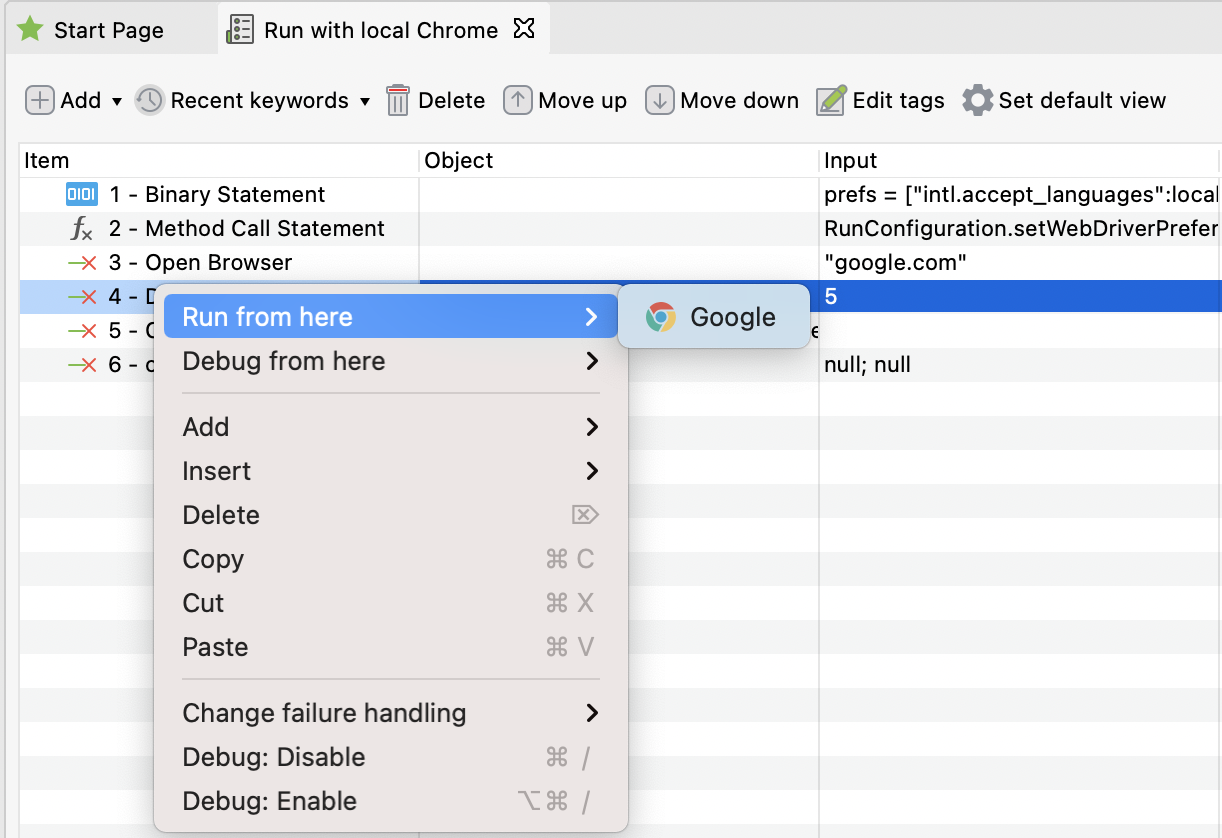
In the Manual view of the test case, right-click a step, select Run from here, then choose one of the currently running browser instances.
note- If there are no running browser instances previously launched in Katalon Studio, Run from here is disabled.
- If the browser launched by Katalon Studio is still running but Run from here is disabled, your corporate proxy may be the issue. See troubleshooting details at Run from here or Debug from here is disabled while the browser is still running.
Debug: Enable or Disable Steps
Katalon Studio allows you to enable or disable one or more test steps before execution so you can skip unnecessary steps while debugging.
- For Windows, use Ctrl+D to disable and Ctrl+E to enable selected steps.
- For macOS, use command+/ to disable and option+command+/ to enable selected steps.

Debug mode
The Debug mode in Katalon Studio helps you investigate root causes more quickly. To debug a test case:
-
Open a test case and switch to the Script view.

-
Double-click the left side of the script editor to mark a breakpoint. A breakpoint is where Katalon Studio pauses execution so you can start debugging.

-
Choose a browser for Debug from the main toolbar.

-
When prompted, select Yes to display the Debug perspective.

-
Use the Debug perspective to inspect and control the execution.
-
Navigate execution using commands from the debug toolbar.

-
The following commands are available:
Command Description 
Resume debugging 
Suspend debugging 
Terminate debugging 
Disconnect 
Step into the current code block 
Step over the current code block 
Return from the current code block 
Run to a specific line -
Track variable values using Watch utilities.

-
The following views are available:
View Description Variables View all variables associated with the current debugged action. This works similarly to Variables View in Eclipse. See the Eclipse guide. Breakpoints View all breakpoints. This works similarly to Breakpoints View in Eclipse. See the Eclipse guide. Expressions Inspect data using Expressions View. This works similarly to Expressions View in Eclipse. See the Eclipse guide.
-
Debug from here
To use Debug from here with Chrome, Firefox, or Edge Chromium:
-
Start a browser with the
Open Browserstep, or use a browser instance that is already running. -
Make sure the browser session is not terminated when the execution finishes.

-
Open a test case in Script view and double-click the left side of the script editor to mark a breakpoint.

-
Switch to the test case's Manual view, right-click a step, select Debug from here, then choose one of the currently running browser instances.
note- If there are no running browser instances previously launched in Katalon Studio, Debug from here is disabled.
- If the browser launched by Katalon Studio is still running but Debug from here is disabled, your corporate proxy may be the issue. See troubleshooting details at Run from here or Debug from here is disabled while the browser is still running.

See also: