View and customize execution log in Katalon Studio
Viewing the execution log is the very first approach when troubleshooting automation test execution. The critical information in the log can quickly help project teams pinpoint the root causes of any issues. Katalon Studio execution logs are optimized to provide such information so that you can have a comprehensive view of the tests run.
Katalon Studio provides two Execution Log experiences:
- New Execution Log UI (beta): a modernized interface with improved visuals and navigation.
- Legacy Execution Log UI: the original interface for users who prefer the previous layout.
The new Execution Log UI is enabled by default for new installations. To switch back to Legacy, navigate to Project > Settings > Execution and un-check the Enable Execution Viewer option.
View Execution Log
After executing a test case or test suite, you can review the results in the Log Viewer tab.
- New Execution Log
- Legacy Execution Log
The new Execution Log UI provides an improved layout for reviewing test execution results, making it easier to identify failures, inspect step details, and review execution information.
Known limitations: Jump to issue is not yet supported in the new execution viewer.
The Log Viewer provides detailed, real-time logs of each test step, including status, duration, browser and platform info, and any errors encountered during execution.
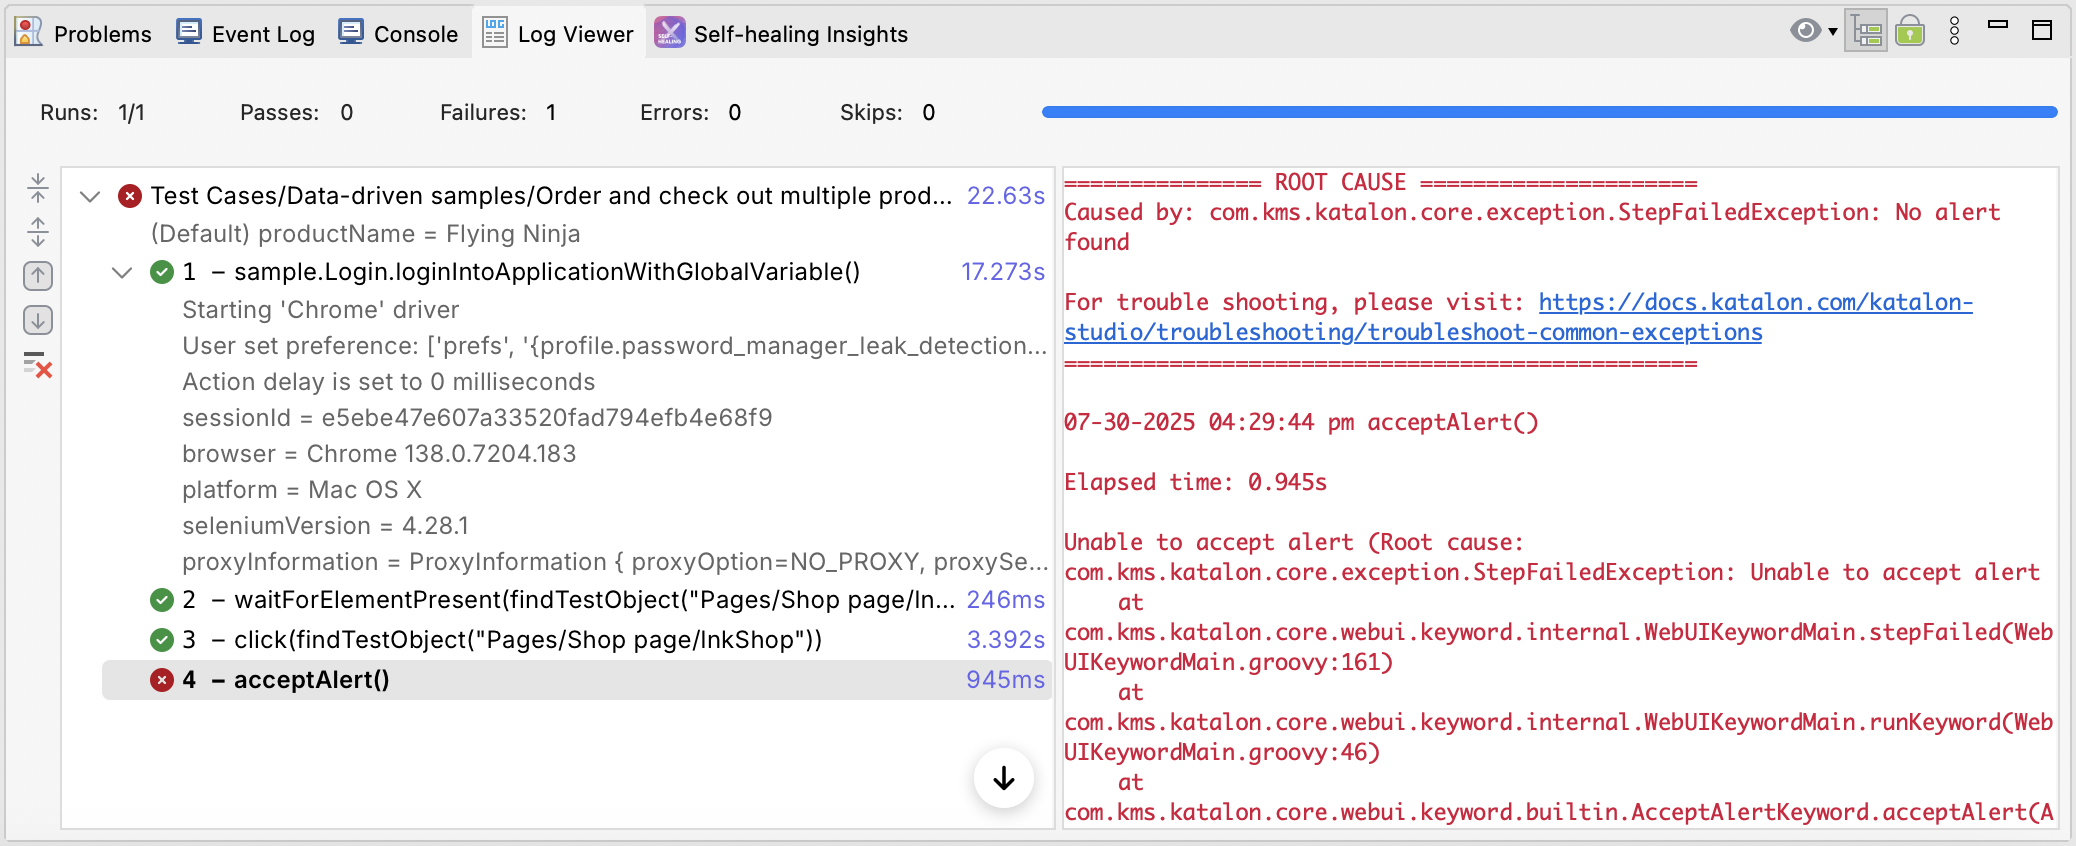
Features include:
- Pass/Fail icons: Each test step is marked with a green check (✅) for passed steps and a red cross (❌) for failed steps, making it easy to identify issues at a glance.
- Step Details: Click on any test step to view its detailed execution logs, including error messages (if applicable).
- Execution Metadata: The Log Viewer displays useful context such as:
- Browser type and version
- Platform (e.g., Windows, macOS)
- Selenium version
- Session ID
- Expand/Collapse Steps: Use the arrow icons on the left to expand or collapse individual test steps for a more focused view.
Tabular view vs. Tree View
- Tabular view is not available in New Execution Log.
The Log Viewer can be viewed in different modes: Tabular view and Tree view. You can switch to Tree View by selecting the toggle as illustrated below:

The Tree View display logs in a structural way that relates to how the test case/test suite is organized. Additionally, you can navigate to the respective step by selecting from the context menu, as shown below:
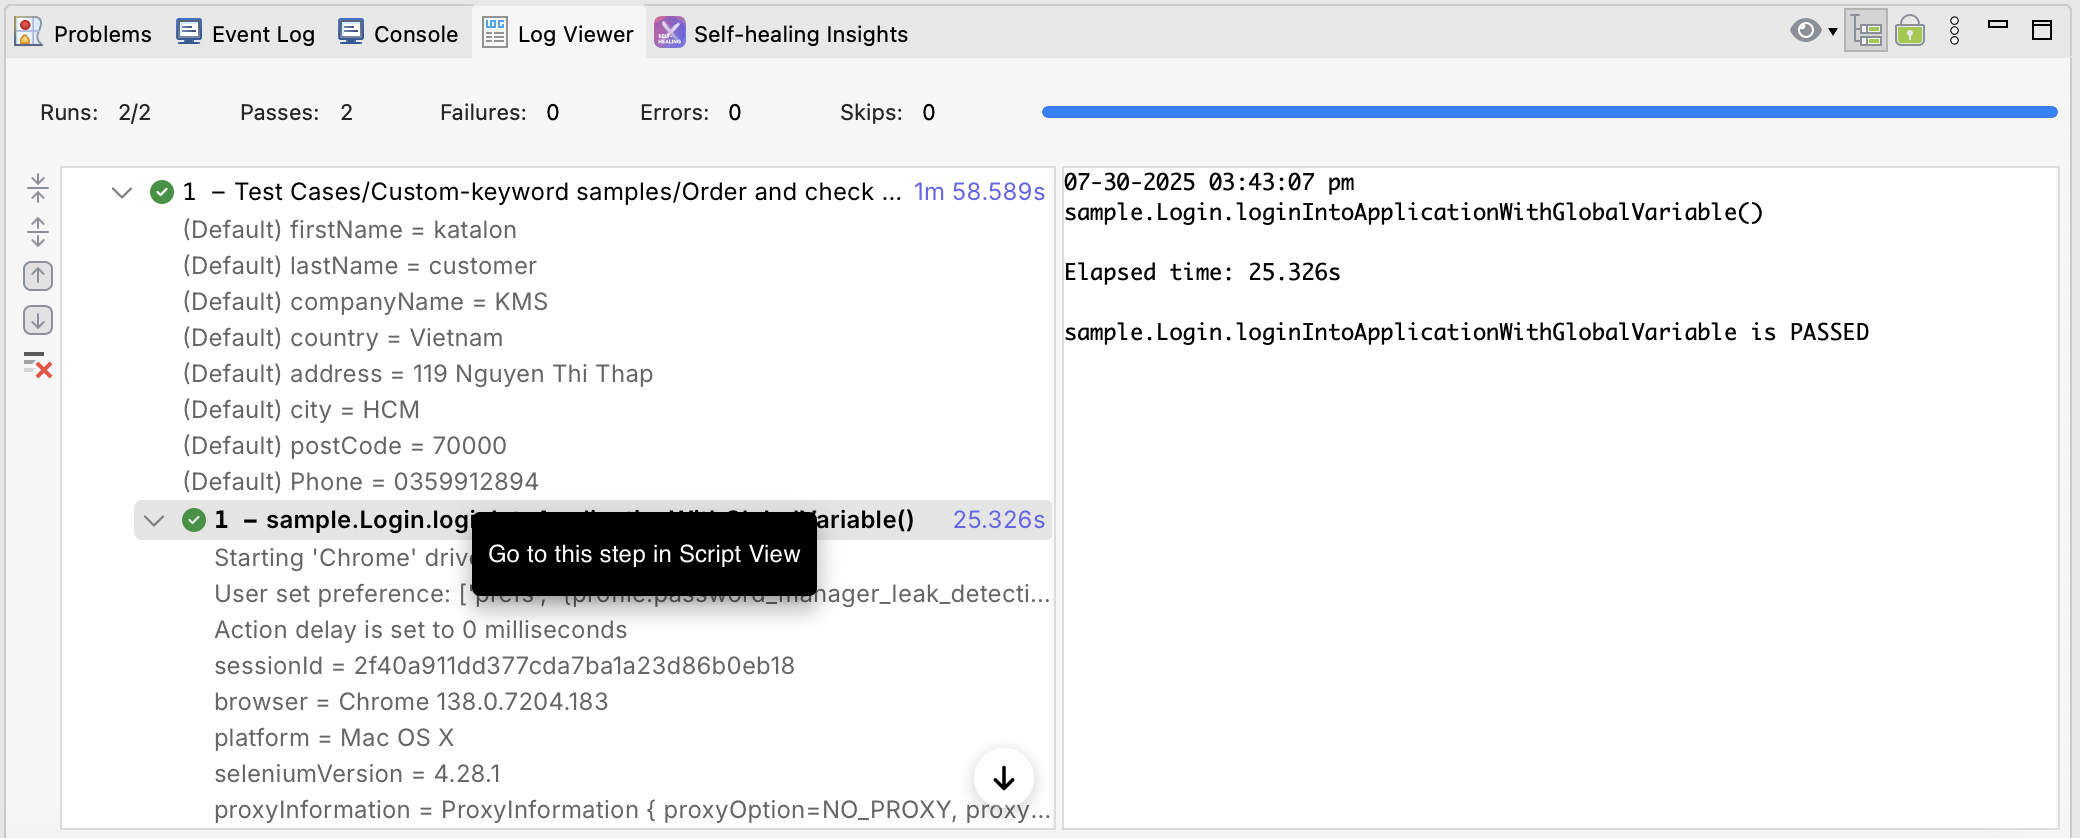
The Log Viewer can be viewed in different modes: tabular view and tree view. You can switch to tree view by selecting the Tree View toggle as illustrated below:

The Tree View displays logs in a structural way that relates to how the test case/test suite is organized. Additionally, you can navigate to the respective step by selecting from the context menu, as shown below:
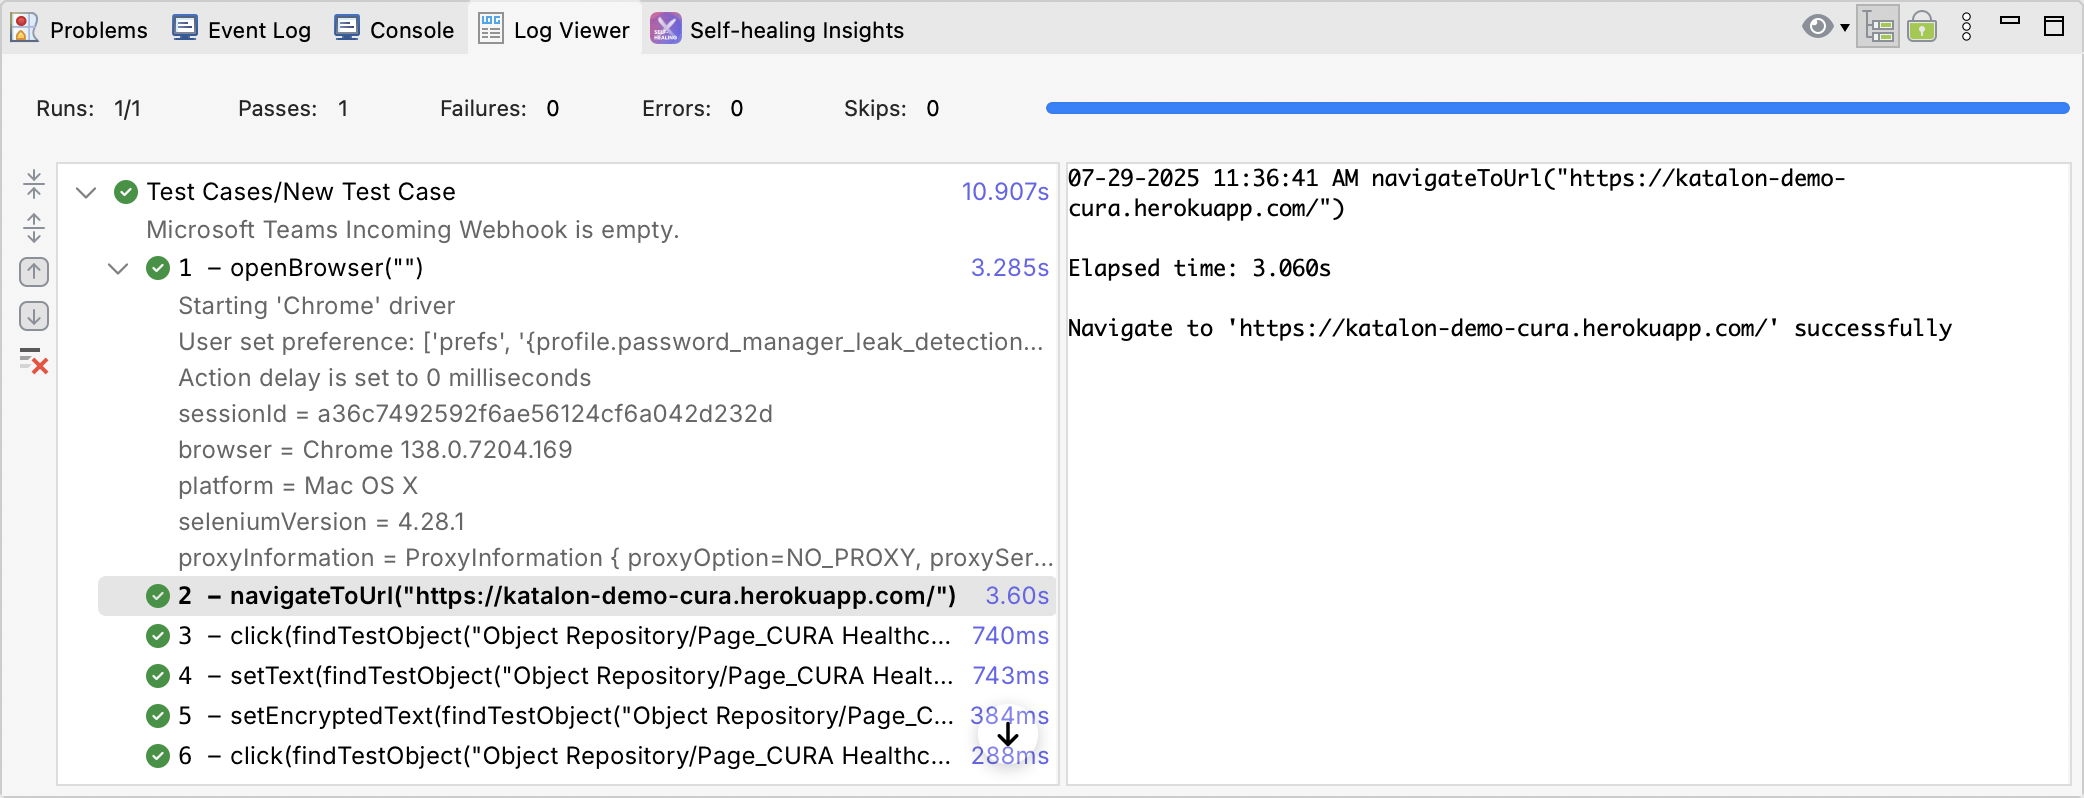
Scroll Lock
While the test is being executed, the Log Viewer is being updated with real-time log messages, where the most recent log messages is shown at the bottom. Therefore, the Log Viewer keeps scrolling down during the test execution. However, users may want to keep the Log Viewer standing still so that they can verify particular log messages. To stop this scrolling behavior, you can select Scroll Lock.

Customize Console Log
Execution Progress Debugger
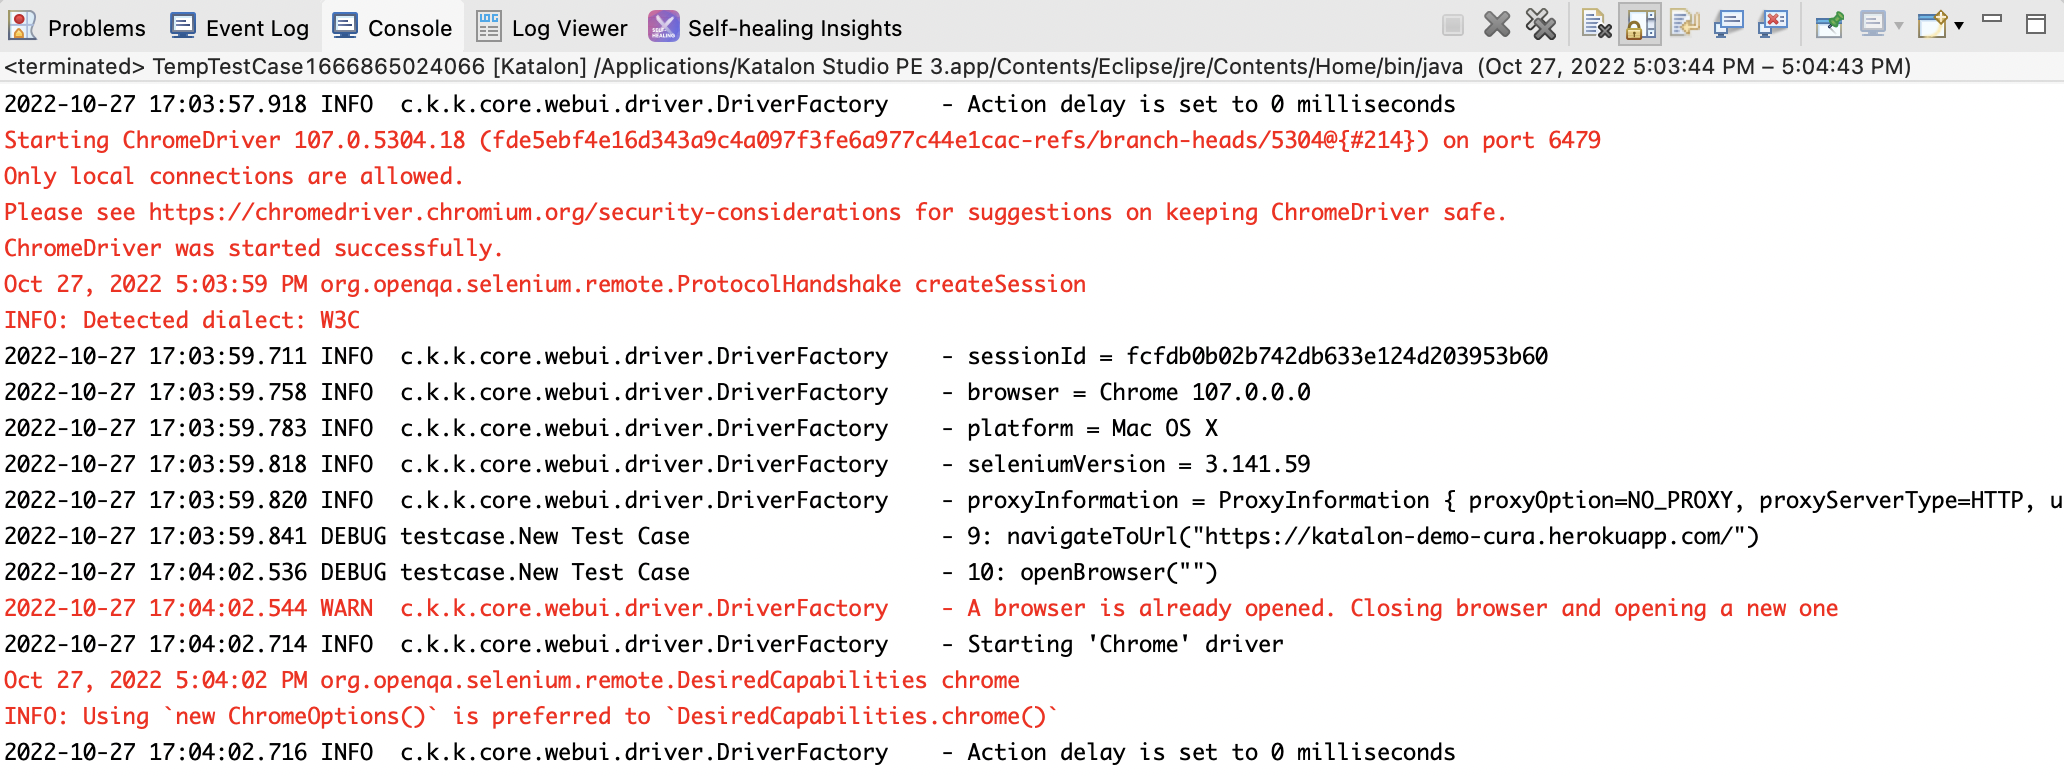
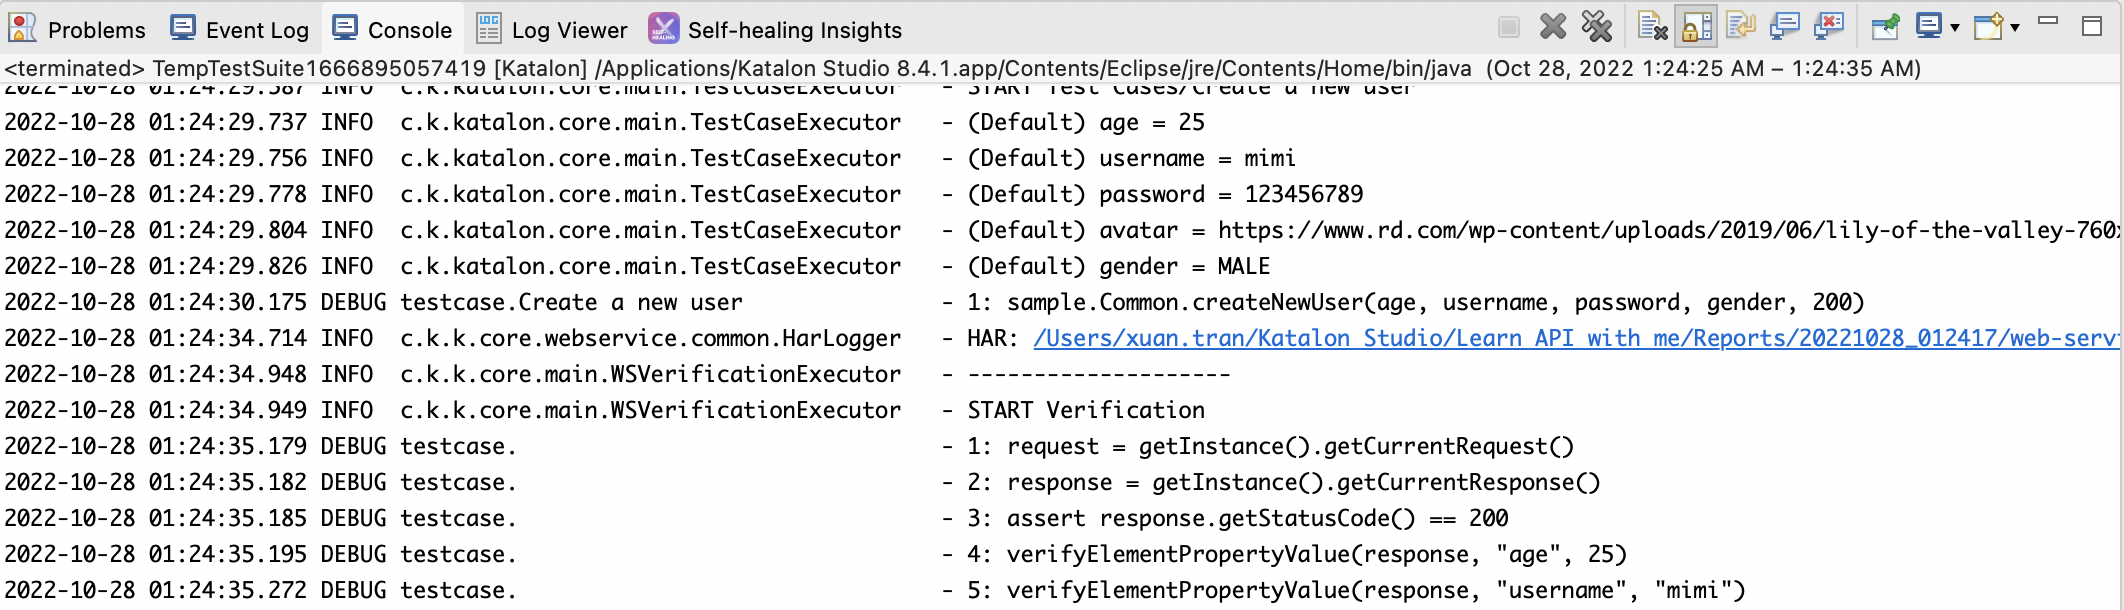
Katalon Studio execution log displays complete details of actions performed during the test run to help you debug better. The test log contains all relevant information about the test run. Full test step statements and desired capabilities information are also included. Log levels are ANSI color-coded for different kinds of levels: INFO, DEBUG, WARING, and ERROR for an easier view of the execution log, as shown in the screenshot below.
Extensive logs for Web Service testing
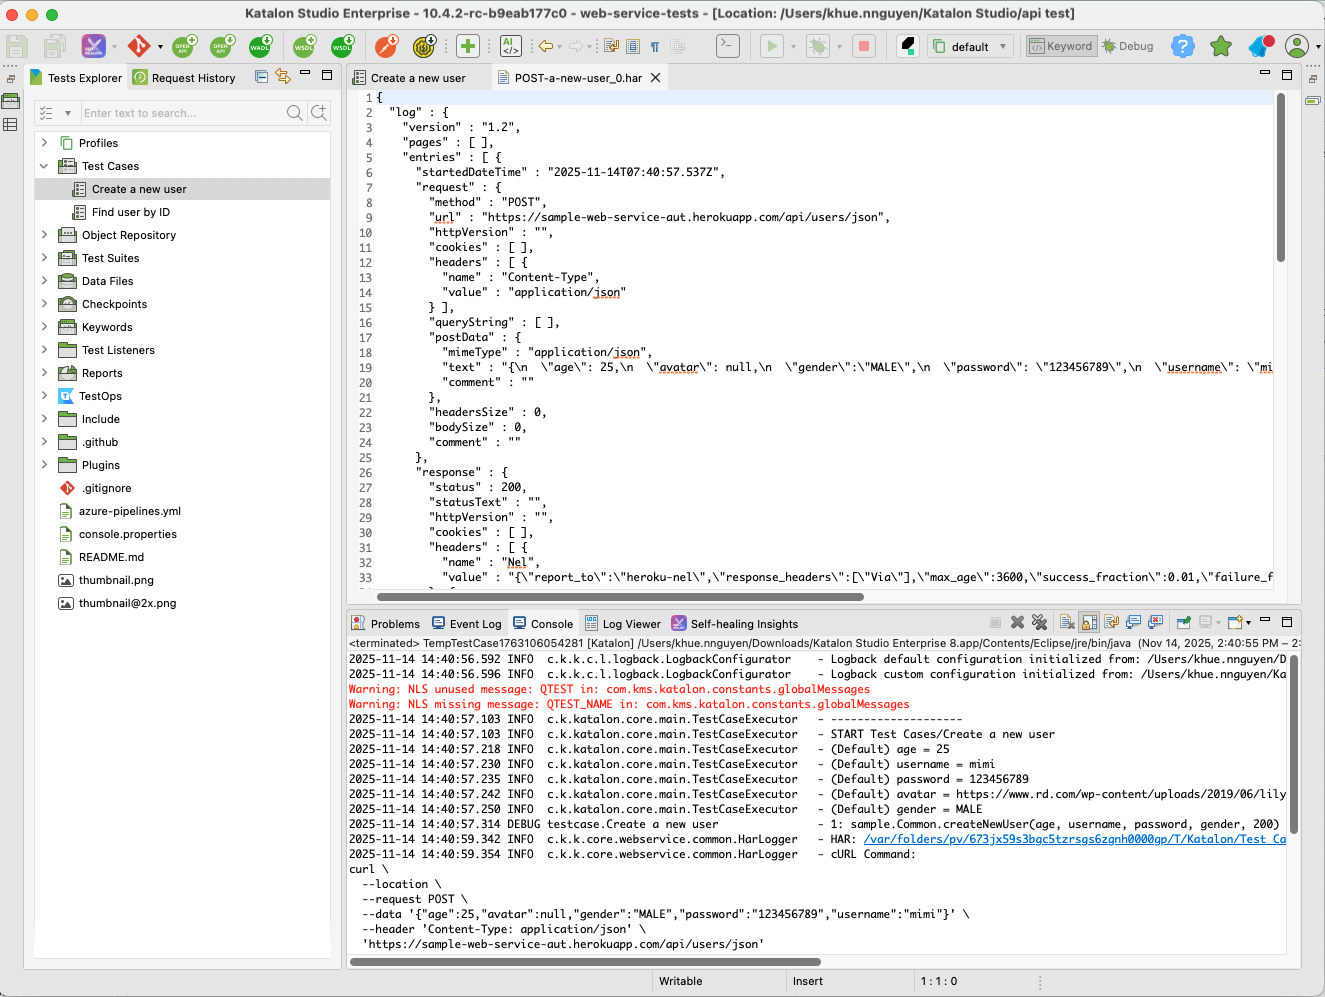
Sending and receiving Web Service can be a troublesome task due to many factors involved on both the client and server sides. The HAR file contains low-level data to help you identify critical performance problems with Web services quickly.
Katalon Studio includes the HAR file in the Web Service execution log. Upon sending requests, you can access the .har files from the Console tab. The file is stored directly on the current executed machine.
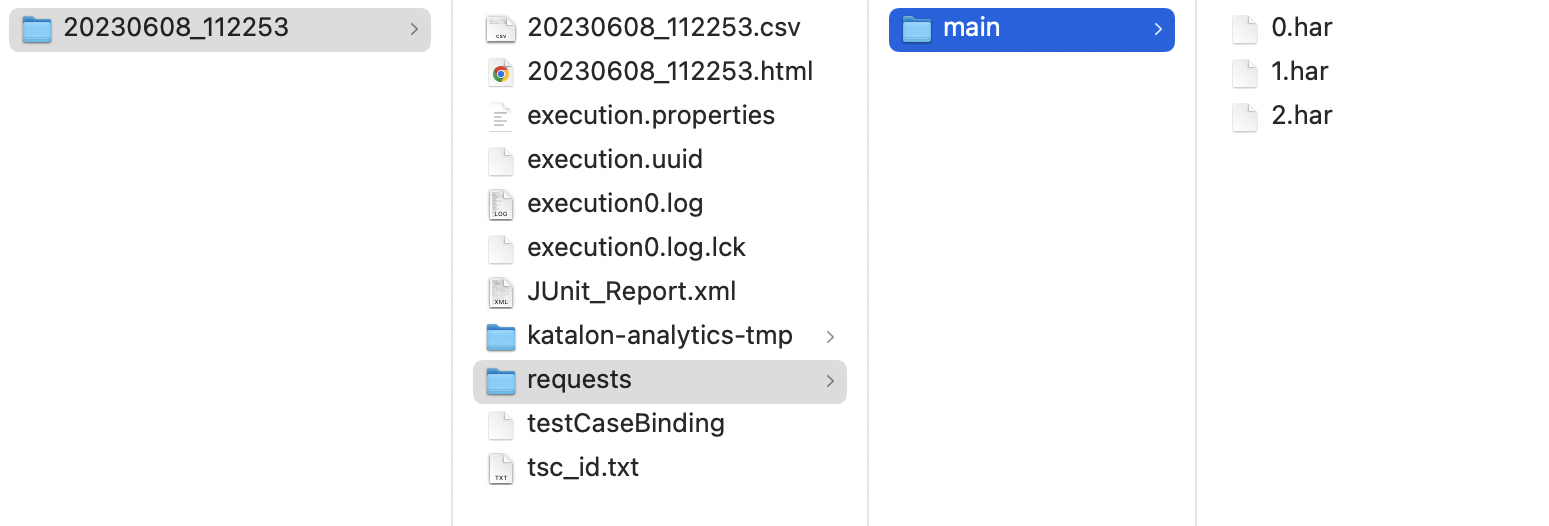
If you execute Web Service test suites, you can right-click at the desired Report folder and choose Open containing folder. The .har files are stored in the main folder of the generated reports folder. For example, the file path can be 20230608_112253/requests/main/0.har.
Using the .har file in services analyzer such as HAR Analyzer of Google Admin Toolbox can provide quality insights about the Web Service request and response. This helps the project team quickly identify key issues and efficiently allocate resources to address the issue. Some issues that can be identified include:
- Performance issues: slow page load, a timeout when performing a specific task
- Page rendering issues: incorrect page format or missing information
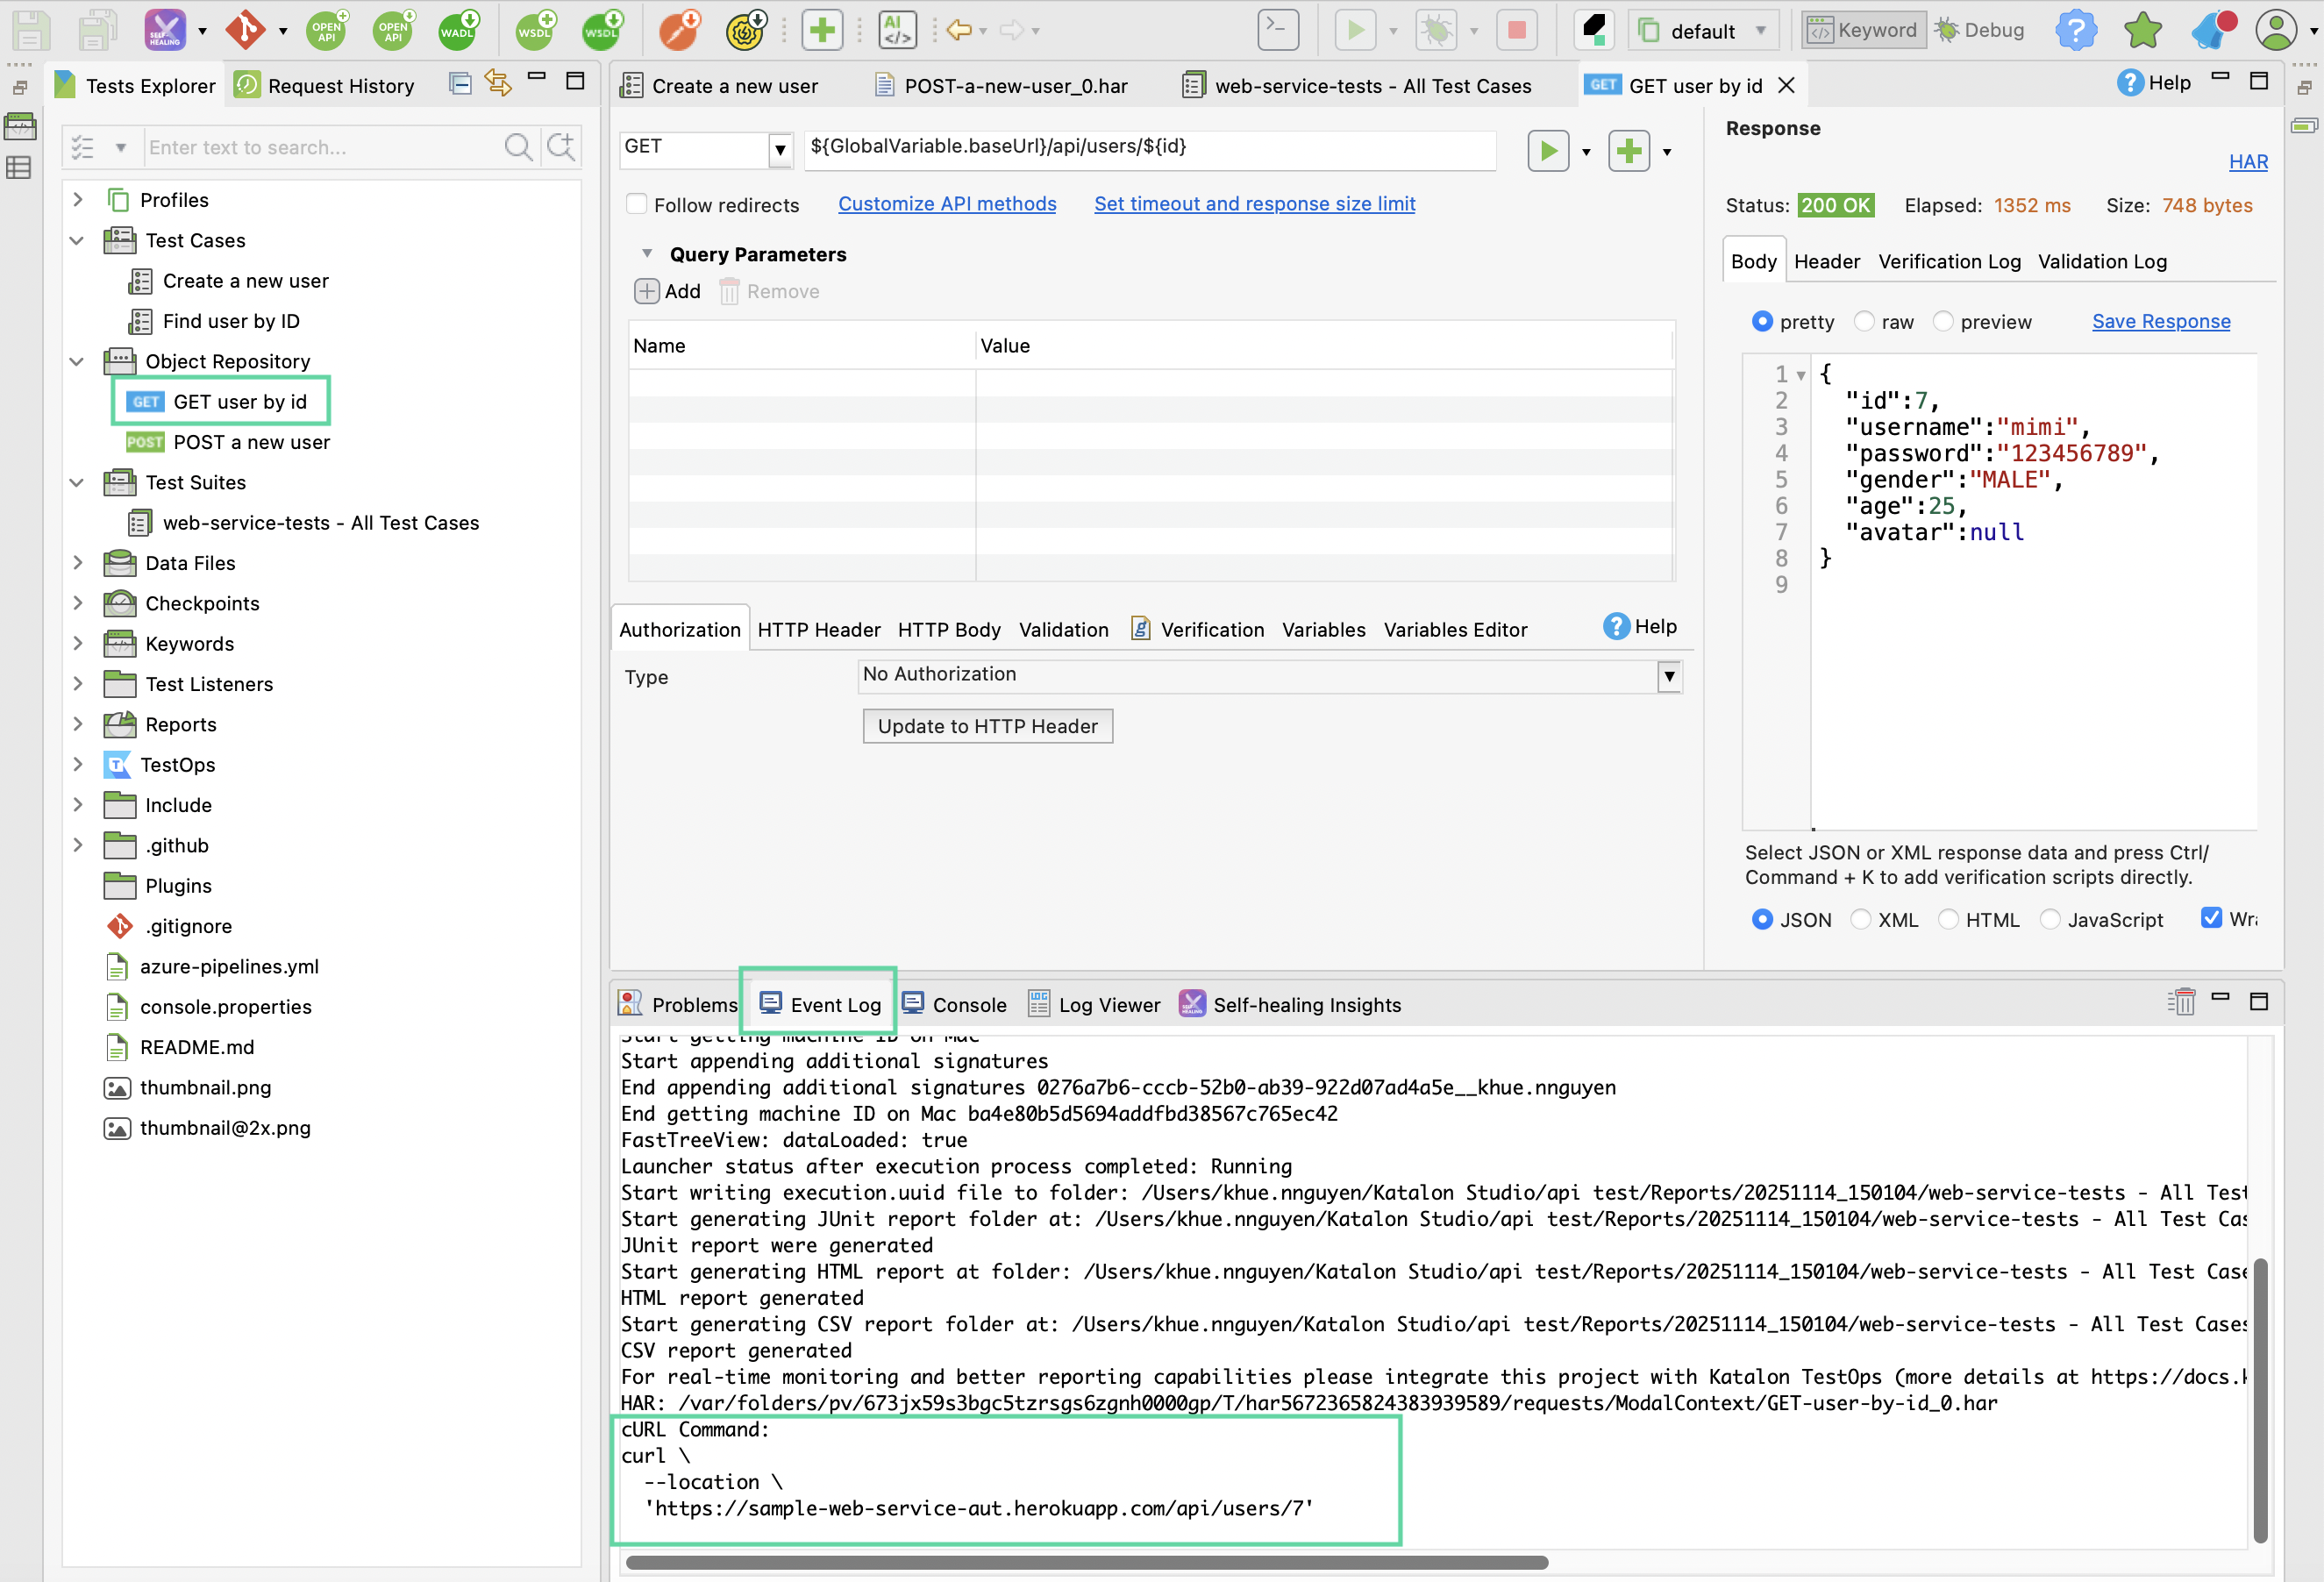
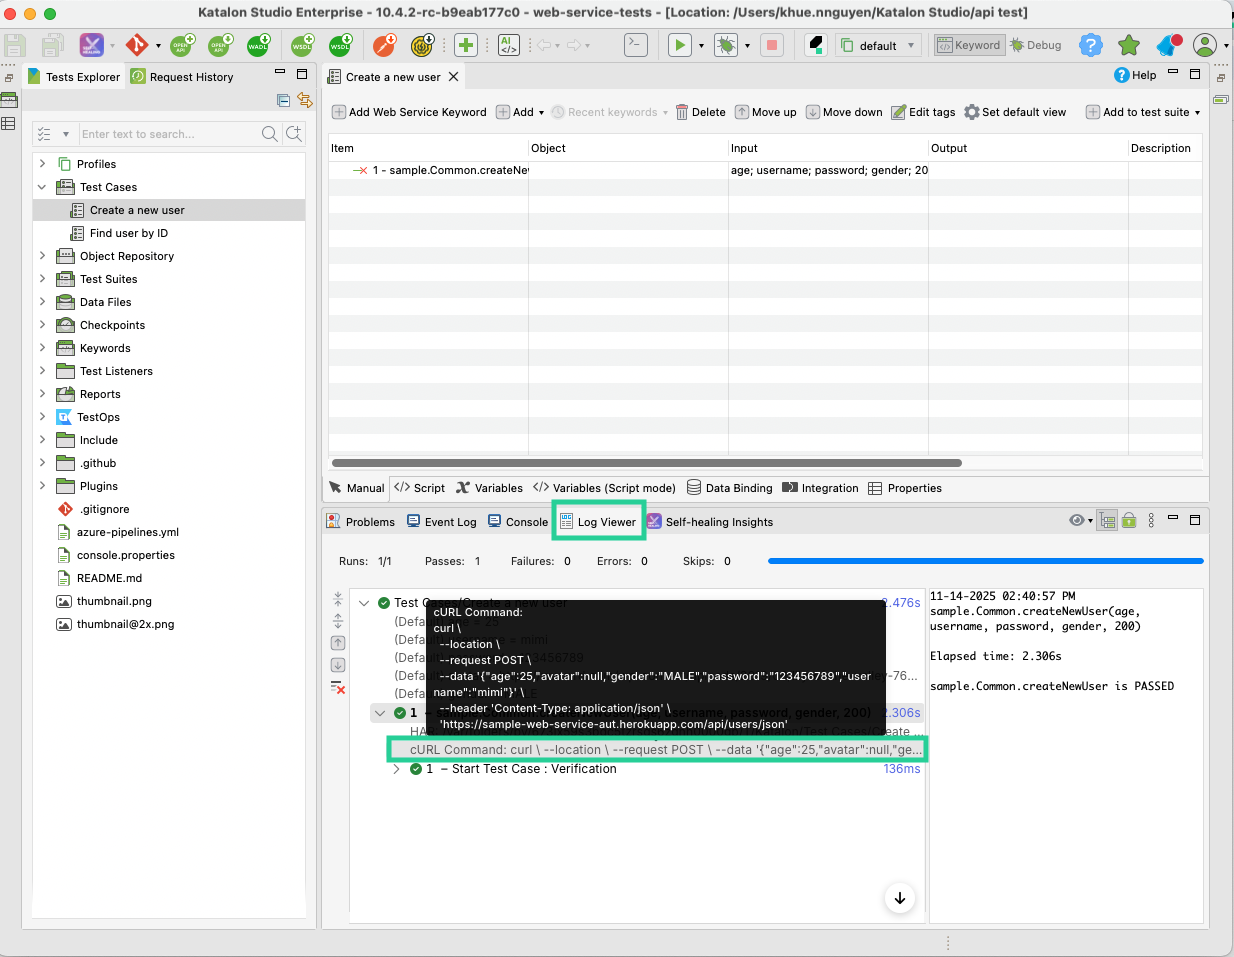
cURL command logging for API requests
Katalon Studio generates a cURL command for each executed Web Service request.
You can copy the cURL command to:
- Share exact requests with developers or DevOps without manual setup.
- Reproduce and debug issues quickly.
- Work seamlessly with tools like Postman or browser DevTools.
- The cURL stored in the
HARfile is identical to the one printed in the log. - For AWS, NTLM, and Digest authentication, the cURL command will not include authentication details. Other authentication types will appear in the Console or Event Log.
- The cURL command supports a maximum payload size of 20 KB; any data beyond this will be truncated.
- When executing from the Object Repository → cURL appears in the Event Log.
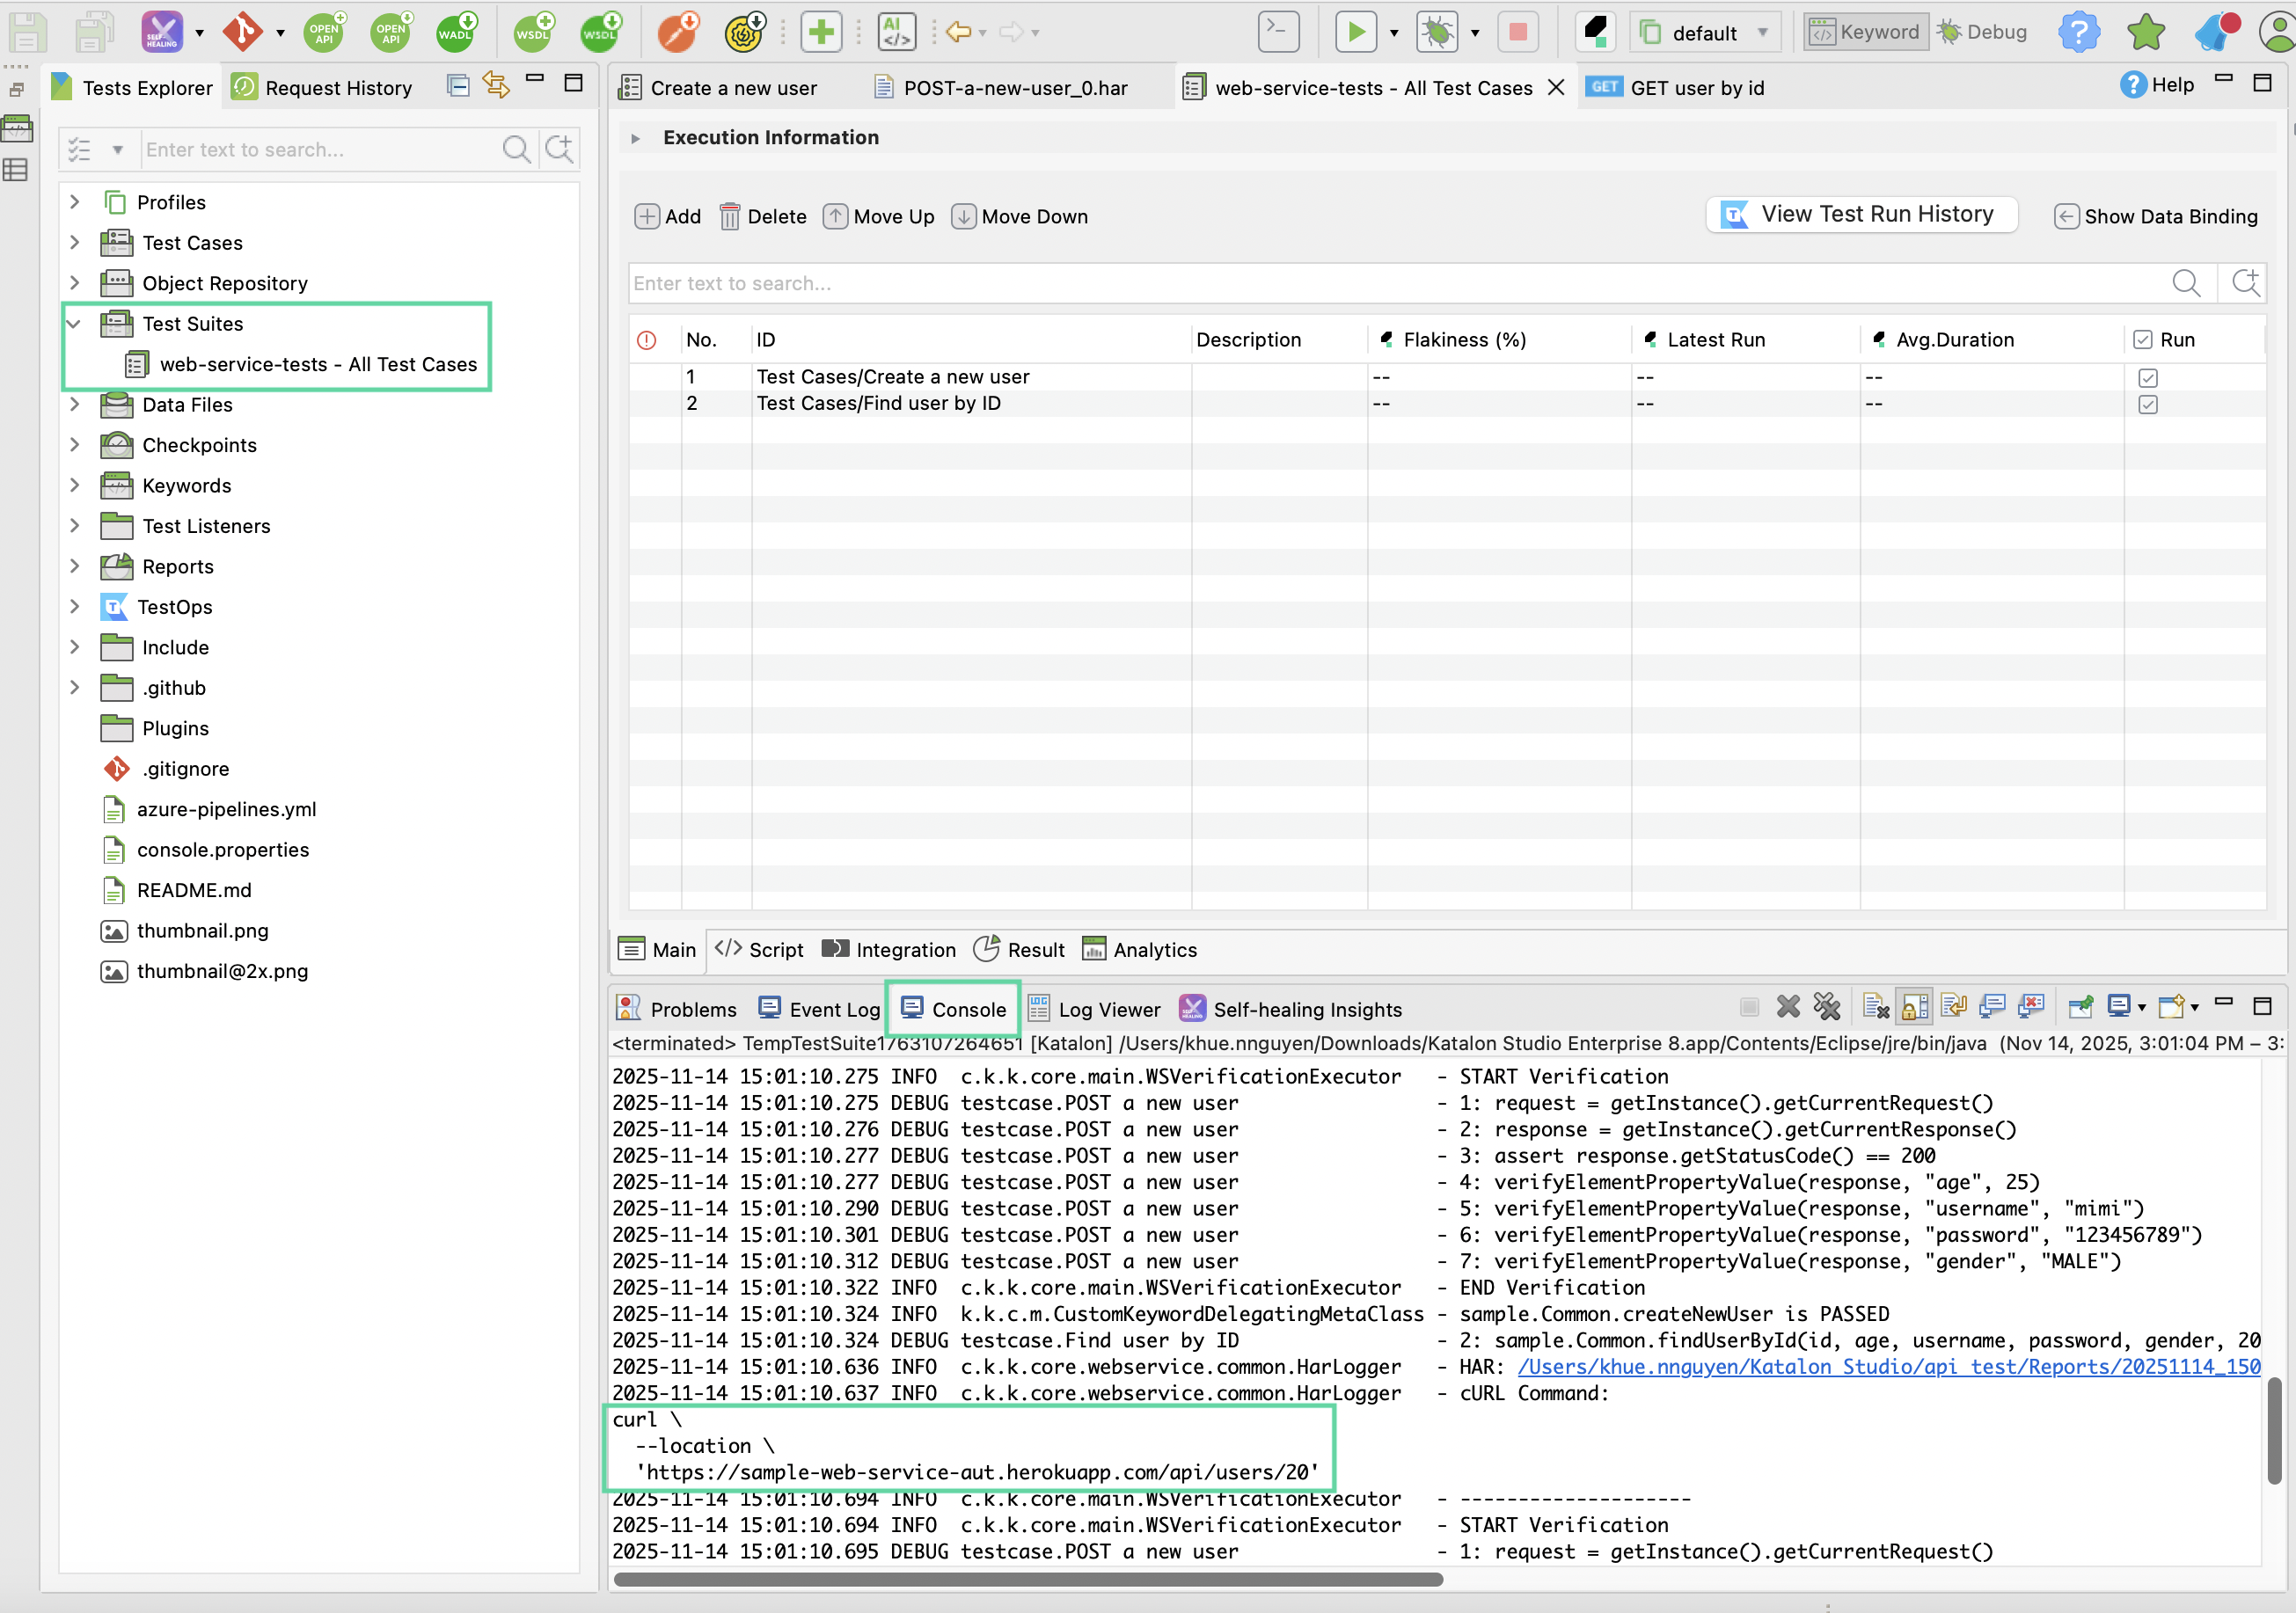
- When executing from a Test Case or Test Suite → cURL appears in the Console and Log Viewer.
- When you expand the corresponding API request entry in the Log Viewer panel, the generated cURL appears as a formatted block under the request details.
Logs Configuration
The deepest level of logs is called TRACE. Use the TRACE level when you need more log details than DEBUG level, which is used by default. You can also lessen the logs' details by using the INFO level.
In case you want to change the log's level of one or multiple packages, this setting is located and stored in Include > Config > log.properties file.
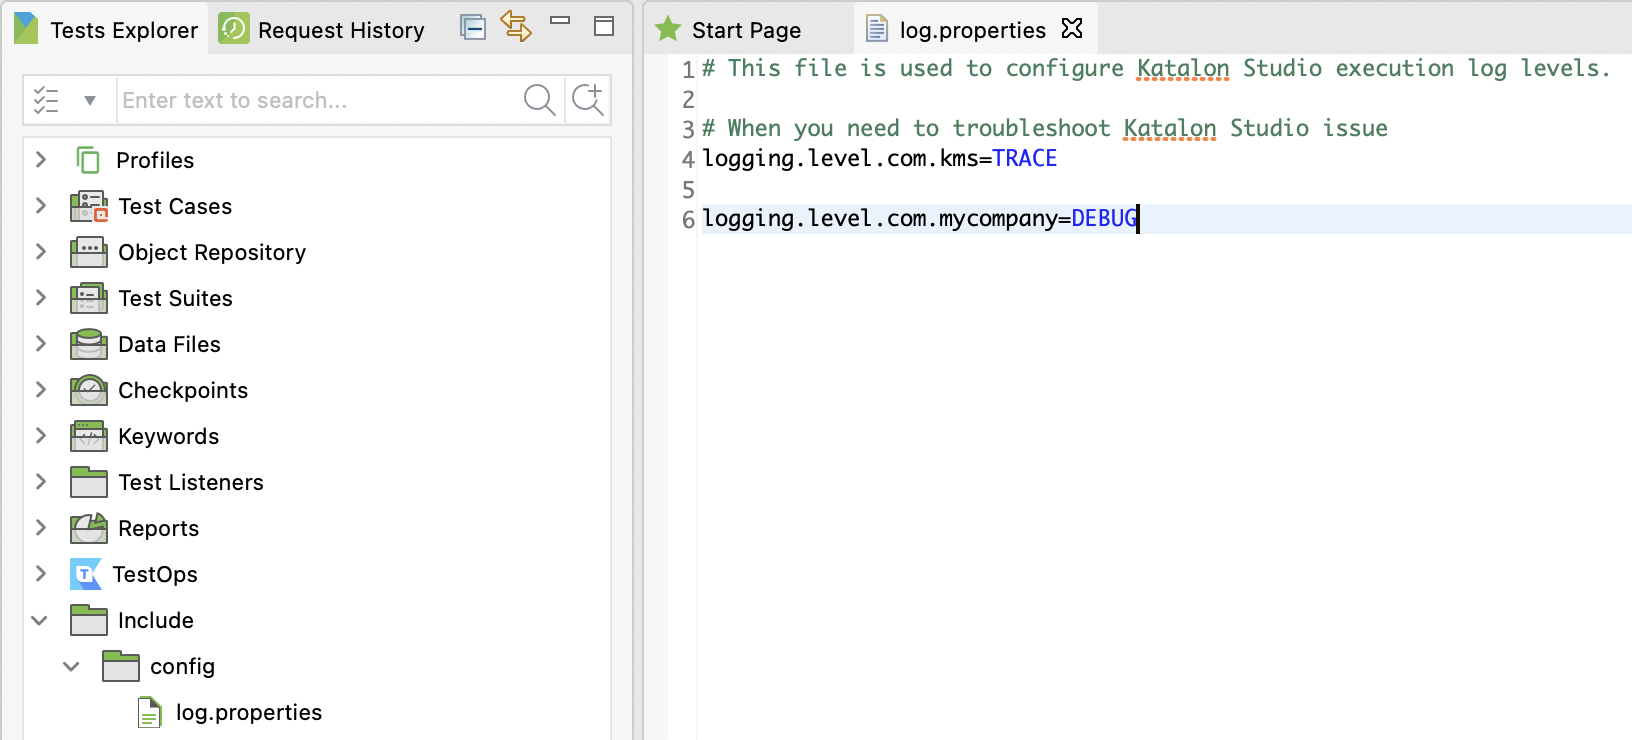
By uncommenting the logging.level.com.kms=TRACE line, the differences are noticeable:
Before
After
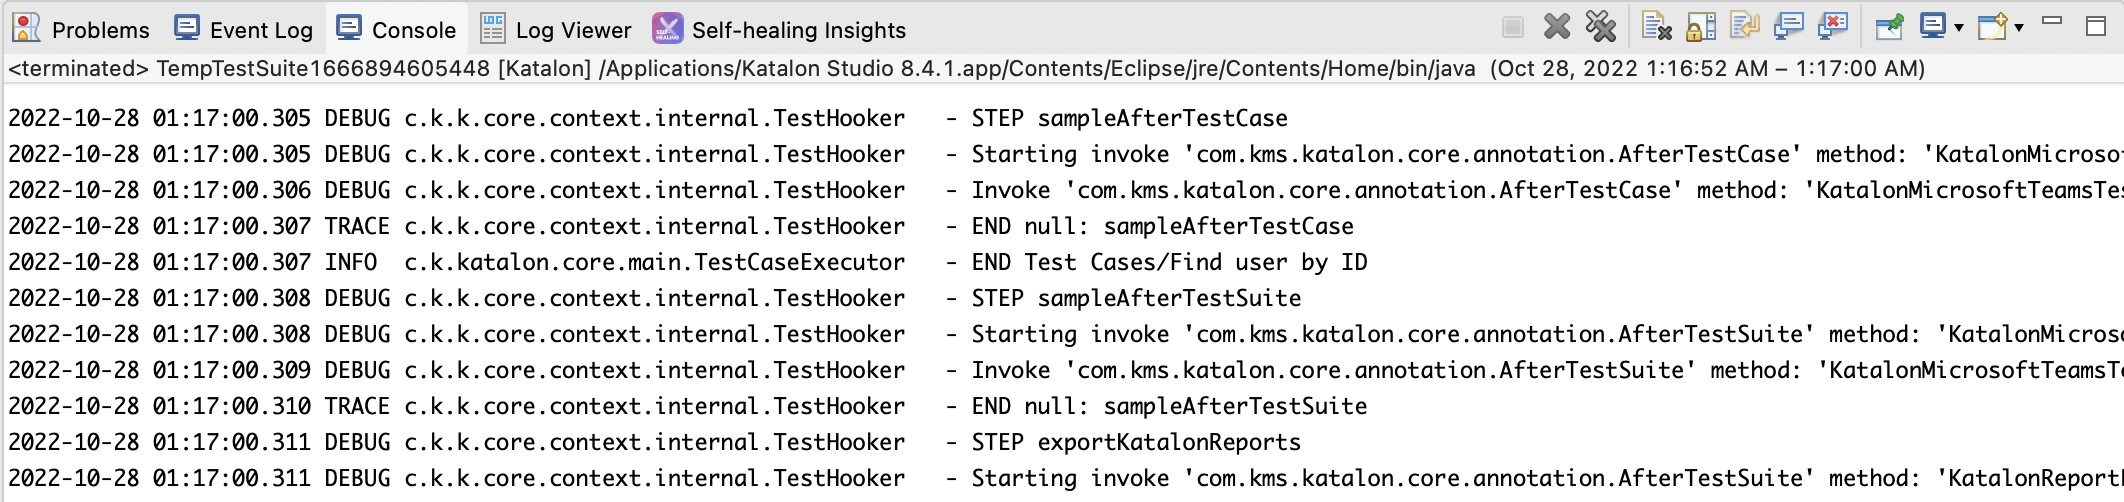
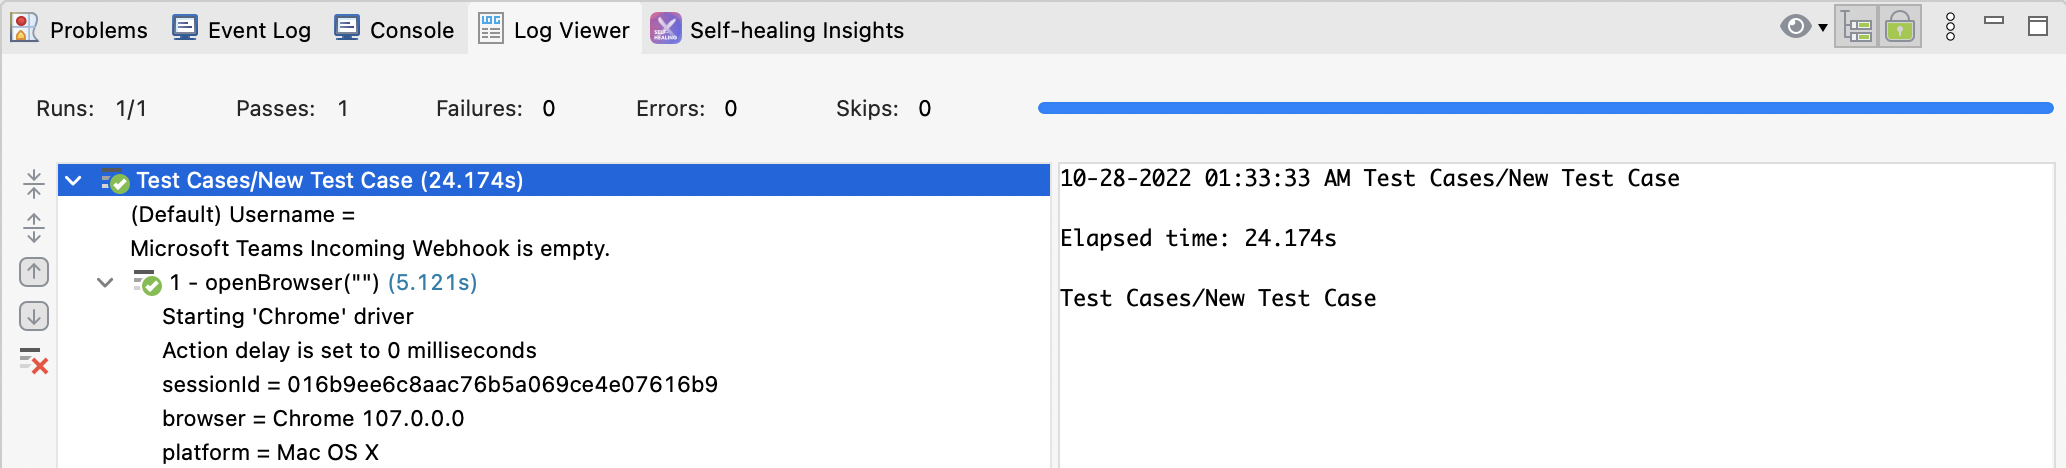
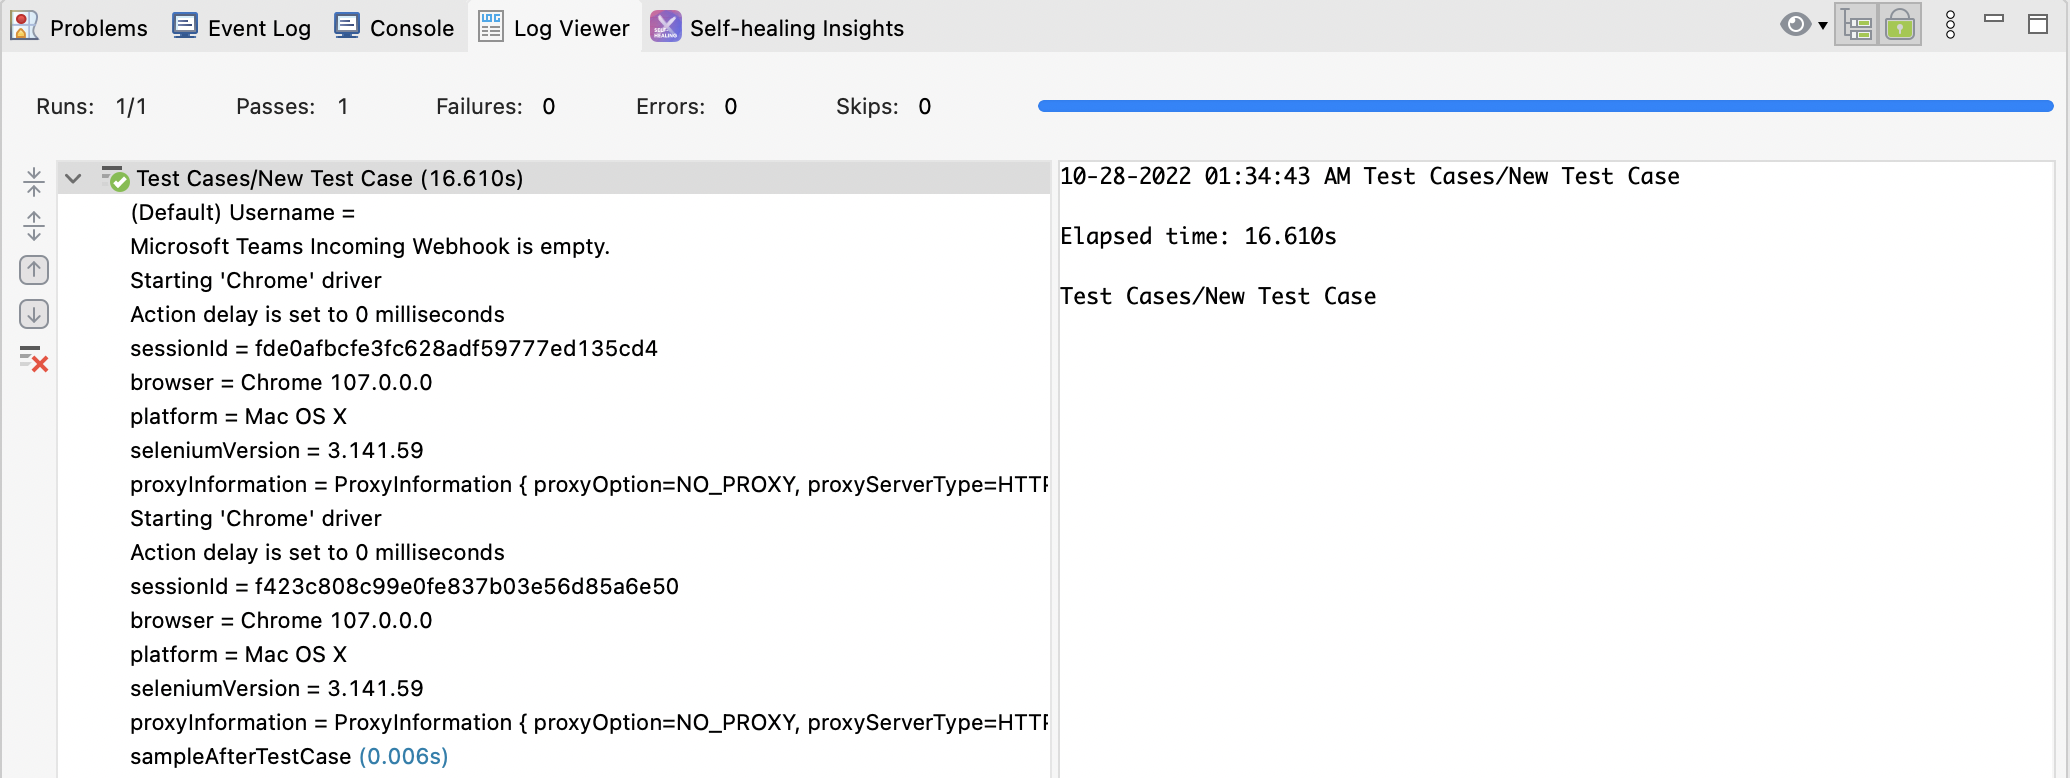
Log executed test steps
Go to Project Settings > Executions and find the option for Log executed test steps. By enabling or disabling this option, you can decide whether the logs include executed test steps.
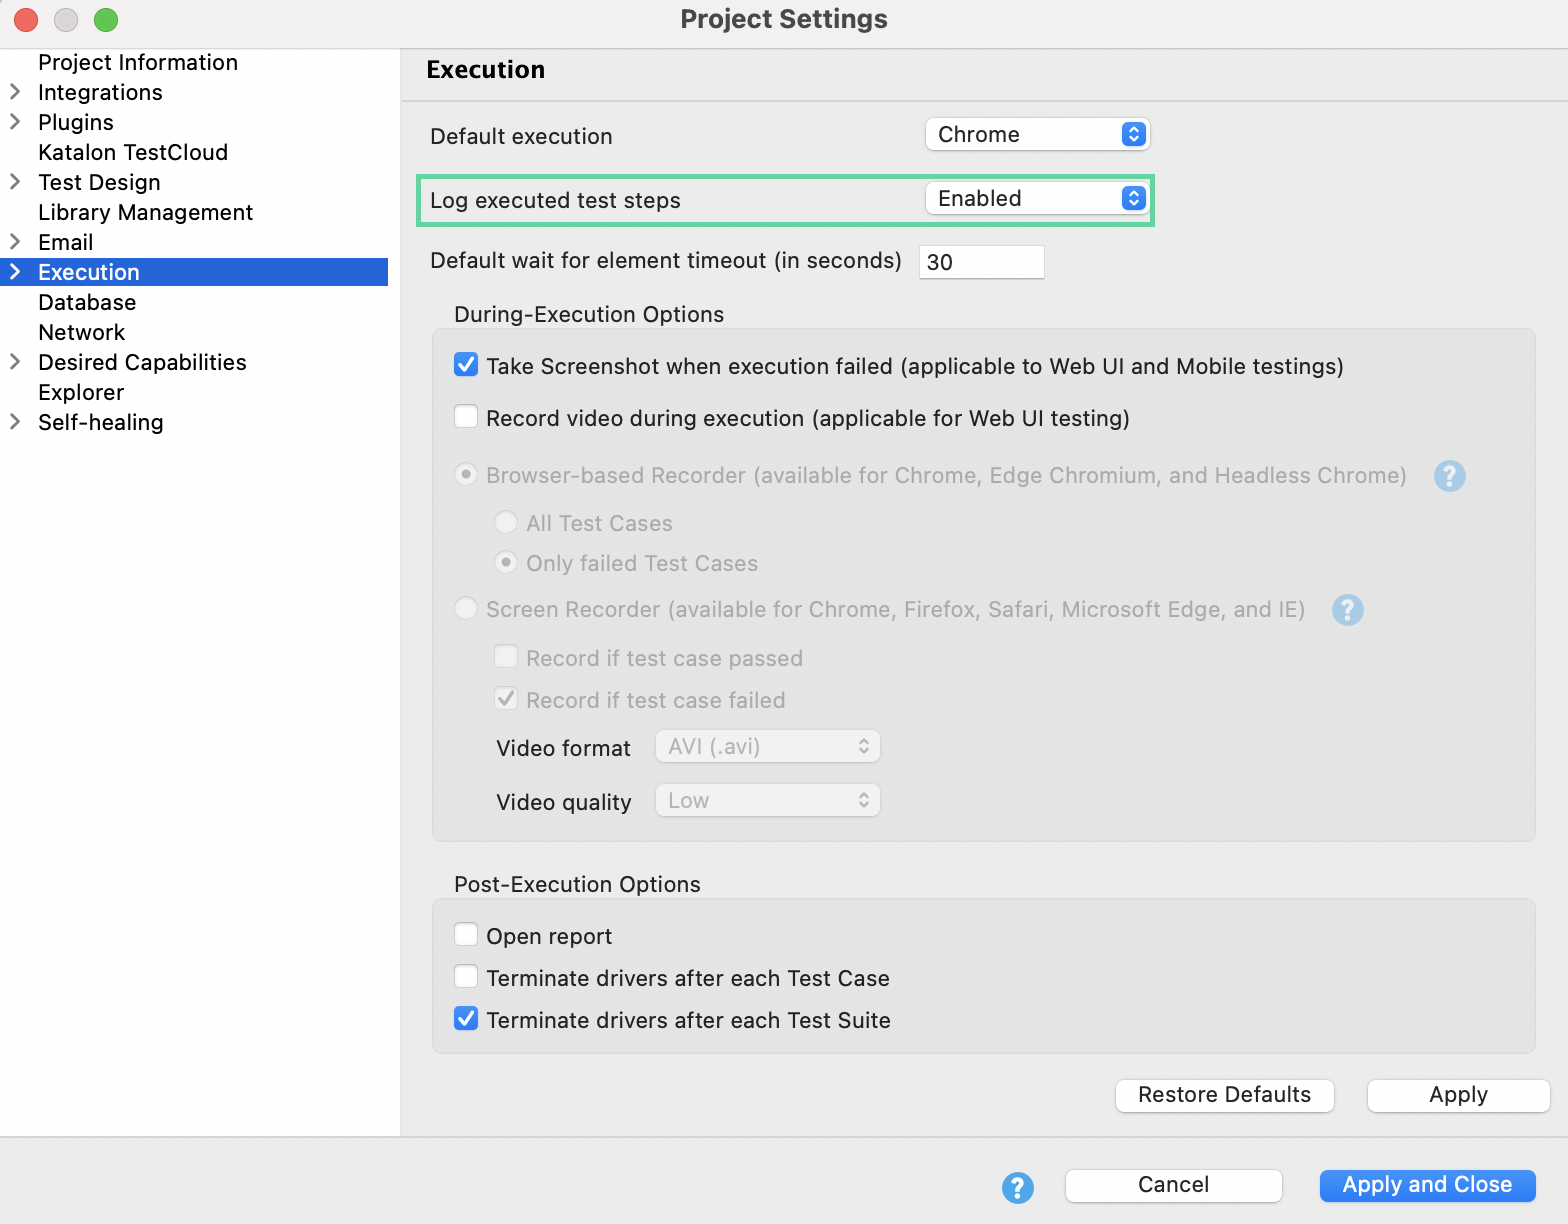
Enabled
Disabled
Summary
- Katalon Studio execution logs are enhanced for a better debugging process and observation of execution progress.
- The log level can be configured directly from the
log.propertiesfile. - A
.harfile is generated and stored in Web Service request logs. It can be used to analyze and troubleshoot performance or connection issues (if any). - Logs can be set to include or exclude the executed test steps.
Learn more about working with the execution log in our Katalon Academy course: Katalon Studio: How To Work With Execution Logs and Test Reports.