View test suite and test suite collection reports in Katalon Studio
Test suite report
You can view reports directly inside each test suite page.
After executing a test suite, to see the test suite report, go to the Result tab.

| Component | Description |
|---|---|
| Test cases table | List of executed test cases. |
| Summary tab | Information of the executed environment and summary of the execution result. |
| Execution Settings tab | Settings of execution browsers/devices. For example:
|
| Execution Environment tab | Other information about the executed system. For example:
|


Test cases table
The summary information of all executed iterations done in the test suite is displayed here. Each time when a test case is executed with a test data row is considered an iteration.

You can filter reports based on their execution status:
| Filter | Description |
|---|---|
| Passed | Show only iterations which are passed. |
| Failed | Show only iterations which are failed. |
| Error | Show only iterations having errors. |
| Incomplete | Show only incomplete iterations. |
| Skipped | Show only skipped iterations. |
If qTest and JIRA are configured in project settings, you can submit data to those systems. To learn more about qTest and Jira integration, you can refer to the following documents:
Test suite summary
This section gives the summary information of the test suite:

| Field | Description |
|---|---|
| Test Suite ID | The ID of the executed test suite in Katalon Studio. |
| Hostname | The hostname of the environment where the test suite was executed. |
| Local OS | The OS used to open Katalon Studio. |
| Platform | The OS, browser, and browser version used to execute the test. |
| Start / End / Elapse | Execution start/end date time and duration. |
| Total TC | Total number of test cases and their execution status. |
Test case log details
To view details of the executed logs, in the Test Case Table, select an iteration and click Show Test Case Details.

- Test Log: Details regarding all the executed steps and their status are displayed in this tab.

| Component | Description |
|---|---|
| Test Log Information tab | Information of the test step selected in the Test Case's Log section:
|
| Test Log Image tab | The screenshot taken from the application under test, it is captured in either of the following situations:
|

You can determine which type of information to be displayed by using the provided filters:
| Filter | Description |
|---|---|
| Info | Show the messages logged for information/reference. |
| Passed | Show the steps which are successfully executed. |
| Failed | Show the steps which are failed to execute. |
| Error | Show the steps having errors. |
| Incomplete | Show incomplete steps due to other factors such as wrong syntax, power shortage, disconnected network, etc... |
| Warning | Show the steps which have warning status. |
| Not Run | Show the skipped steps. |
If you have configured Jira integration, you can submit a ticket to this system. For further details, you can refer to this document: Submit an issue to Jira.
Screenshots are taken for the failed steps, and you can hover the mouse cursor over the attachment icon to review.
- Information: You can find the summary information of the test case in this tab.

| Field | Description |
|---|---|
| Test Case ID | The ID of the executed test case in Katalon Studio. |
| Start / End / Elapse | Execution start/end date time and duration. |
| Description | The description of the test case. |
| Message | Any system message raised when this iteration was executed. |
- Integration: The information regarding qTest or JIRA integration of this iteration is displayed in this tab.

Test suite collection report
After executing a test suite collection, to see the test suite collection report, go to the Result tab.

| Field | Description |
|---|---|
| ID | The ID of the executed test suite in Katalon Studio. |
| Environment | The environment in which the test suite is executed. |
| Status | Information about whether the execution is completed or not. |
| Failed Tests / Total | Total test cases in the test suite and the number of failed test cases, if any. |
| Test Suite Details | Shows test suite reports, see above: Test suite reports. |
Report history
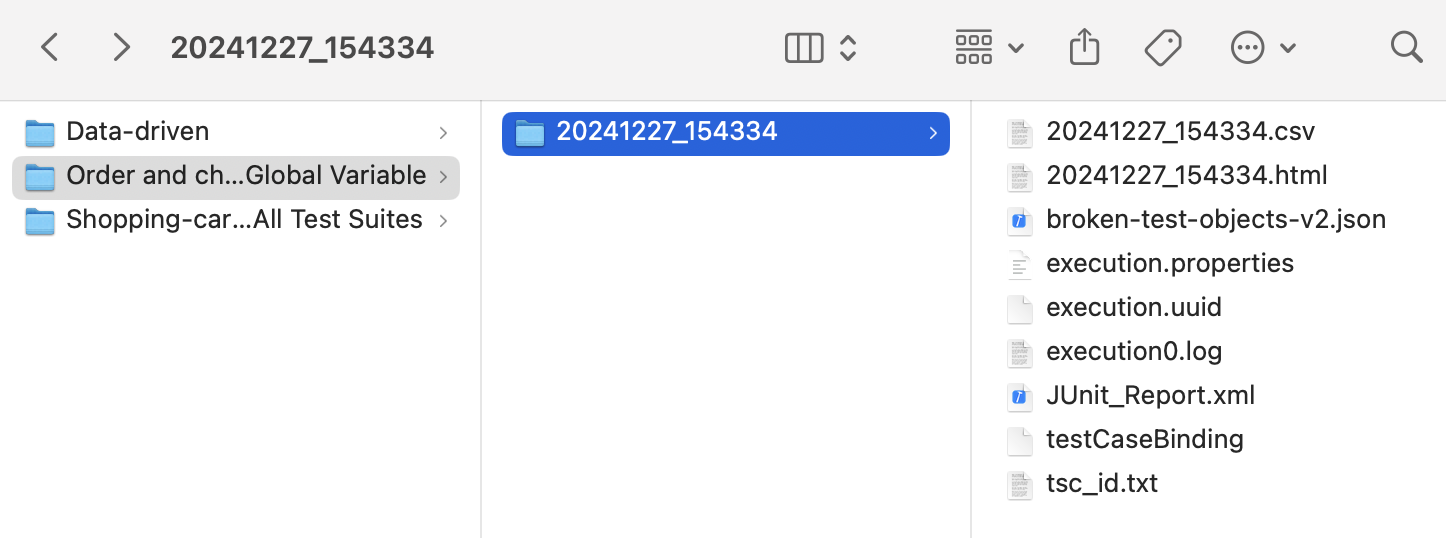
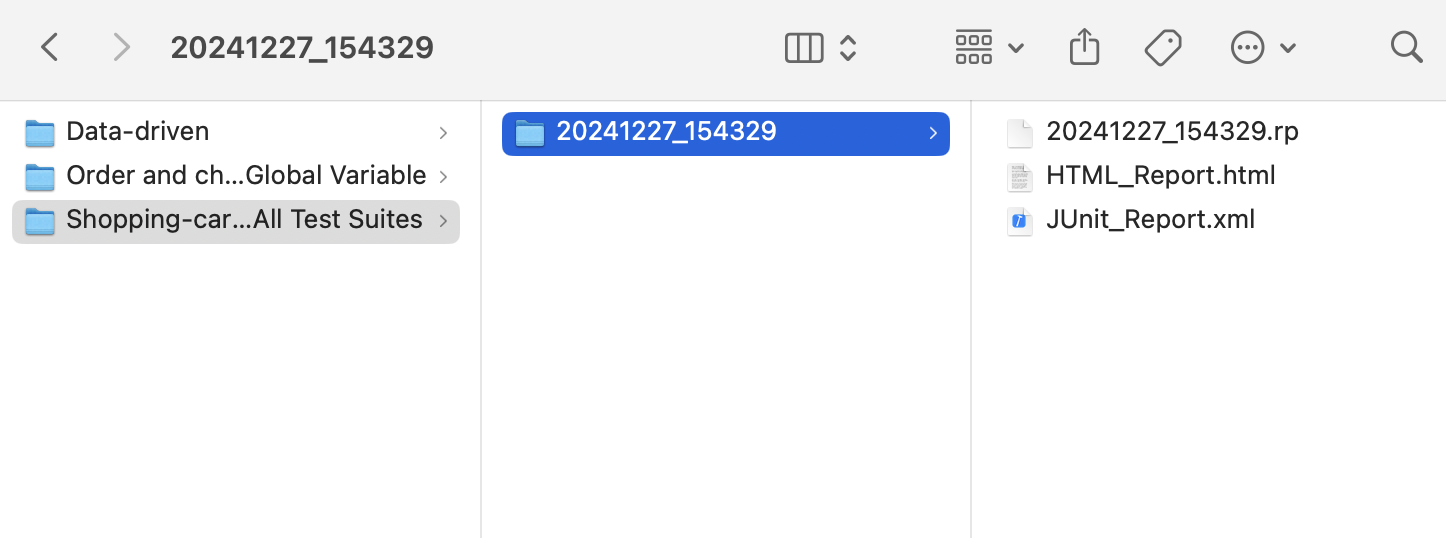
Once a test suite/test suite collection finishes its execution, a report is automatically generated and stored in the Reports folder.
For example:

The report is named with the following naming convention: YYYYMMDD_HHmmss, corresponding to the date and time of the start of the execution.
Report settings
Automatically generate reports
This feature enables auto-generation of reports in the selected format.
Follow the steps to automatically generate test reports for you after test execution:
-
Go to Project > Settings > Report.
-
Select your preferred format/s for the reports generated after each test suite execution. You can select at least one of the following available formats:
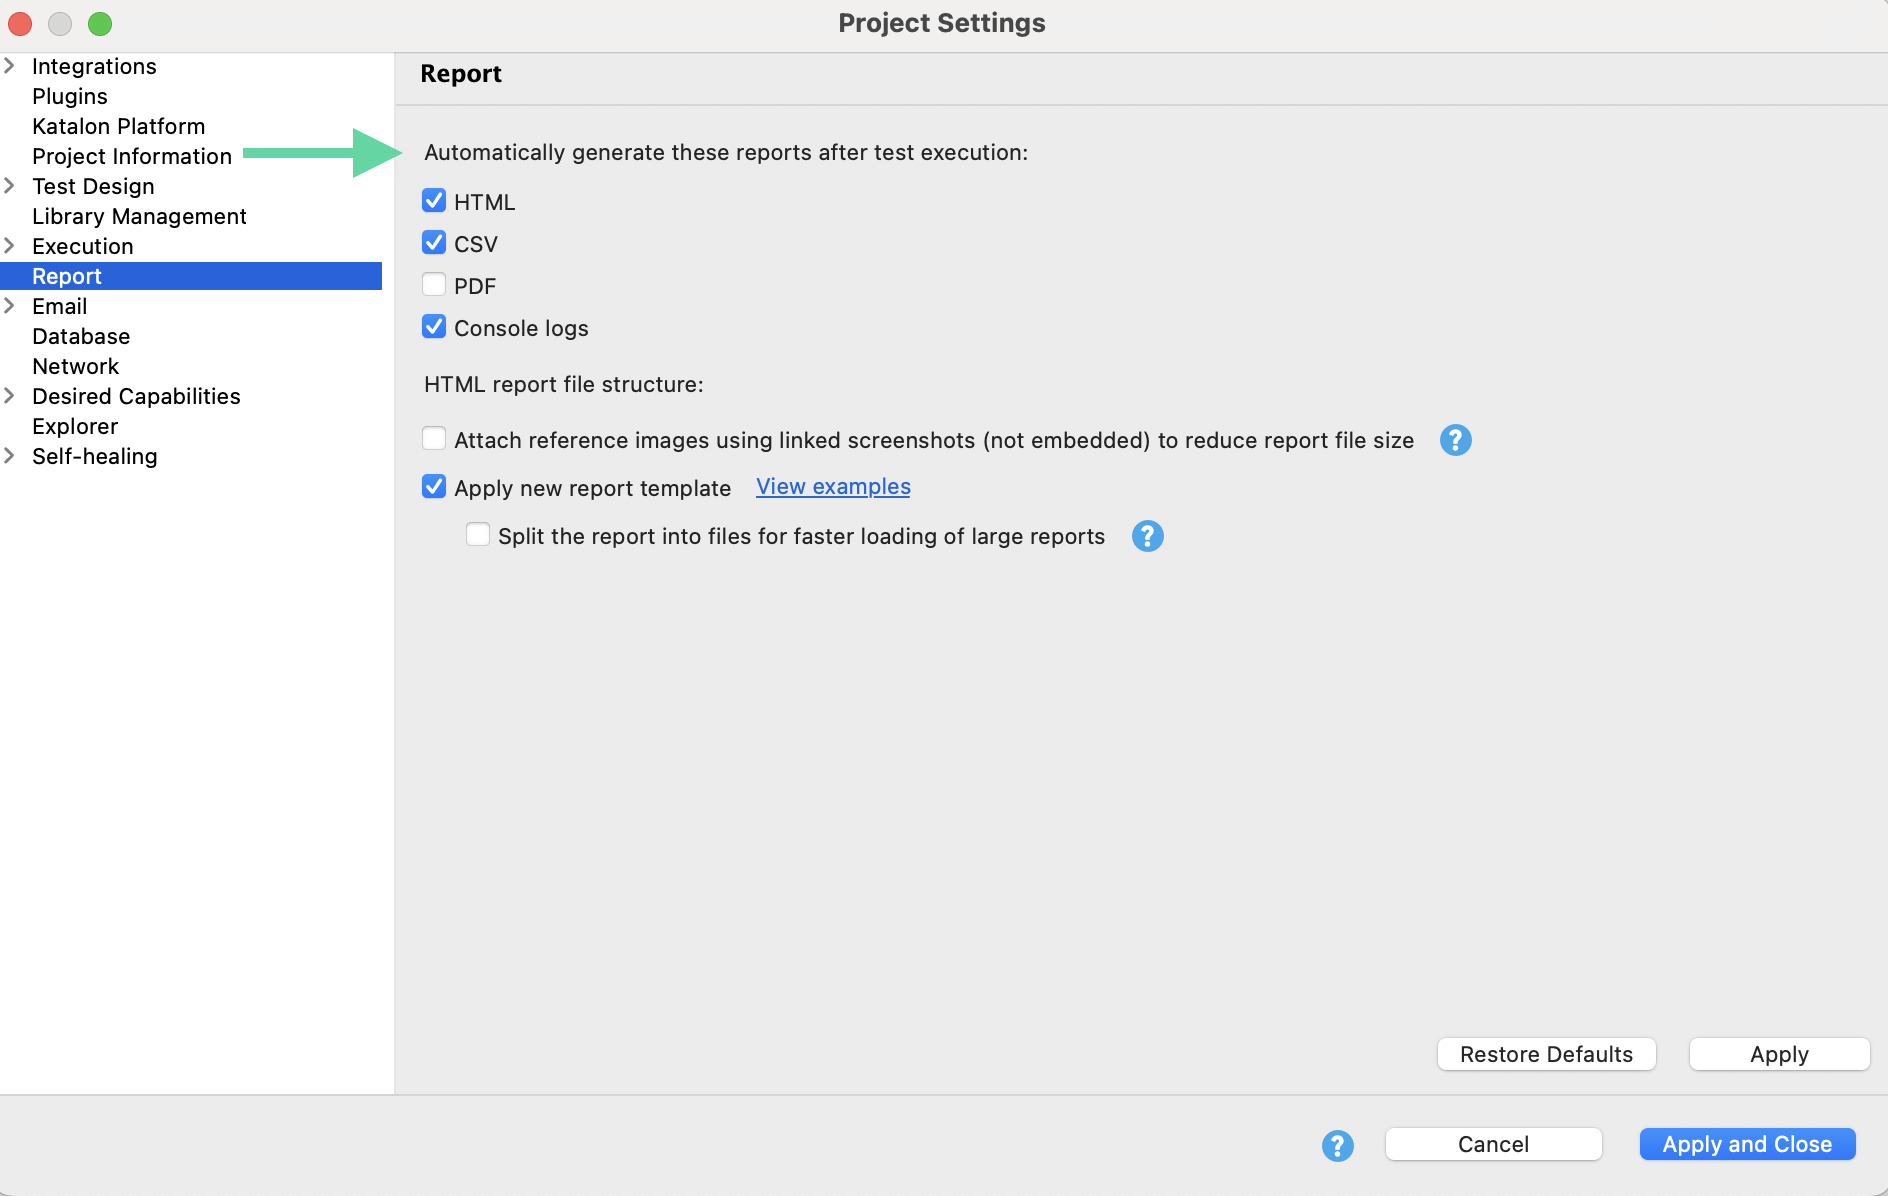
- HTML (
.html) - Provides a comprehensive, browser-viewable summary of test results. - CSV (
.csv) - Spreadsheet-friendly format ideal for data analysis and integration with other tools. This is useful for creating custom dashboards or importing into reporting systems (e.g., Excel, BI tools) - PDF (
.pdf) - Printable, static snapshot of the test execution summary, which is ideal for sharing with stakeholders or archiving formal testing evidence. - Console logs (
console0.log) - Captures raw execution logs output by Katalon Studio during runtime and is useful for debugging, error tracing, and detailed execution review. When the primary log file exceeds the configured max size (e.g., 10MB), additional files likeconsole1.log,console2.log, etc., are generated.
- The CSV and PDF options are available for test suite reports only.
- When exporting test reports to PDF file, special characters will be converted to UTF-8 format.
- Starting from 10.4.0, AI Failure Analysis is included in HTML test reports. It provides instant, plain-language explanations for test failures. Learn how to enable and use this time-saving feature here: Katalon AI Assistant Failure Analysis.
- Click Apply or Apply and Close to save and apply your report configuration.
HTML report file structure
When test executions are long or contain many screenshots, the report size may become too large, potentially causing issues when generating or viewing it.
To address this, enable the following option for HTML reports: Attach reference images using linked screenshots (not embedded) to reduce report file size. This option reduces HTML report size by saving screenshots as separate files in the Reports folder. The HTML report will reference these images via relative paths instead of embedding them.
 to reduce report file size")
Below is an example comparison of file sizes for an HTML report:
-
Without enabling the option: The report size is 271,7 MB (with screenshots embedded).
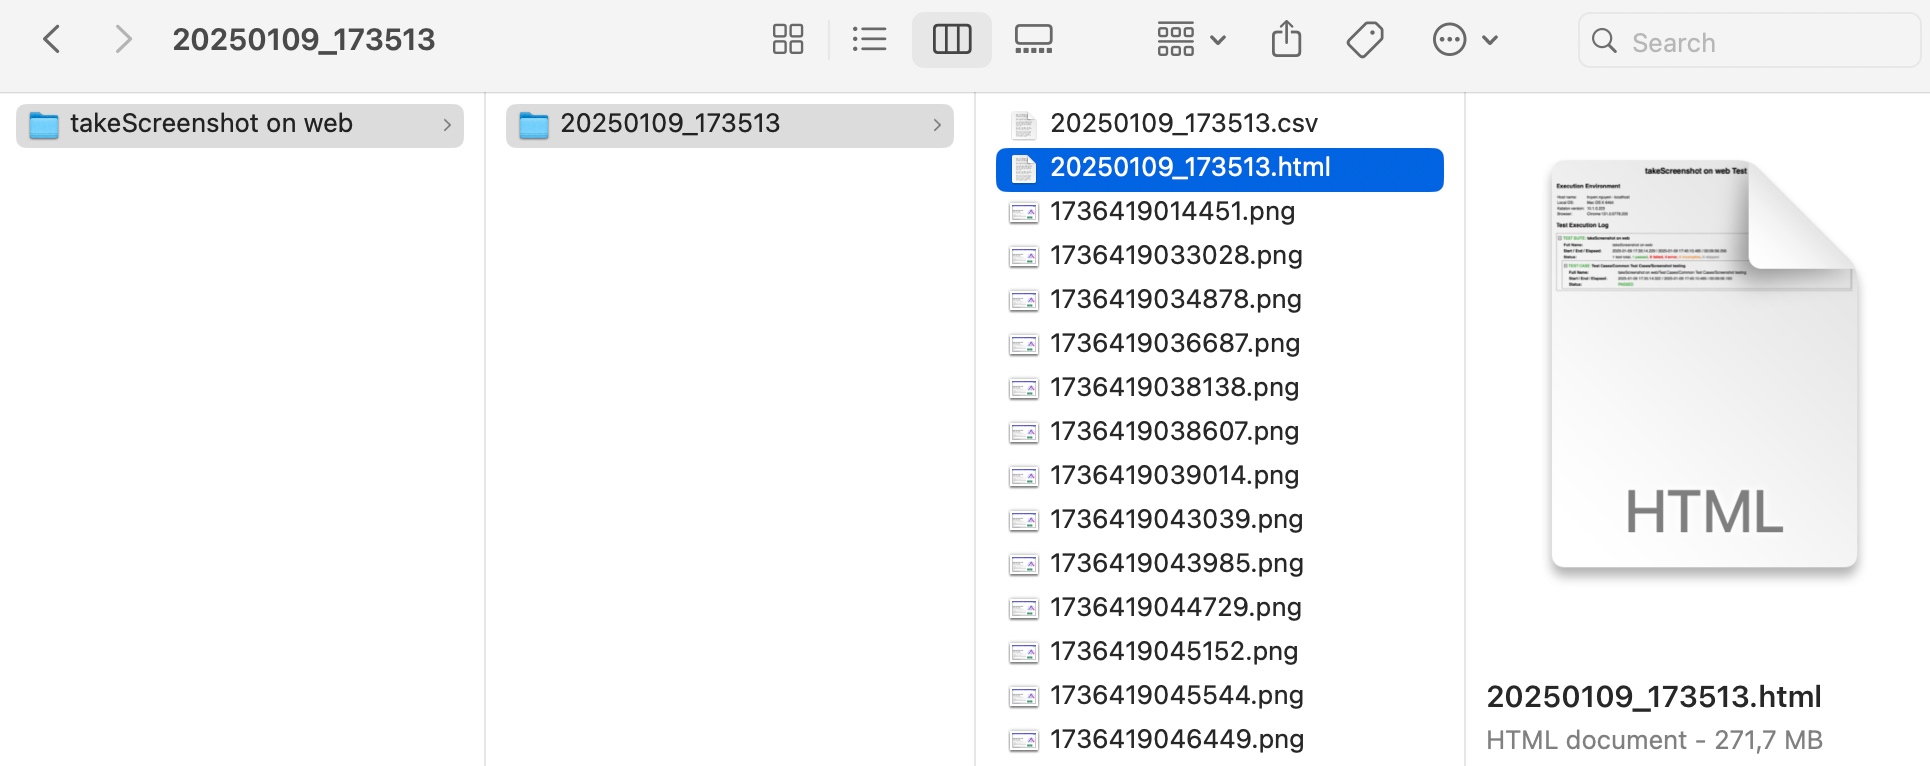
- With the option enabled: The report size is reduced to 468 KB (with screenshots linked).

When sharing reports, always zip the entire Reports folder to ensure all linked assets (like images) are included.
Log file settings only affect the size and speed of log generation. They do not change the content of the logs and are intended for advanced users.
Apply new report template and split report
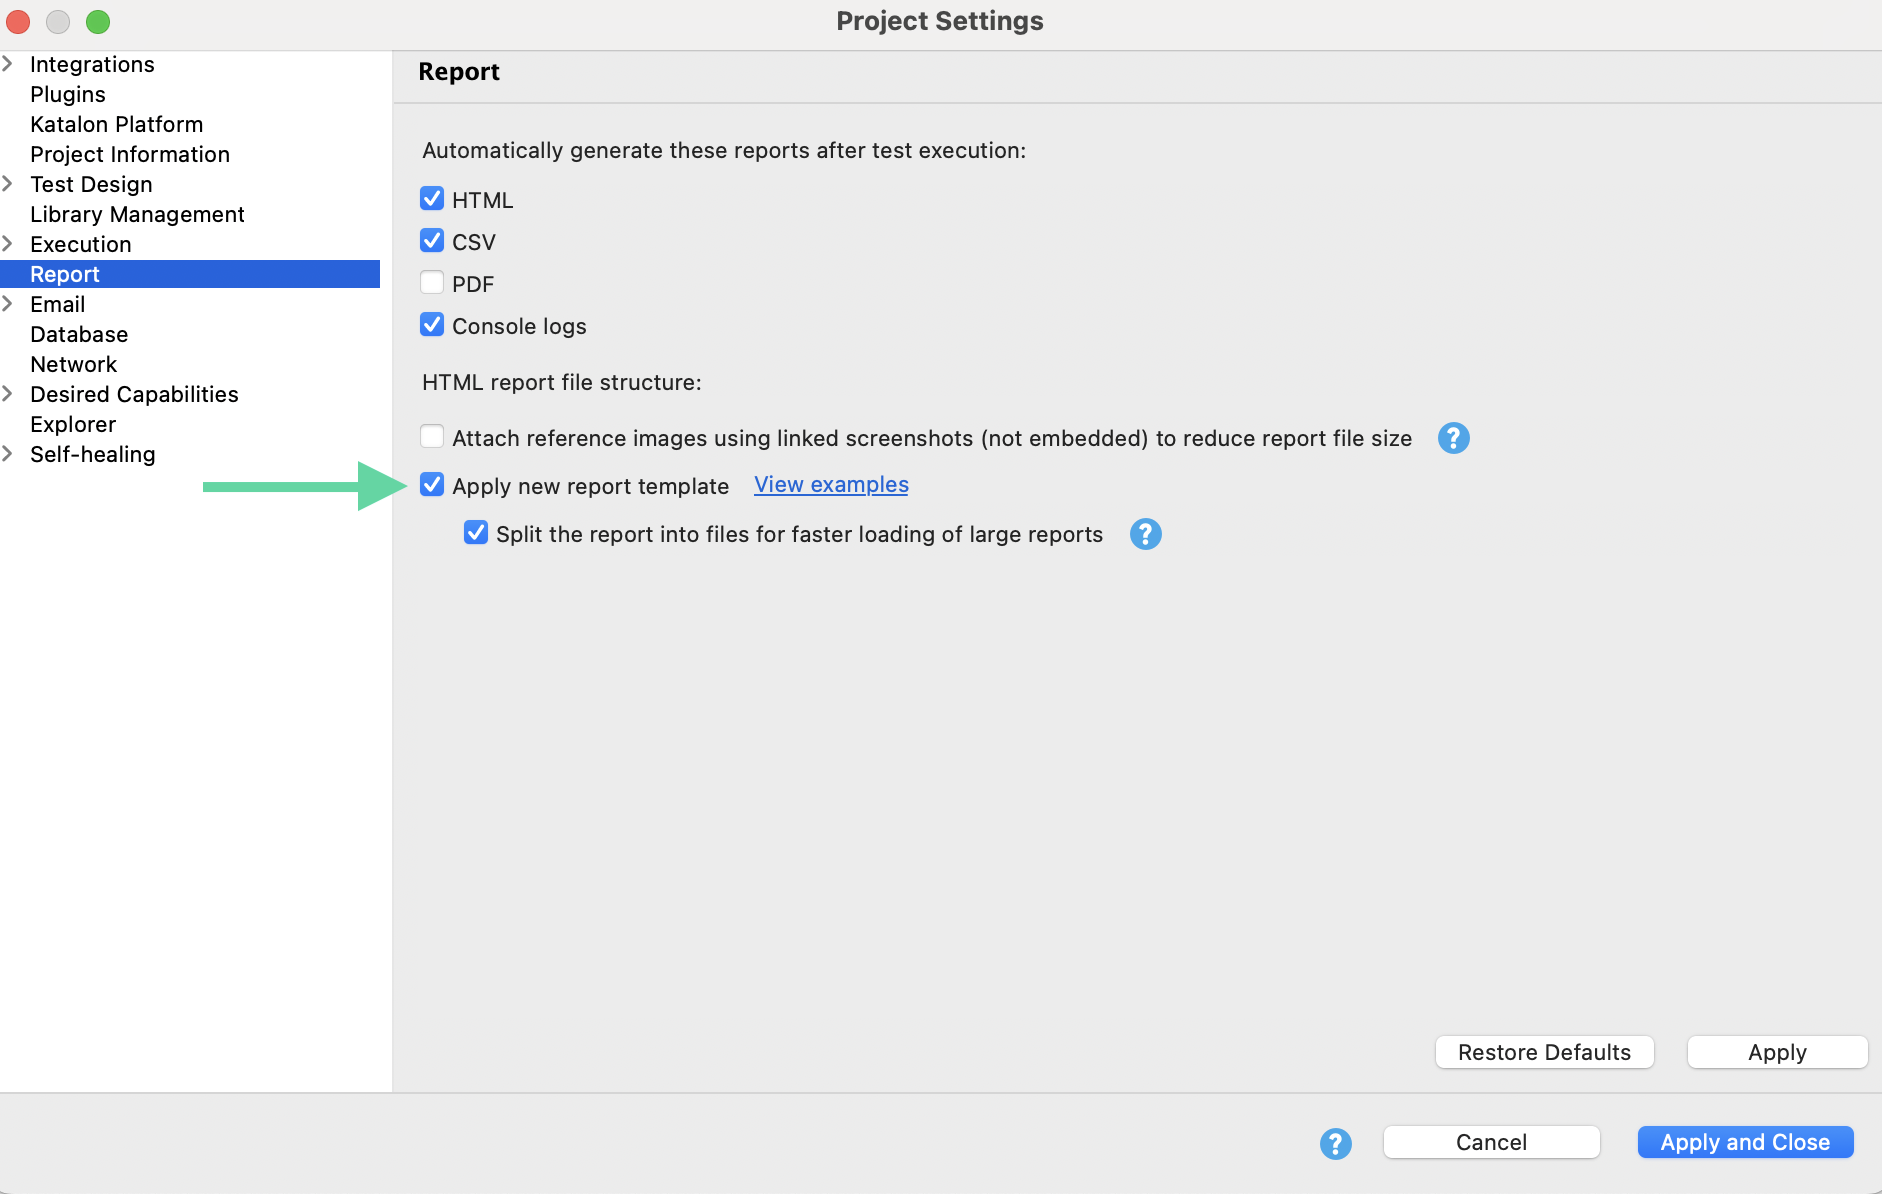
You can now opt in to use Katalon Studio’s modernized HTML report template by selecting the Apply new report template option. This updated format improves readability and usability with a clean layout, status-based filtering, numbered test steps, and expand/collapse functionality.
Click here to view a sample test suite report in the new template: Sample test suite report (HTML).
In a test suite collection HTML report, you can also use shortcut links to navigate to the related test suite report for further details on failed test steps.
- Split the report into files for faster loading of large reports option: Enable this option to improve performance when handling large test reports.
How does this help?
- This advanced setting generates a lightweight overview HTML file containing test case summaries, along with multiple
.jsfiles that store the detailed results for each test case. - This structure reduces memory usage and loading time. Even if some
.jsfiles are missing, the report overview will still be viewable.
- In the HTML report, the Expand All button may not immediately expand all test cases if the Split the report into files for faster loading option is enabled. Expand All works best in reports that are not split.
- When sharing the report, make sure to zip the entire report folder—including the HTML and
.jsfiles. Otherwise, detailed test steps will not be displayed. - Email reporting with this new format is not fully supported yet; only the summary will be included in the email, not the full report.
Manually export reports
For test suite collections, you can export to HTML format only.
To manually export reports, follow these steps:
-
Open the Result view of a test suite or a test suite collection.
-
On the top right corner, select Export report. Then, choose a format to export.

You may encounter errors when generating HTML reports with large sizes.
- Generating reports larger than 500 MB might cause the error
java.lang.OutOfMemoryError: Java heap space, and PDF reports might not be generated. - HTML reports larger than 512 MB might not be rendered and displayed well on a browser, however, the HTML report still includes full information about test execution.
The recommended size for HTML reports is 500 MB. For large executions, you might want to reduce the amount of screenshots taken, avoid taking full-page screenshots, or enable the Attach reference images using linked screenshots (not embedded) to reduce report file size option.
Customize Log File Settings
Katalon Studio offers configurable system properties that let users manage how log files are generated, stored, and buffered. These settings are particularly useful for optimizing performance and storage during large-scale or long-running test executions by controlling log file size, retention limits, and buffering behavior.
By default, when the console0.txt file exceeds 10MB, Katalon Studio automatically splits the log into sequential files (e.g., console1.log, console2.log, etc.).
To customize this behavior, follow the steps below:
-
Open the
katalon.inifile in a text editor. -
Add the desired
-Dsystem properties below the-vmargsline.
For example:
-vmargs
-DmaxLogFileSize=5242880
-DmaxLogFile=100
-DlogRecordQueueSize=10000
-DbatchLogRecordSize=5000
Refer to the following table for system properties you can use to customize log behavior:
| Property | Description | Default Value | Example Configuration |
|---|---|---|---|
-DmaxLogFileSize | Sets the maximum size (in bytes) a log file can reach before a new one is created. | 10MB | -DmaxLogFileSize=5242880 (5MB) |
-DmaxLogFile | Defines the maximum number of log files to retain. Older logs are deleted beyond this limit. | 2000 | -DmaxLogFile=100 |
-DlogRecordQueueSize | Specifies the size of the queue that holds log records before they are processed. | 7000 | -DlogRecordQueueSize=10000 |
-DbatchLogRecordSize | Determines how many log records are processed in a single batch. | 3000 | -DbatchLogRecordSize=5000 |
See the following recommendations below for best practices:
-
The first two properties (
maxLogFileSize,maxLogFile) are the most commonly used. Adjust the queue and batch sizes only if needed for advanced troubleshooting. -
Only adjust
-DlogRecordQueueSizeand-DbatchLogRecordSizeif you are troubleshooting log buffer warnings.tipYou may encounter the following log warnings when adjusting
-DlogRecordQueueSizeand-DbatchLogRecordSize:The buffer of log file is full. The stdout line is dropped and won't be in the log file.
The buffer of log file is full. The stderr line is dropped and won't be in the log file.To resolve this, increase the following values to:
-DlogRecordQueueSize=10000
-DbatchLogRecordSize=5000 -
Restart Katalon Studio after applying any changes to
katalon.ini.
Log Viewer
Execute a test suite and observe the Log Viewer after the test execution completes. The generated reports are the same as the settings you have configured above:

You can view the generated reports in <project_folder>\Reports\<execution_folder> after the test execution finishes.
-
Test suite report folder:
-
Test suite collection report folder:
Get generated reports location at runtime
To retrieve current generated reports location, you can use the sample code below:
import com.kms.katalon.core.configuration.RunConfiguration{"\n"}RunConfiguration.getReportFolder(){"\n"}
You can also retrieve other information through the RunConfiguration package, see: Katalon Javadocs: RunConfiguration
Video capturing
- K-Lite Codec is recommended to play the Katalon Studio test execution videos. You can download K-Lite Codec on the Codec Guide website: K-Lite Codec.
- Support execution at the test suite level.
- Support all browsers except for Remote, Headless, Kobiton, and Custom. For remote or headless browsers, it's recommended to use Katalium Server to view captured sessions.
- Recording parallel execution is NOT supported yet.
- Recording parallel execution is NOT supported yet.
- On Linux, videos recorded in Katalon Studio require VLC for playback, except for WebM files, which can be opened in most browsers.
Debugging can be time-consuming and challenging for many automation testers. Katalon Studio helps solve this problem by supporting you with the ability to capture test execution via video format. You can enable the video capturing feature in Project Settings.
To learn how to work with Katalon Studio’s video capturing feature, see:
- Generate browser-based videos in Katalon Studio reports
- Generate screen-based videos in Katalon Studio reports
After executing a test suite, go to the Result tab. The test cases table displays each test case along with its attached video.
To play the video, click the play icon in the Video column. Test step descriptions are embedded as subtitles:

By watching how the automated test was executed, the testing team can identify exactly where the test failed. Thus, time and resources are managed more efficiently and effectively.
Learn about test suite reports, exporting, and more in our Katalon Academy course: Katalon Studio: How To Work With Execution Logs and Test Reports.