Live Monitor
This document explains the purpose and components of the Live Monitor in Katalon TestOps.
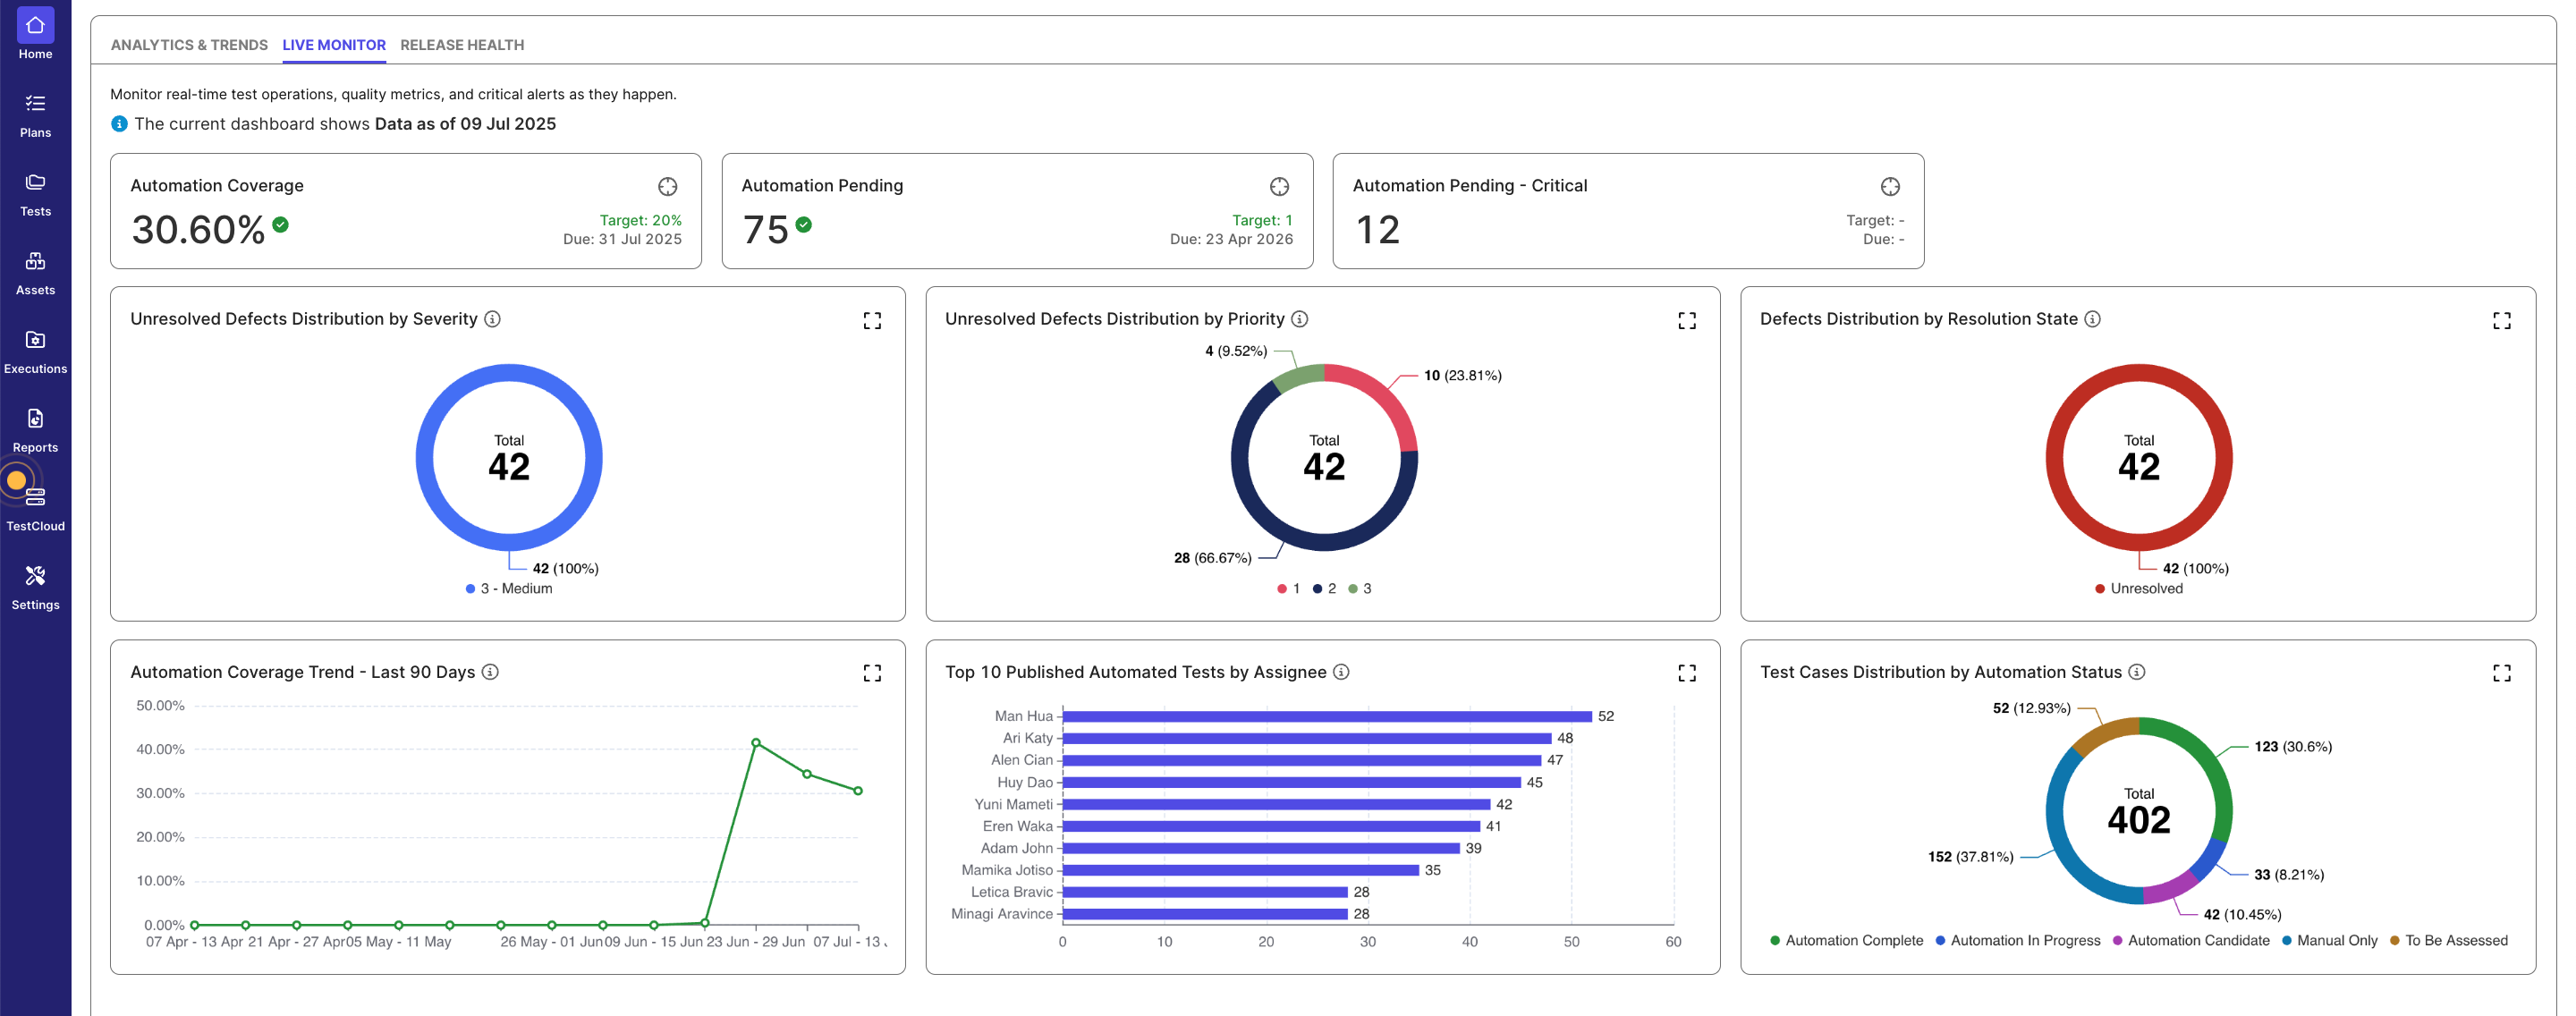
The Live Monitor tab in Katalon TestOps offers a centralized, real-time dashboard for monitoring test automation metrics, defect statuses, and test coverage. It enables teams to track ongoing testing activities and quality signals as they happen. This can be used to drive key activities such as:
- Daily Standups: Leverage live data to align on automation progress and critical issues.
- Release Planning: Assess automation coverage and defect status to make informed release decisions.
- Quality Audits: Get a snapshot of testing health to guide continuous improvement efforts.
Live Monitor Components
The dashboard includes the following key widgets:
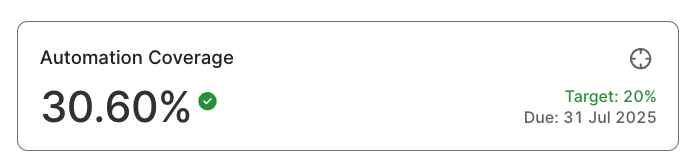
Automation Coverage
To set the target and due date, you need to be a Test Lead role.
Displays the percentage of test cases marked as "Automation Complete" out of all test cases in the project. This metric helps teams assess automation maturity and identify areas where additional automation is needed to improve coverage.
Automation Pending
To set the target and due date, you need to be a Test Lead role.
Displays the total number of test cases marked as either "Automation Candidate" or "Automation in Progress". This metric helps teams monitor the pipeline of test cases awaiting or undergoing automation, supporting effective sprint planning and resource allocation.
- Automation Pending – Critical: Shows the subset of these test cases that are marked with a "Critical" status. This helps teams prioritize automation efforts based on risk and test case importance.

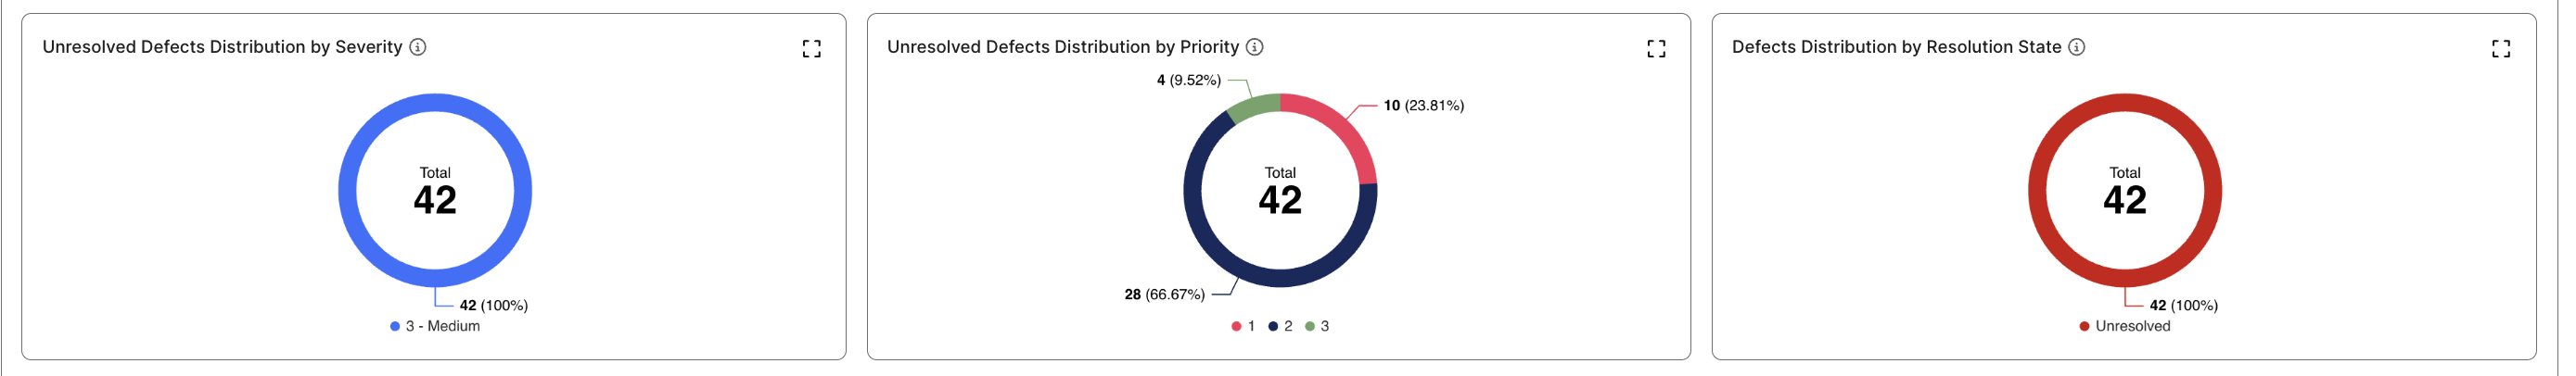
Unresolved Defects
-
Unresolved Defects Distribution by Severity: Displays unresolved defects grouped by severity level (e.g., Critical, Major, Minor). This allows teams to quickly assess the potential impact of outstanding issues on application quality.
-
Unresolved Defects Distribution by Priority: Displays open defects grouped by priority level, based on your ALM’s mapped Priority field. This helps teams focus defect resolution efforts on the most impactful issues first.
-
Unresolved Defects Distribution by Resolution Status: Visualizes unresolved defects by their Resolution status (e.g., Open, Unresolved). This offers insight into defect lifecycle and resolution velocity.
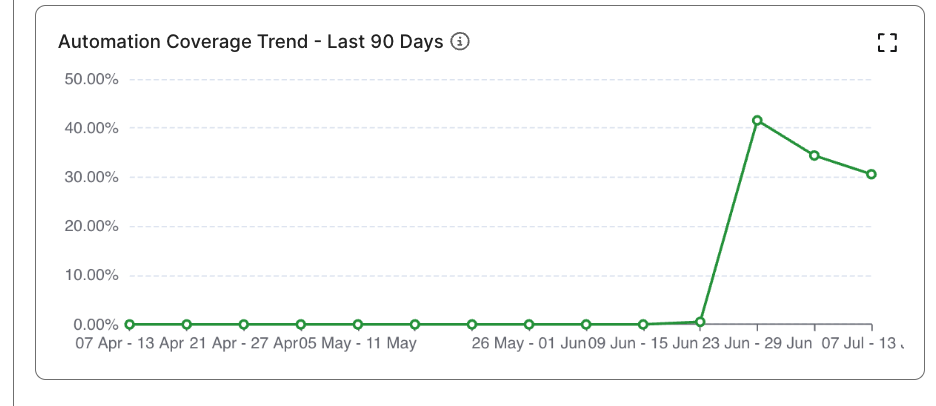
Automation Coverage Trend (Last 90 Days)
Visualizes changes in Automation Coverage over the past 90 days. Use this trend to evaluate the velocity and consistency of your automation efforts over time, and to identify periods of progress or stagnation.
Displays unresolved defects grouped by their workflow status (e.g., Open, In Progress, Reopened). Provides insight into the defect lifecycle and helps assess the pace of issue resolution.
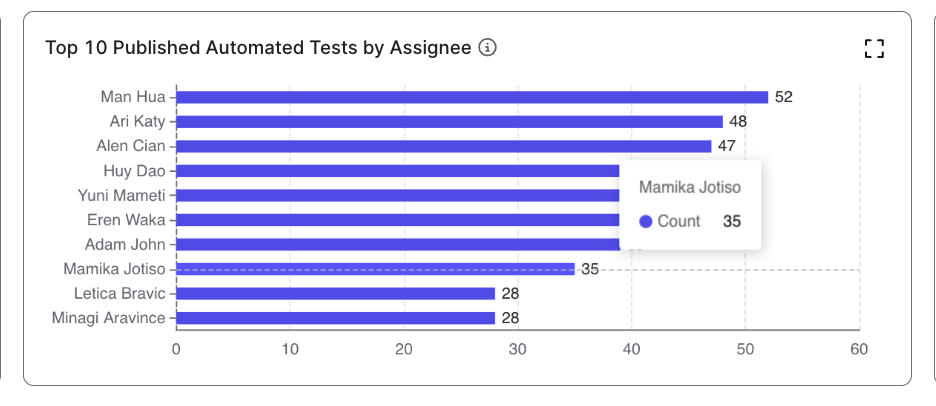
Contributor Activity
Highlights the top 10 contributors to automated test development. This encourages recognition and promotes team collaboration.
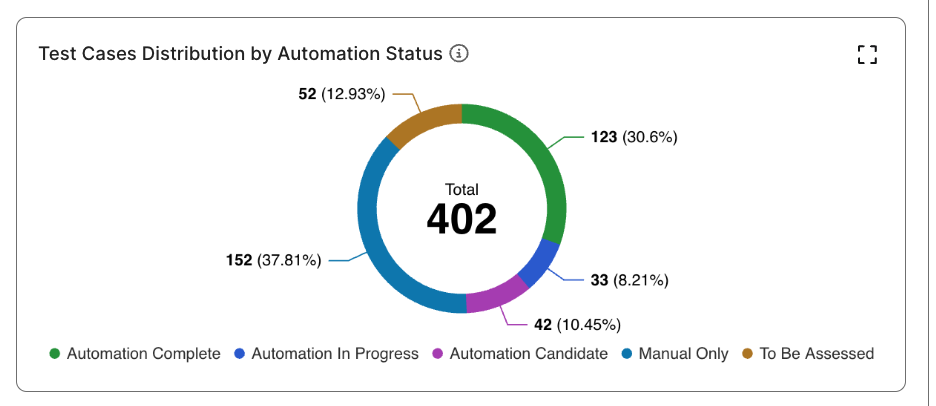
Test Case Distribution by Automation Status
Breaks down test cases by their automation status (e.g., Completed, In Progress, Pending). This is useful for workload assessment and test planning.