Analytics & Trends Dashboard
This explains what the Analytics & Trends dashboard is, how to navigate it, and what its components are.
Overview
The Analytics & Trends Dashboard gives you a consolidated view of your testing activities across your project. This visual interface aggregates key metrics and trends in one screen, enabling you to quickly assess overall project health, track completion rates, and identify testing bottlenecks.
Navigate the Analytics & Trends Dashboard
Use the following steps to navigate and explore the Analytics & Trends Dashboard effectively.
-
Access the Dashboard
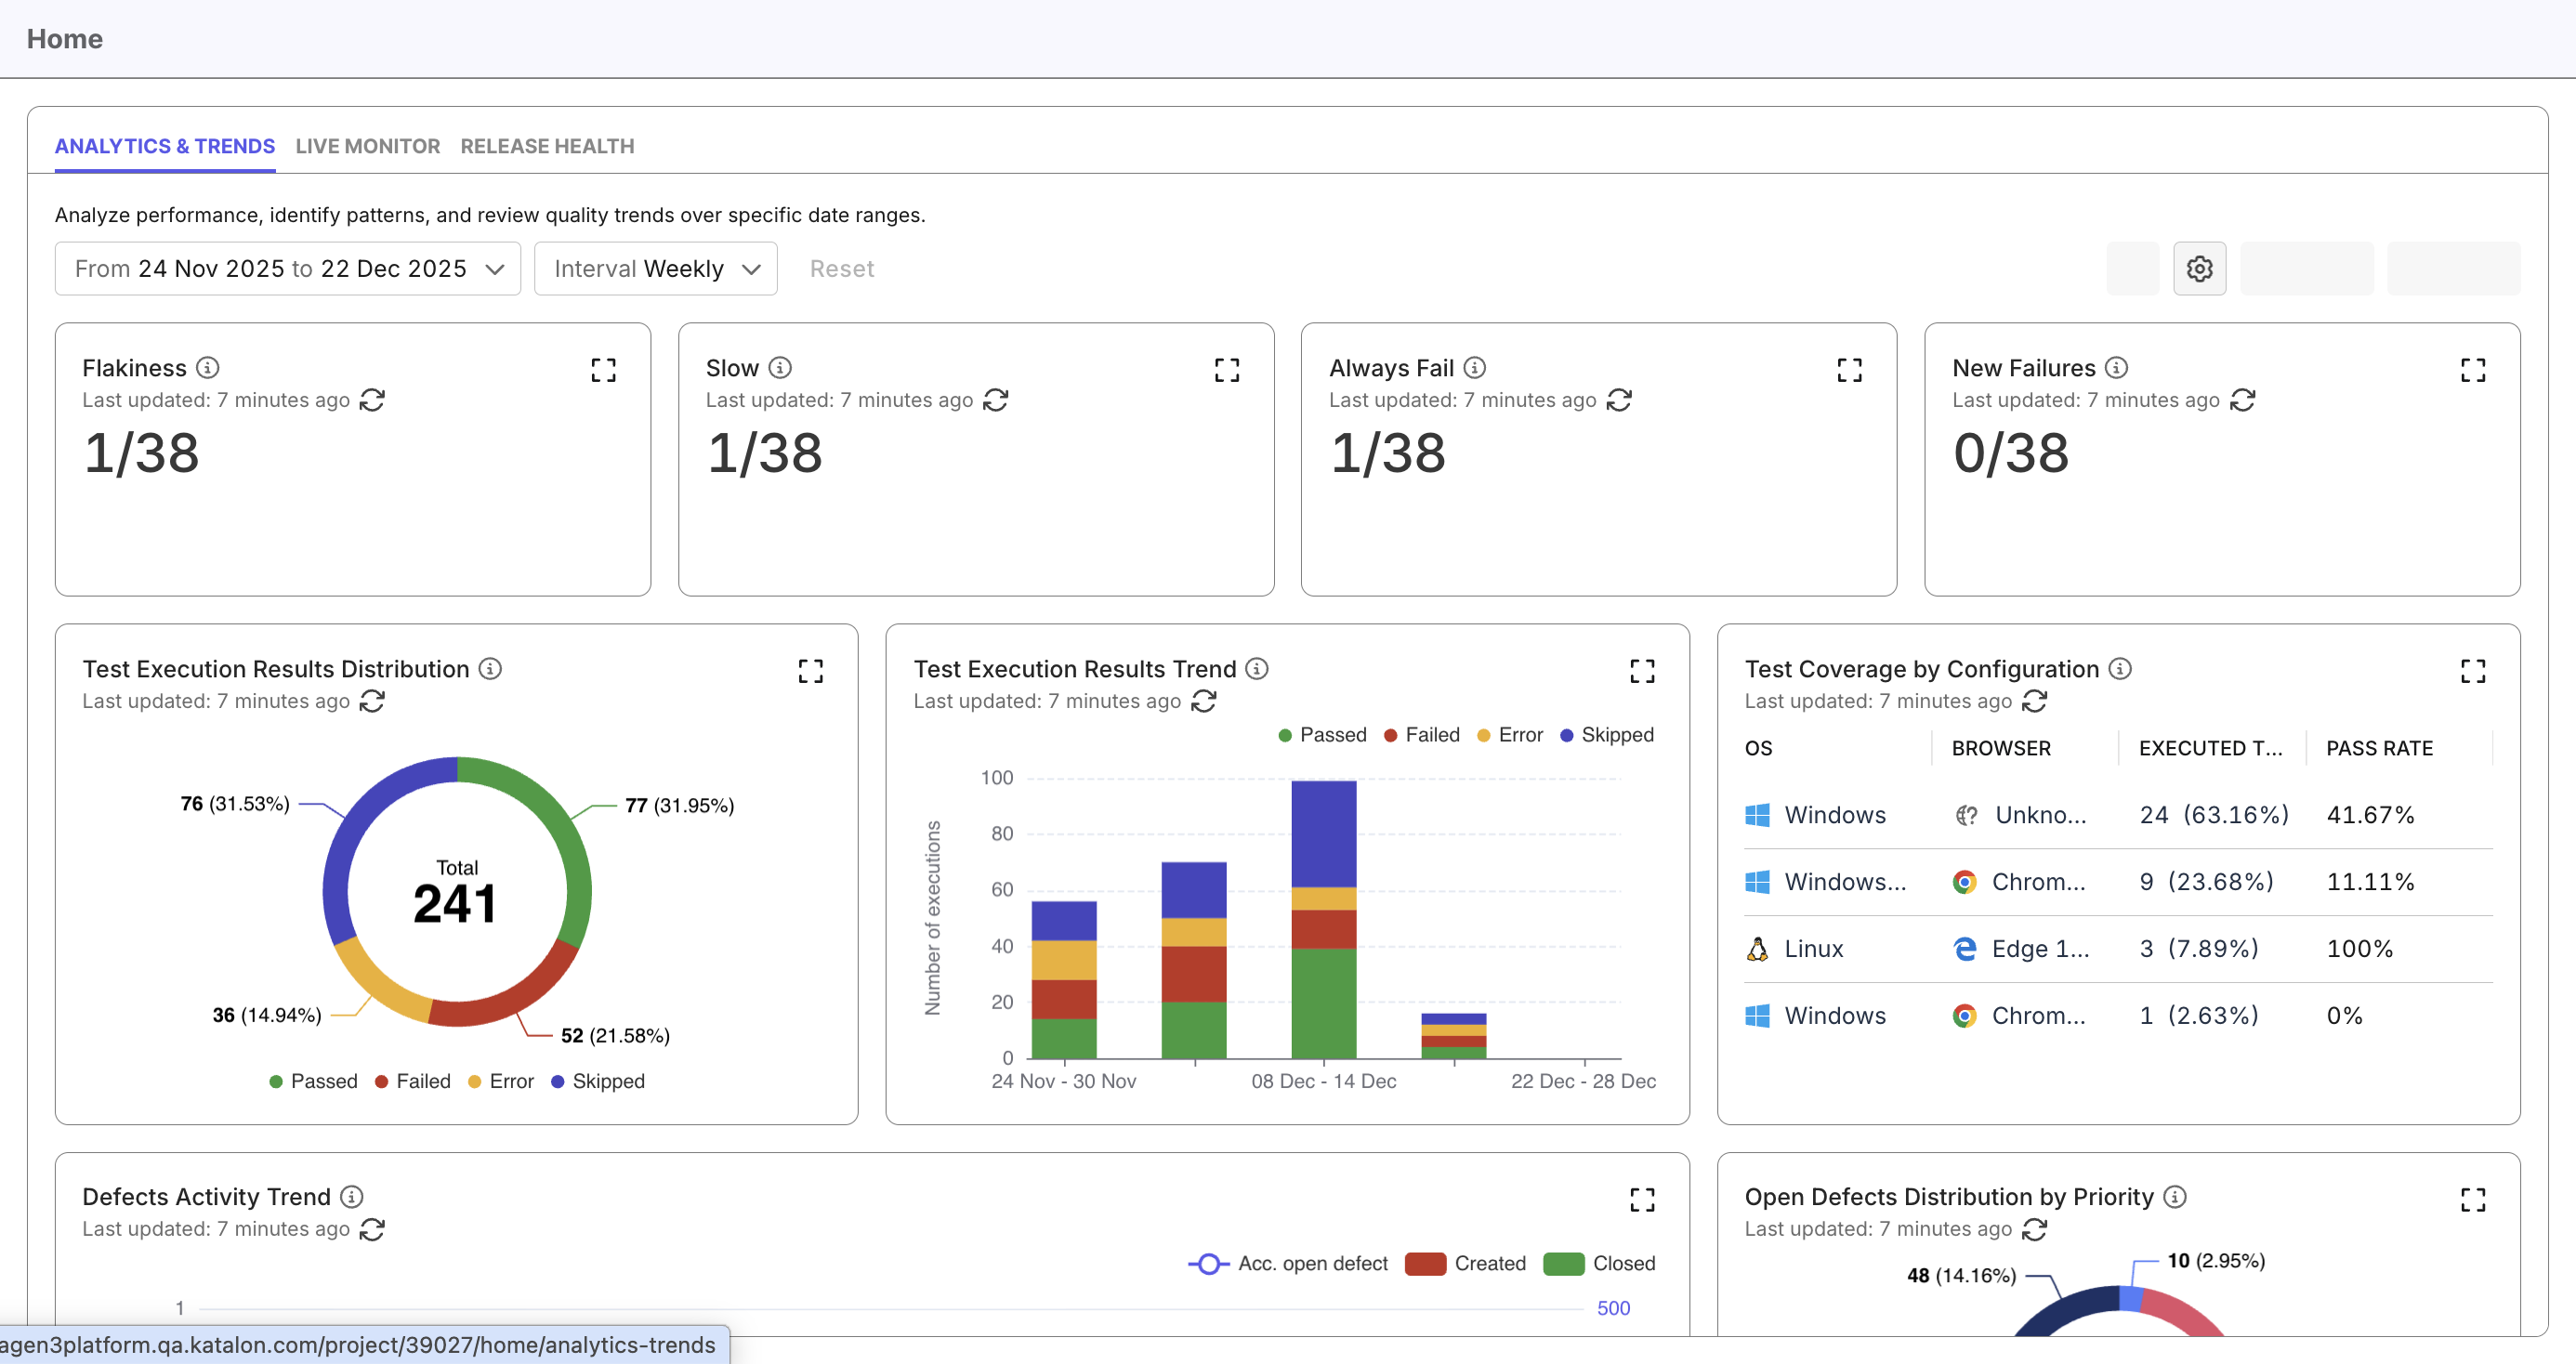
From the left sidebar, go to Home → Analytics & Trends.
-
Set your analysis scope
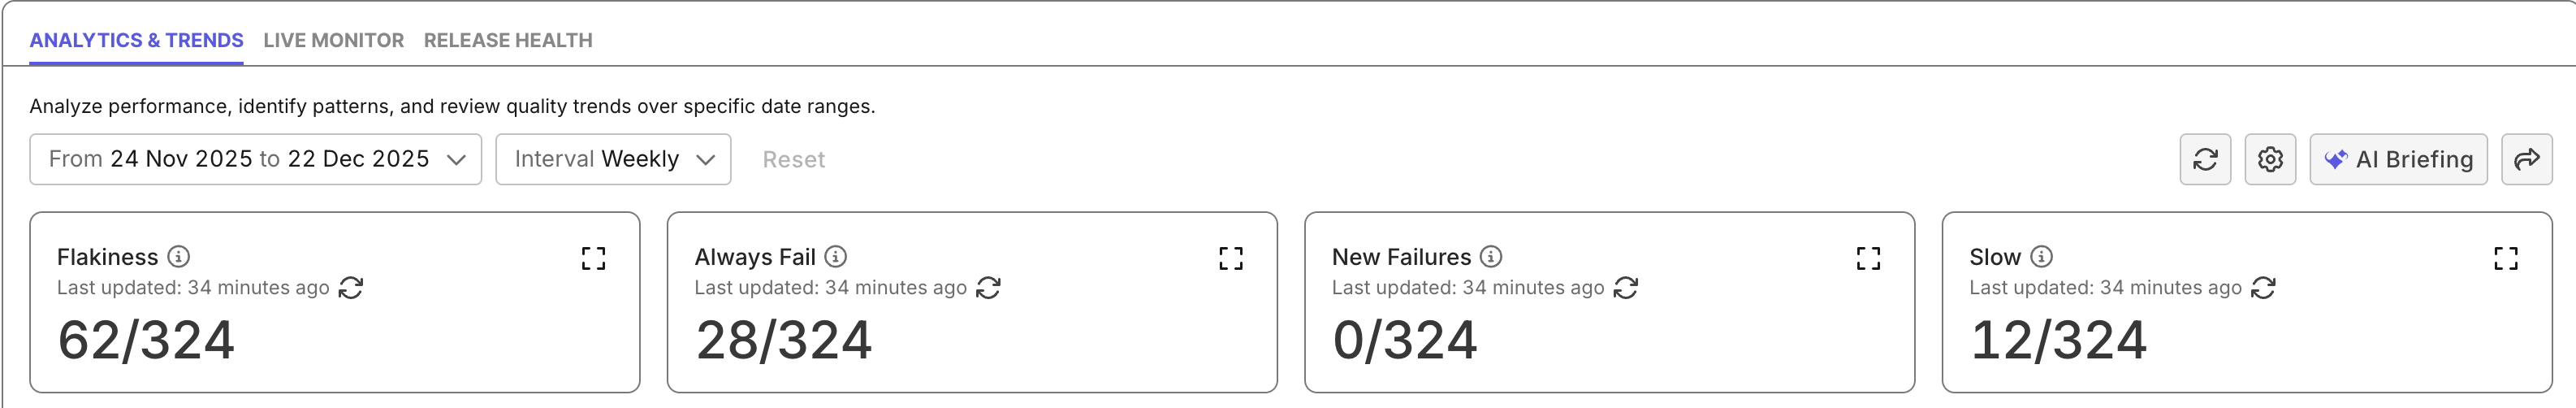
The dashboard defaults to the past 4 weeks with data aggregated at weekly intervals.
You can adjust the time range as needed to focus on a specific period or trend pattern. -
Review key quality metrics
The dashboard displays essential quality and performance indicators compiled from multiple reports and aligned with your selected scope.
See more details in the Default widgets section below.
-
Interact with the widgets
- Hover over any chart segment to view detailed values.
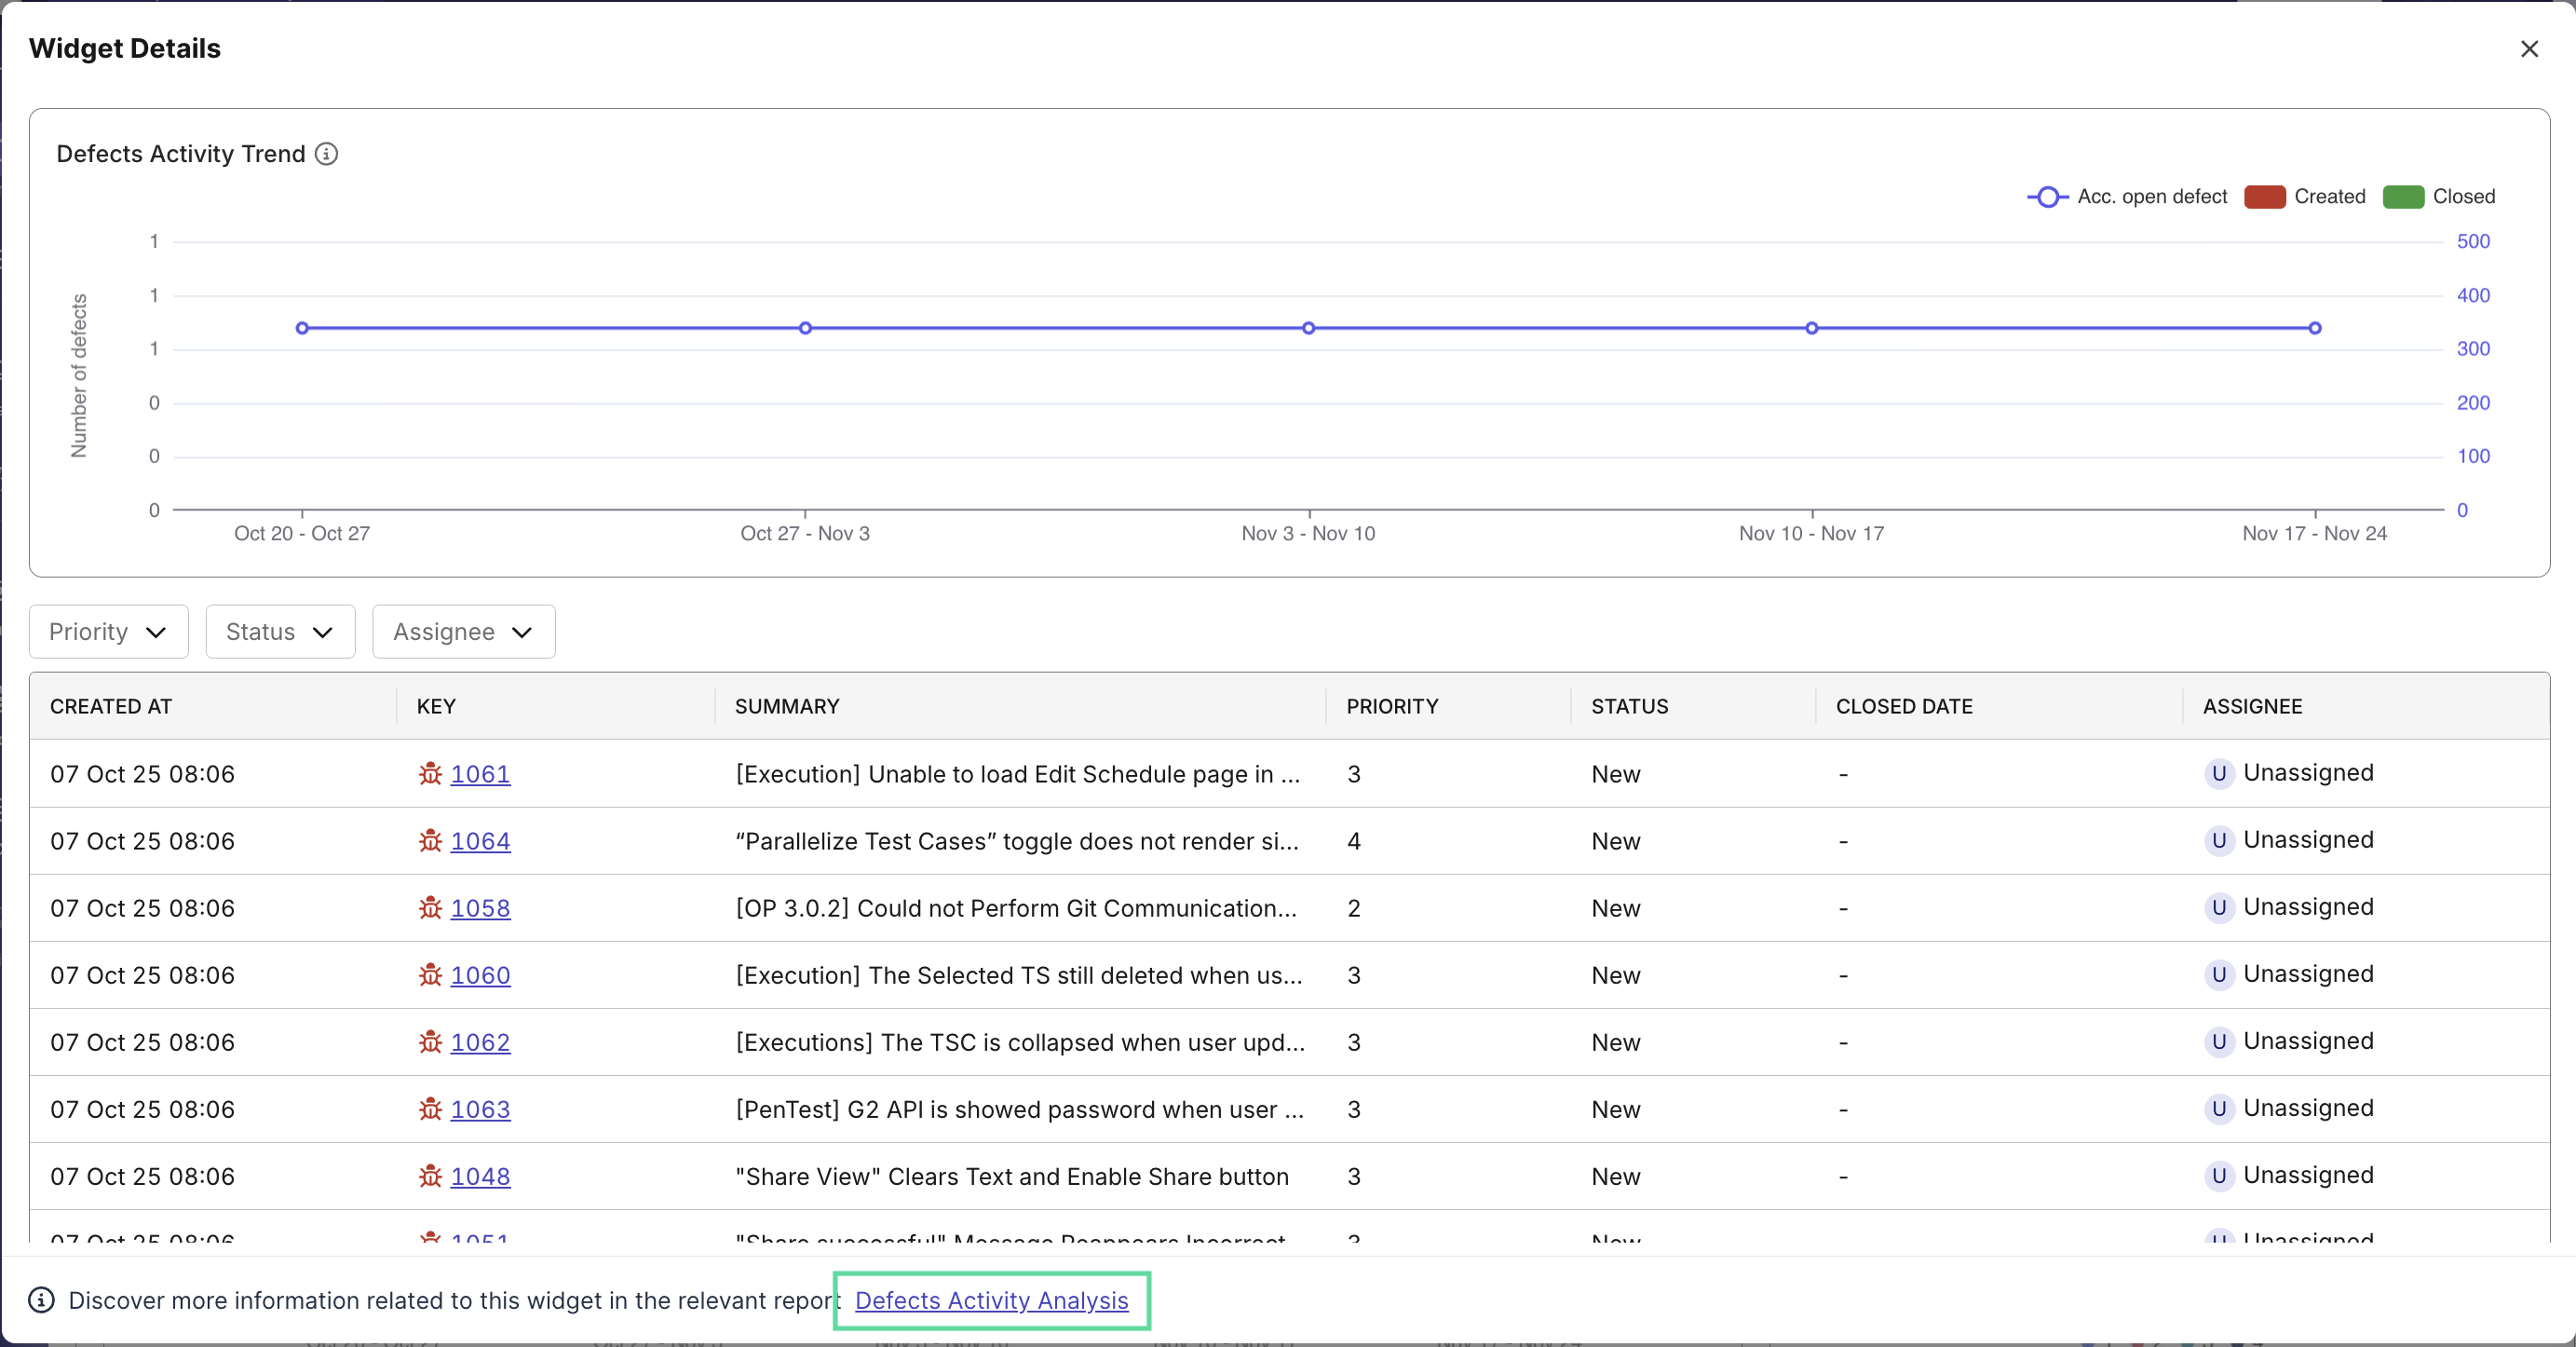
- Expand each widget with the icon ([ ]) to access detailed information for any chart. You'll be able to view more comprehensive metrics and additional data.
- Use the refresh icon to update all widgets or individual ones with the latest data.
- You could also navigate to each widget's full report by clicking on the link at the bottom of each Widget Details popup panel.
-
Customize your view
Personalize the dashboard by adding, rearranging, or removing widgets to match your analysis needs. See some Example dashboards below for customization ideas.
-
Share with your team
Once your dashboard reflects the insights you need, share the customized view with your teammates or stakeholders to align on project quality status.
Analytics & Trends Components
Default Widgets
By default, this dashboard displays the following widgets (expand widgets to deep-dive into relevant reports):
Test Health Big Number Widgets: View counts of flaky, always failing, new failing, and slow tests to quickly assess the volume of problematic tests.
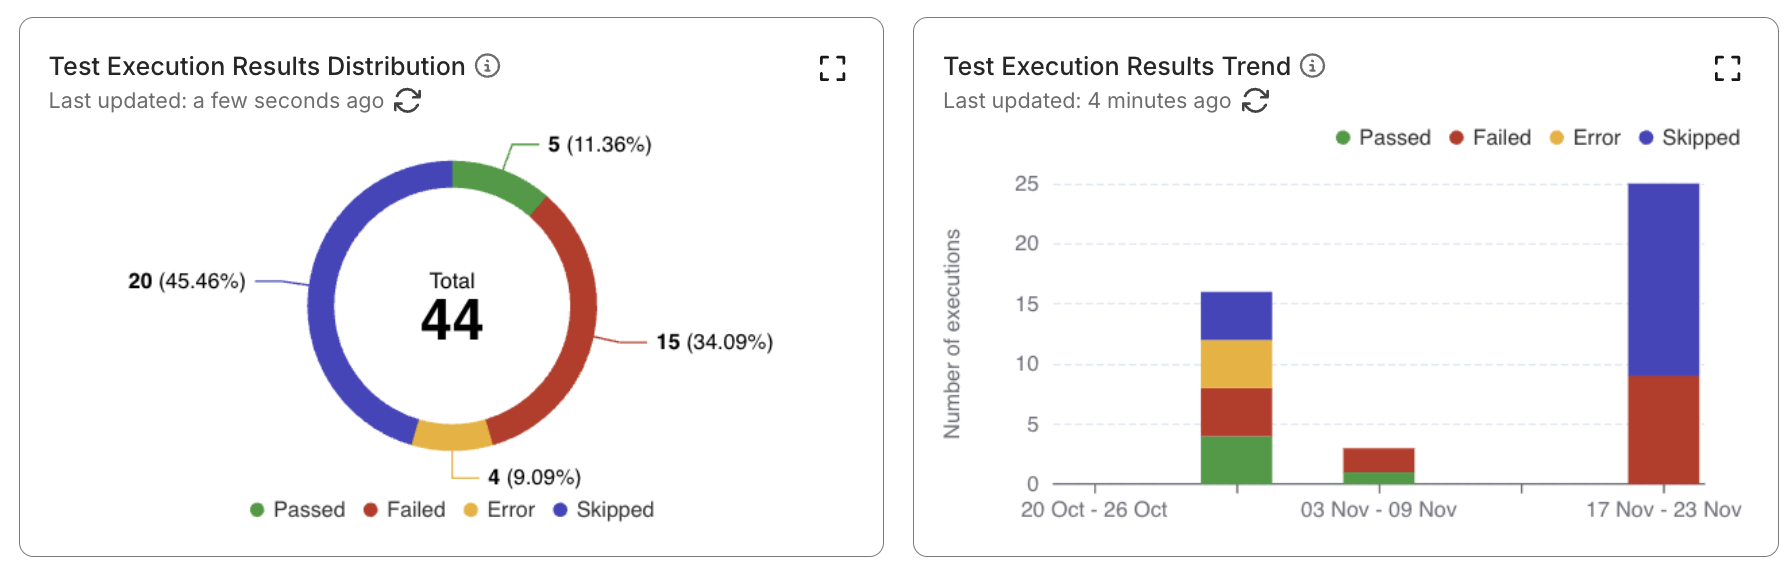
Test Execution Results Distribution: View the distribution of test results across all statuses (Passed, Failed, etc.), including the total execution count and percentages in a pie chart.
Test Execution Results Trend: Track daily test execution results with a breakdown of passed, failed, error, incomplete, blocked, and skipped tests in a stacked bar chart.
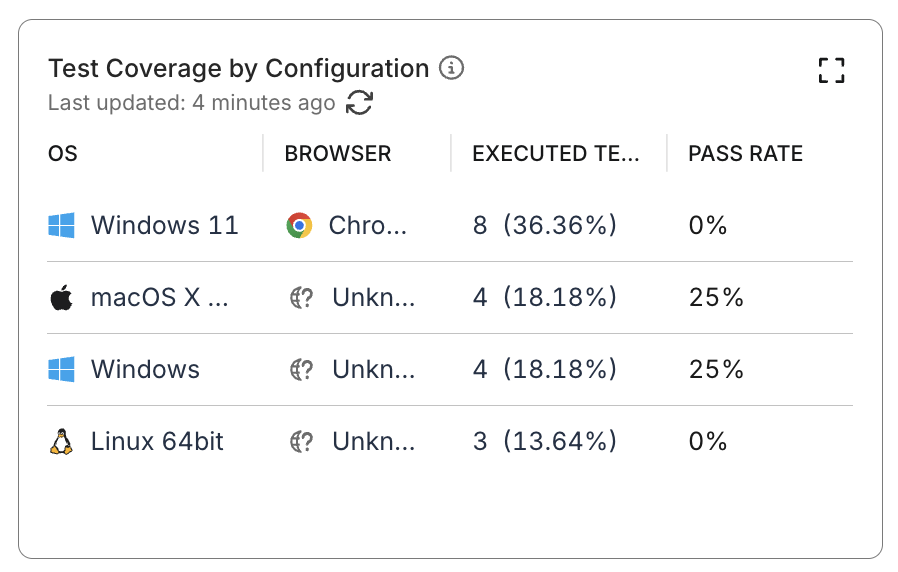
Test Coverage by Configuration: View test execution coverage across operating systems and browsers, showing the execution count for each.
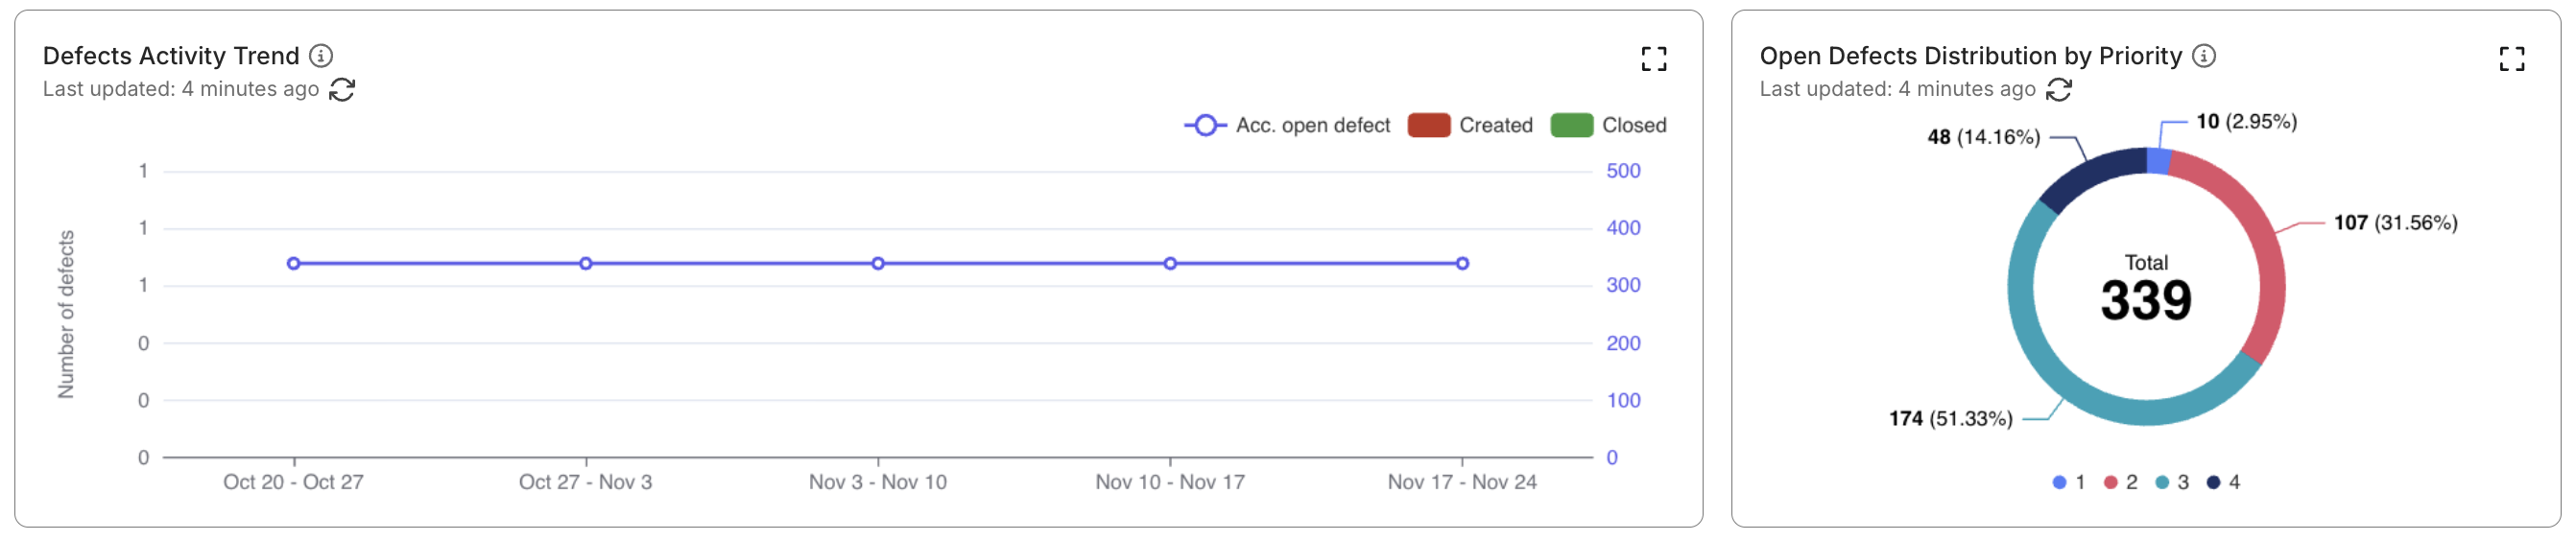
Defects Activity Trend: Track the daily number of defects created (bar), closed (bar), and the accumulated number of open defects (line) over time in a combined line and bar chart.
Open Defects Distribution by Priority: View the total count of open defects, categorized by priority levels (e.g. High, Medium, Low) in a pie chart.
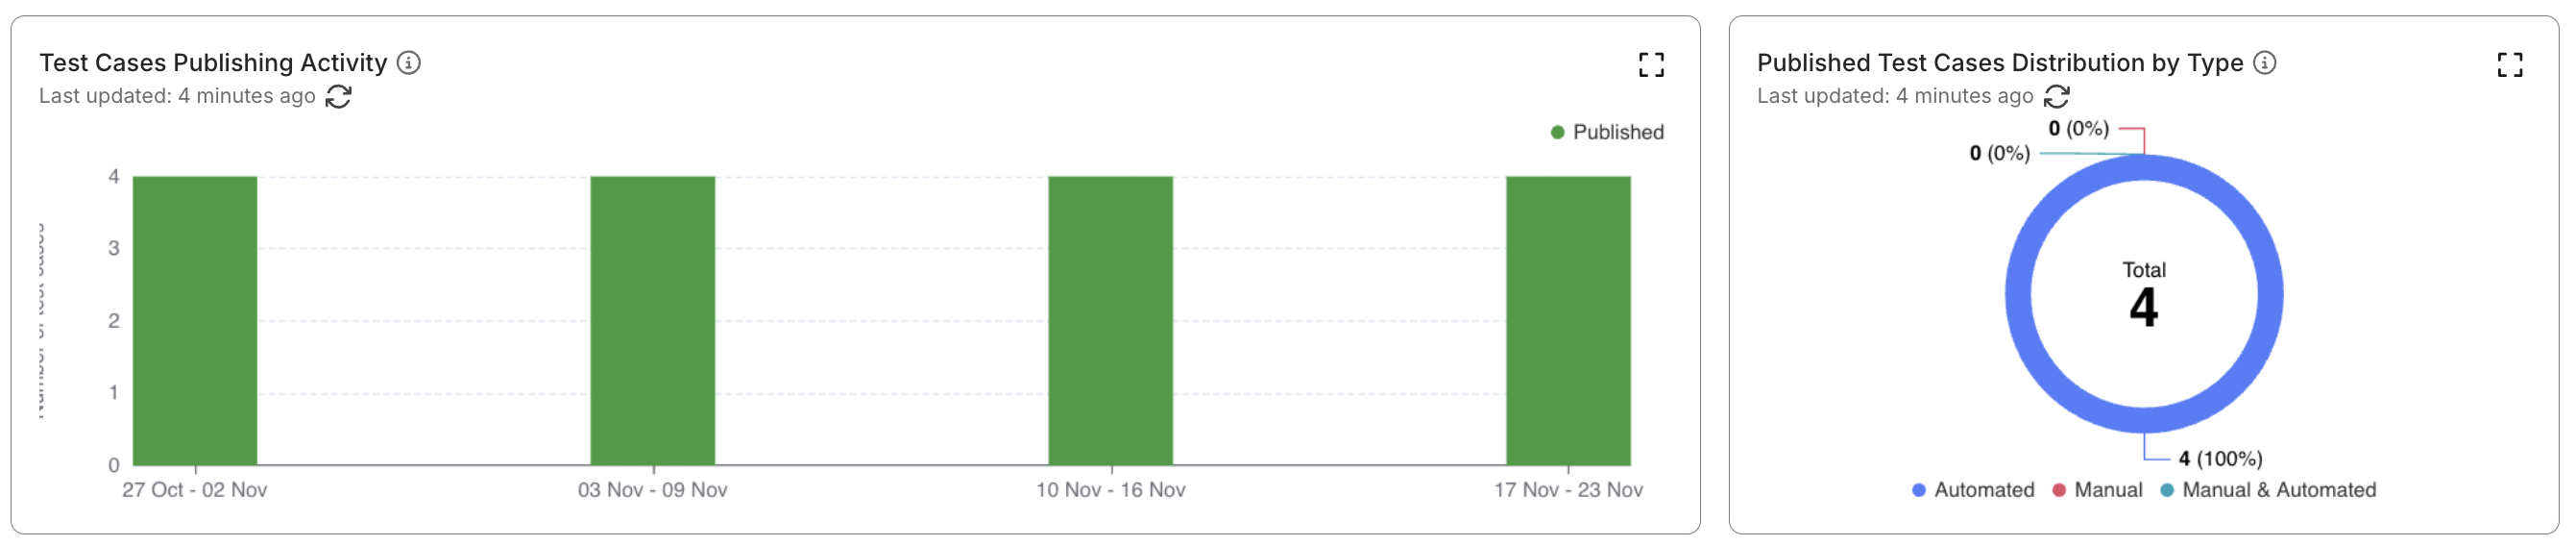
Test Cases Publishing Activity: Track the daily publishing activity of test cases. Shows the number of test cases in each publishing status (e.g., Draft, Review, Published) for all test cases created or edited within the selected time range in a stacked bar chart.
Published Test Cases Distribution by Type: View the distribution of published test cases, categorized by type (Manual only, Automated only, Manual & Automated) in a pie chart.
Customize Analytics & Trends Dashboard
You can edit the Analytics and Trends dashboards just like how you would edit a custom dashboard. Learn more at Custom Dashboard
Example dashboards
This section lists example dashboards that you can customize to fit your needs.
Scenario 1 - Sprint Quality Overview
Replace current widgets with:
- For Test Execution Analysis purpose: Test Execution Results Distribution, Test Execution Results Trend, Test Execution Pass Rate by Test Type
- For Quality Assessment purpose: Open Defects Distribution by Priority, Defects Activity Trend, and Error Distribution by Failure Category (Optional).
- For Test Activity Analysis purpose: Test Cases Summary by Publishing Status and Test Cases Publishing Activity.
The sprint story flows top-to-bottom:
- Execution results & trends
- Defects level and movement
- Test authoring & publishing progress
Scenario 2 - Release Readiness / Stabilization
Replace current widgets with:
- For Test Execution Analysis purpose: Test Execution Results Trend, Test Failures Summary, and Test Runs Distribution by Status
- For Quality Assessment purpose: Defects Activity Trend, Open Defects Distribution by Priority, and Defects Distribution by Severity
- For Coverage Analysis purpose (optional but recommended): Test Coverage by Configuration
Release readiness flows top-to-bottom:
- Execution pass rate & failure trends
- Open defects risk by priority and severity
- Platform coverage to confirm key configurations are tested
Scenario 3 - Coverage & Platform Gaps
Replace current widgets with:
-
For Coverage Analysis purpose: Test Coverage by Configuration, Test Executions Summary by Configuration, and Test Coverage Distribution Top 10 by Configuration (if available)
-
For Test Execution Analysis purpose: Test Execution Results Distribution
Arrange them so coverage analysis flows top-to-bottom:
- Overall configuration coverage
- Execution volume per configuration
- Top under- or over-tested configurations
- Result distribution to relate coverage with pass/fail rates
Scenario 4 - Test Authoring & Automation Progress
Replace current widgets with:
-
For Test Activity Analysis purpose: Test Cases Summary by Publishing Status, Test Cases Publishing Activity, Published Test Cases Distribution by Type (Automated vs Manual)
-
For Test Execution Analysis purpose (optional): Test Runs Summary by Type (Manual / Automated)
Arrange them so the authoring story flows top-to-bottom:
- Overall test case status (Draft, In Review, Published)
- Publishing activity trend over time
- Split between Automated and Manual tests
- (Optional) Execution volume by test type to confirm automation is being run