Test Case Health Analysis Report
This document lists features of the Test Case Health Analysis report.
The Test Case Health Analysis Report provides a high-level overview of test execution health and stability in Katalon True Platform. It helps QA teams monitor pass/fail trends, identify unstable test cases, and prioritize investigation into failed or unstable runs.
Tutorials:
Report Features
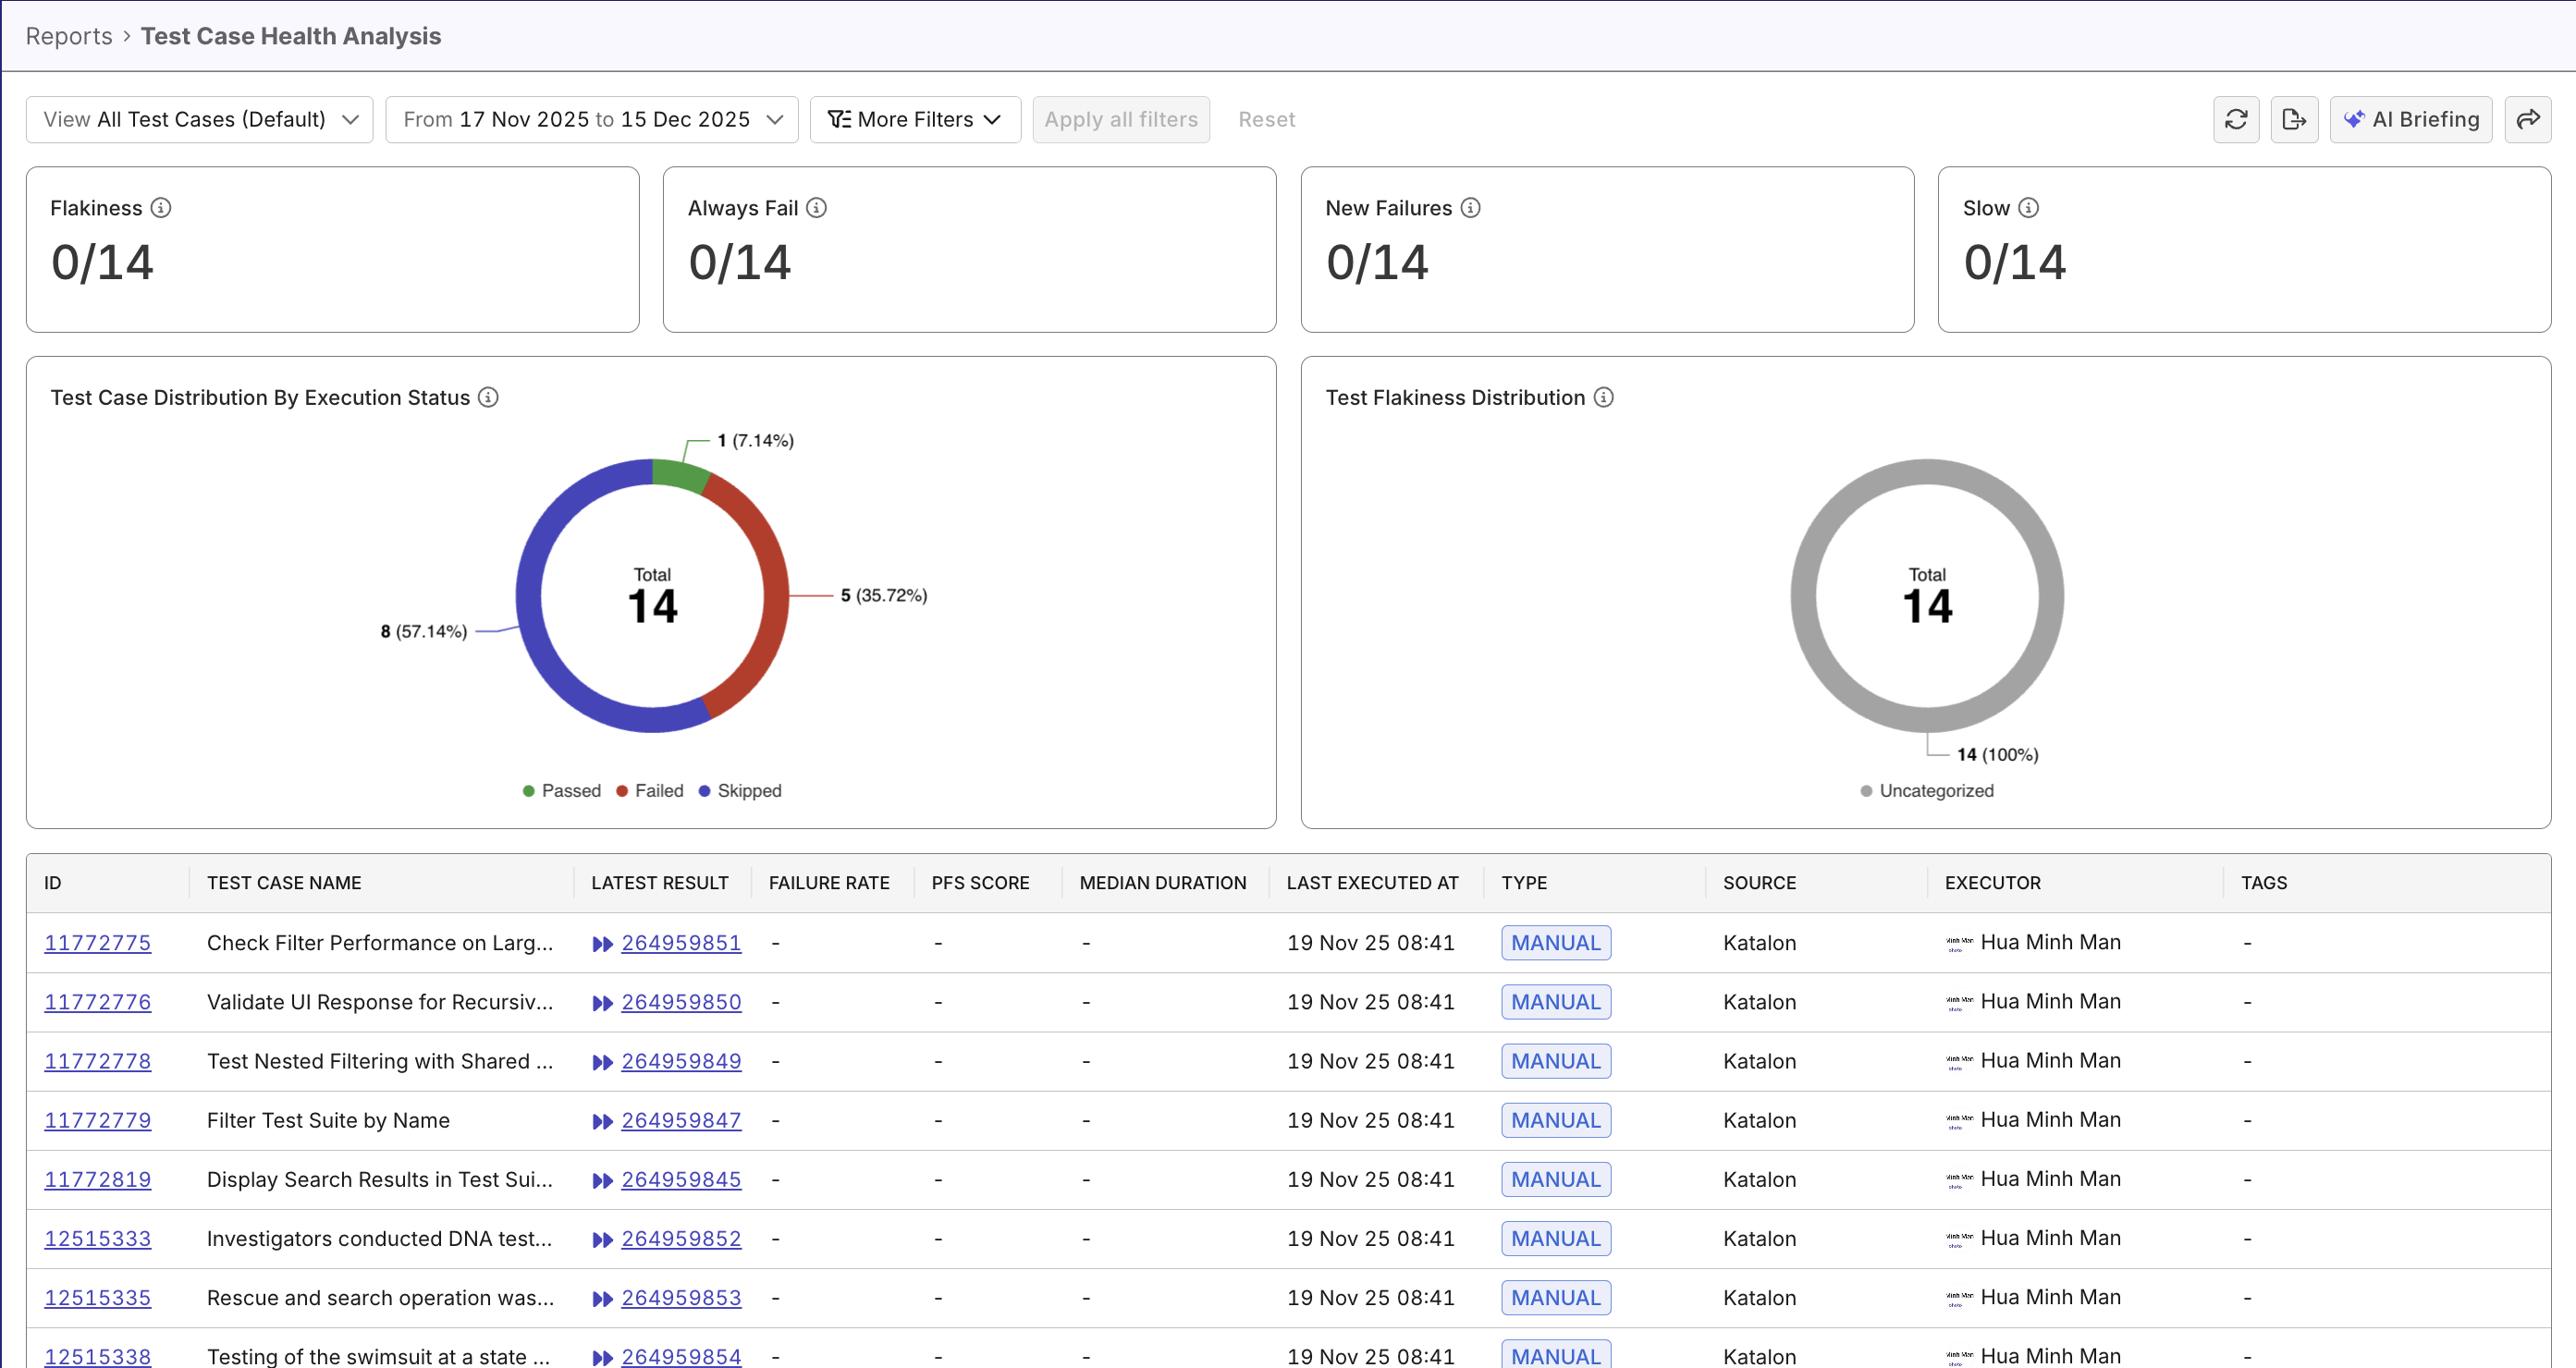
The Test Case Status Analysis Report consolidates multiple dimensions of test result data into an interactive view with these key components:
- Stability Counts - four big numbers that count test cases with stability tags: flaky/new failure/always fail/slow.
- Test Case Breakdown by Execution Status – a pie chart summarizing pass/fail/error/skip ratios
- Test Case Breakdown by Flakiness Status - a pie chart summarizing stable/flaky test case ratios.
- Test Case Detail Table �– a detailed view of individual test cases, with filters for deeper analysis
Test Health Big Number Widgets
Katalon True Platform detects and counts test cases with smart tags in the selected scope. See Smart Tags to learn more about Katalon True Platform Smart Tags.

These numbers help you quickly identify high-impact risks without analyzing individual charts.
Test Case Distribution by Execution Status widget
A pie chart showing the proportion of test cases by their latest execution result (Passed, Failed, Error, Skipped).
Provides a quick visual summary of overall testing health. Highlights where most issues occur.

Test Flakiness Distribution widget
Visualizes how test cases are distributed across flakiness categories:
- Stable
- Potentially Flaky
- Highly Flaky
- Uncategorized – Test cases without sufficient data
See Probabilistic Flakiness Score to understand how Katalon True Platform calculates PFS to measure flakiness.
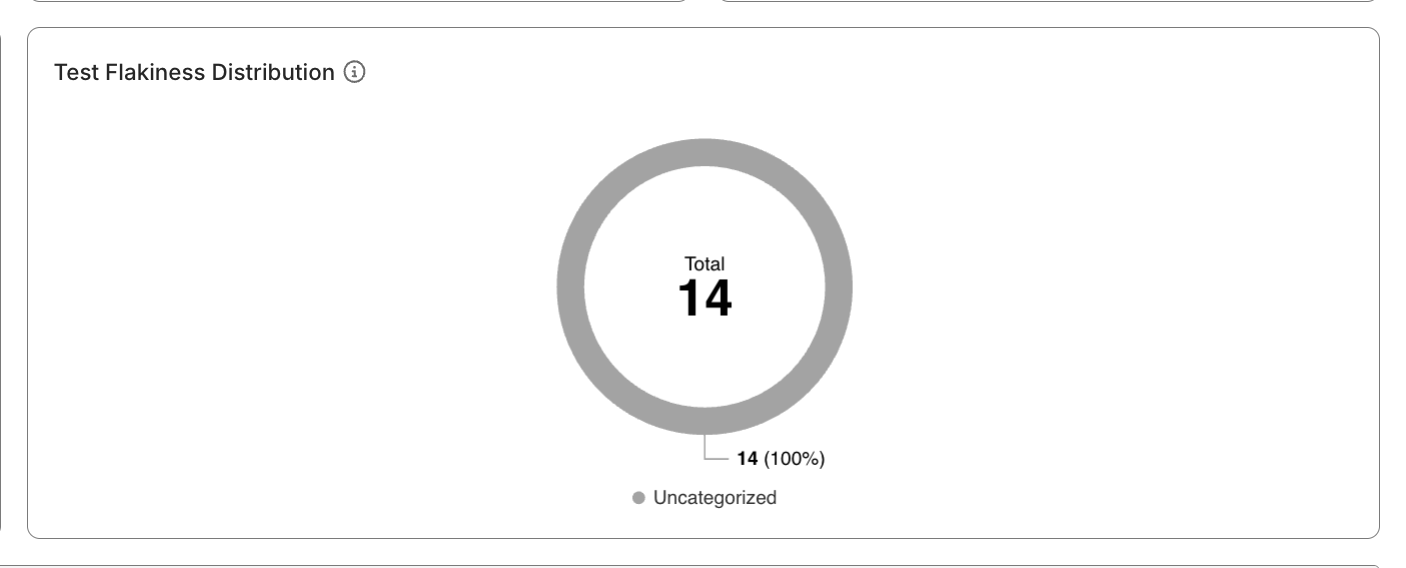
Provides a clearer, more actionable view of test reliability - you can click on the flaky segment, and see affected test cases in the table below.
Test Case Detail Table
A sortable, filterable data table listing key test case attributes:
- Test Case ID and Name
- Latest Result
- Type (Automated / Manual)
- Failure Rate – Percentage of failed executions within the selected scope
- PFS Score – Pass/Fail Stability score indicating execution consistency
- Median Duration – Median execution time calculated using P50
- Executor
- Tags
- Last Executed At
- Source – Origin of the test case (for example, repository or integration)
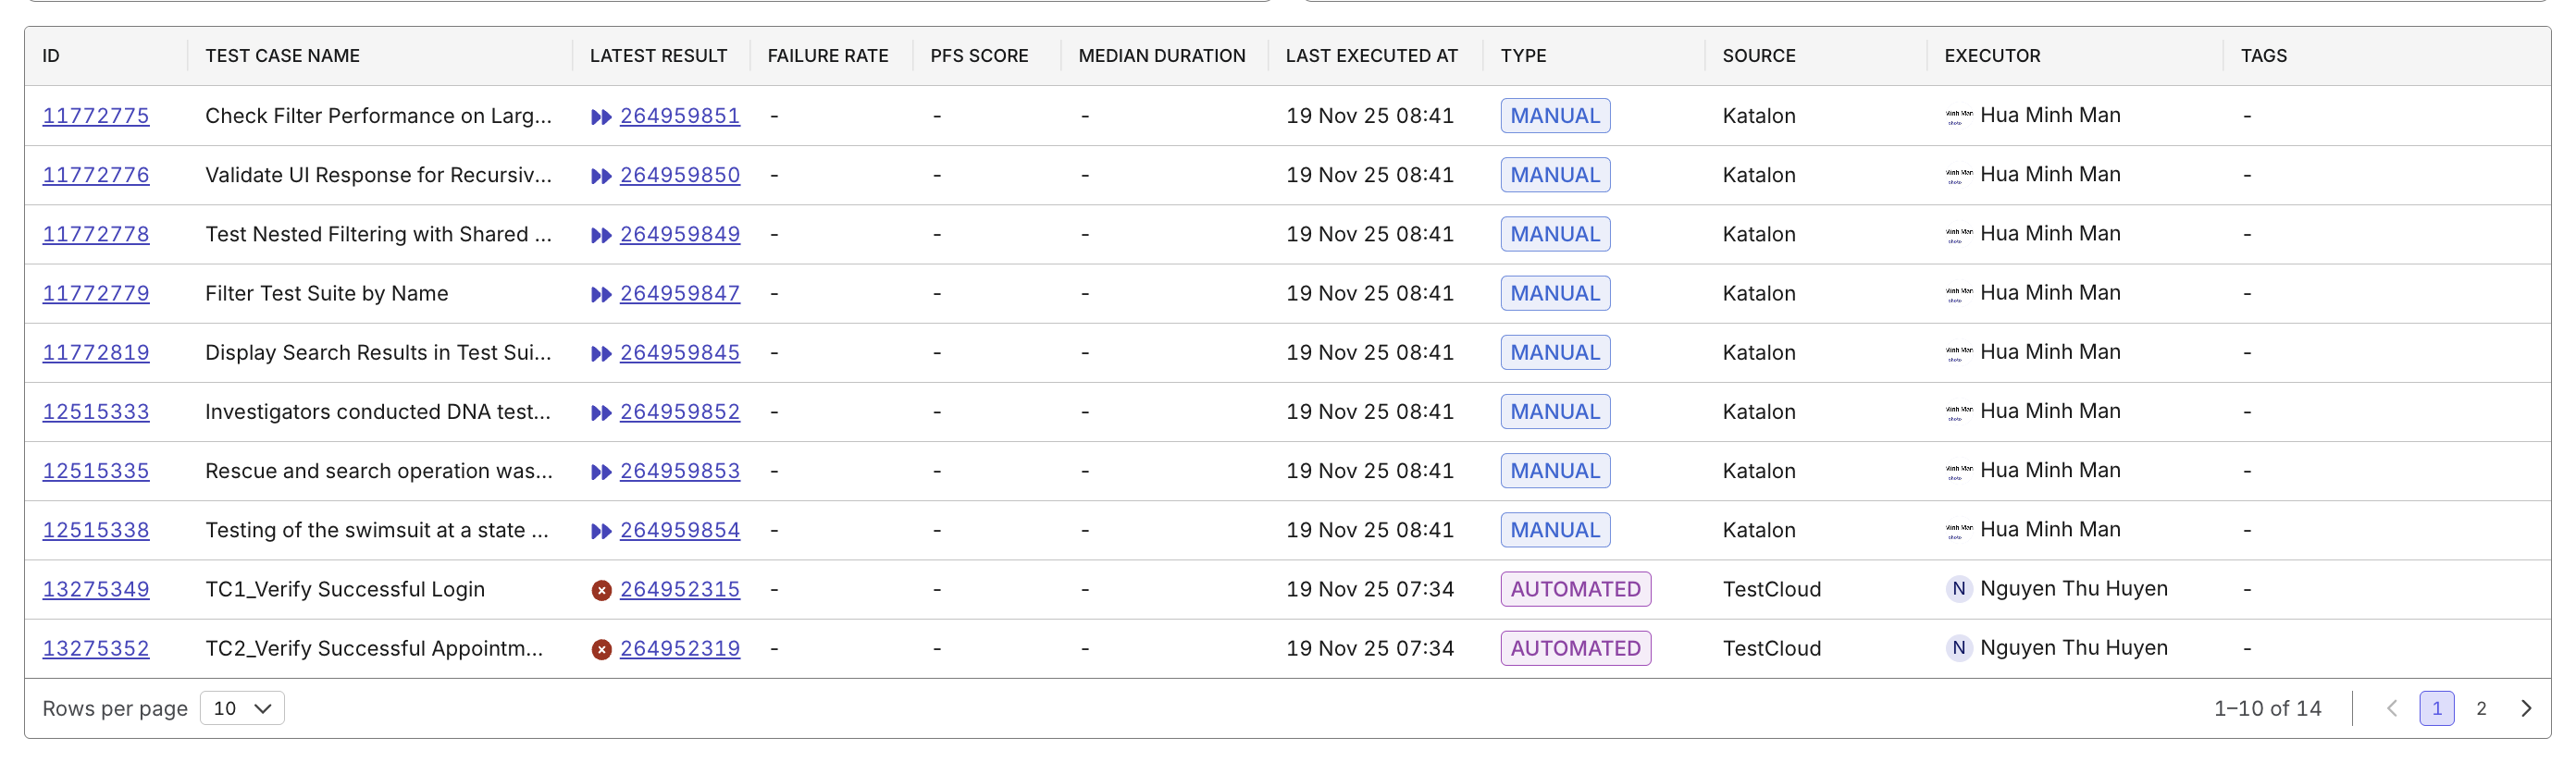
You can click a Test Case ID or Latest Result to navigate directly to the test case itself, or detailed breakdown of the test run result, for further investigation.