TestOps Analytics Overview
This document explains TestOps Analytics, what features this module has, and how you can best use it to assess your project's health.
Introduction
TestOps Analytics module is the central hub for tracking, analyzing, and communicating testing performance and software quality across projects. It unifies dashboards, reports, and insights that turn raw execution data into actionable intelligence for QA managers, testers, and stakeholders.
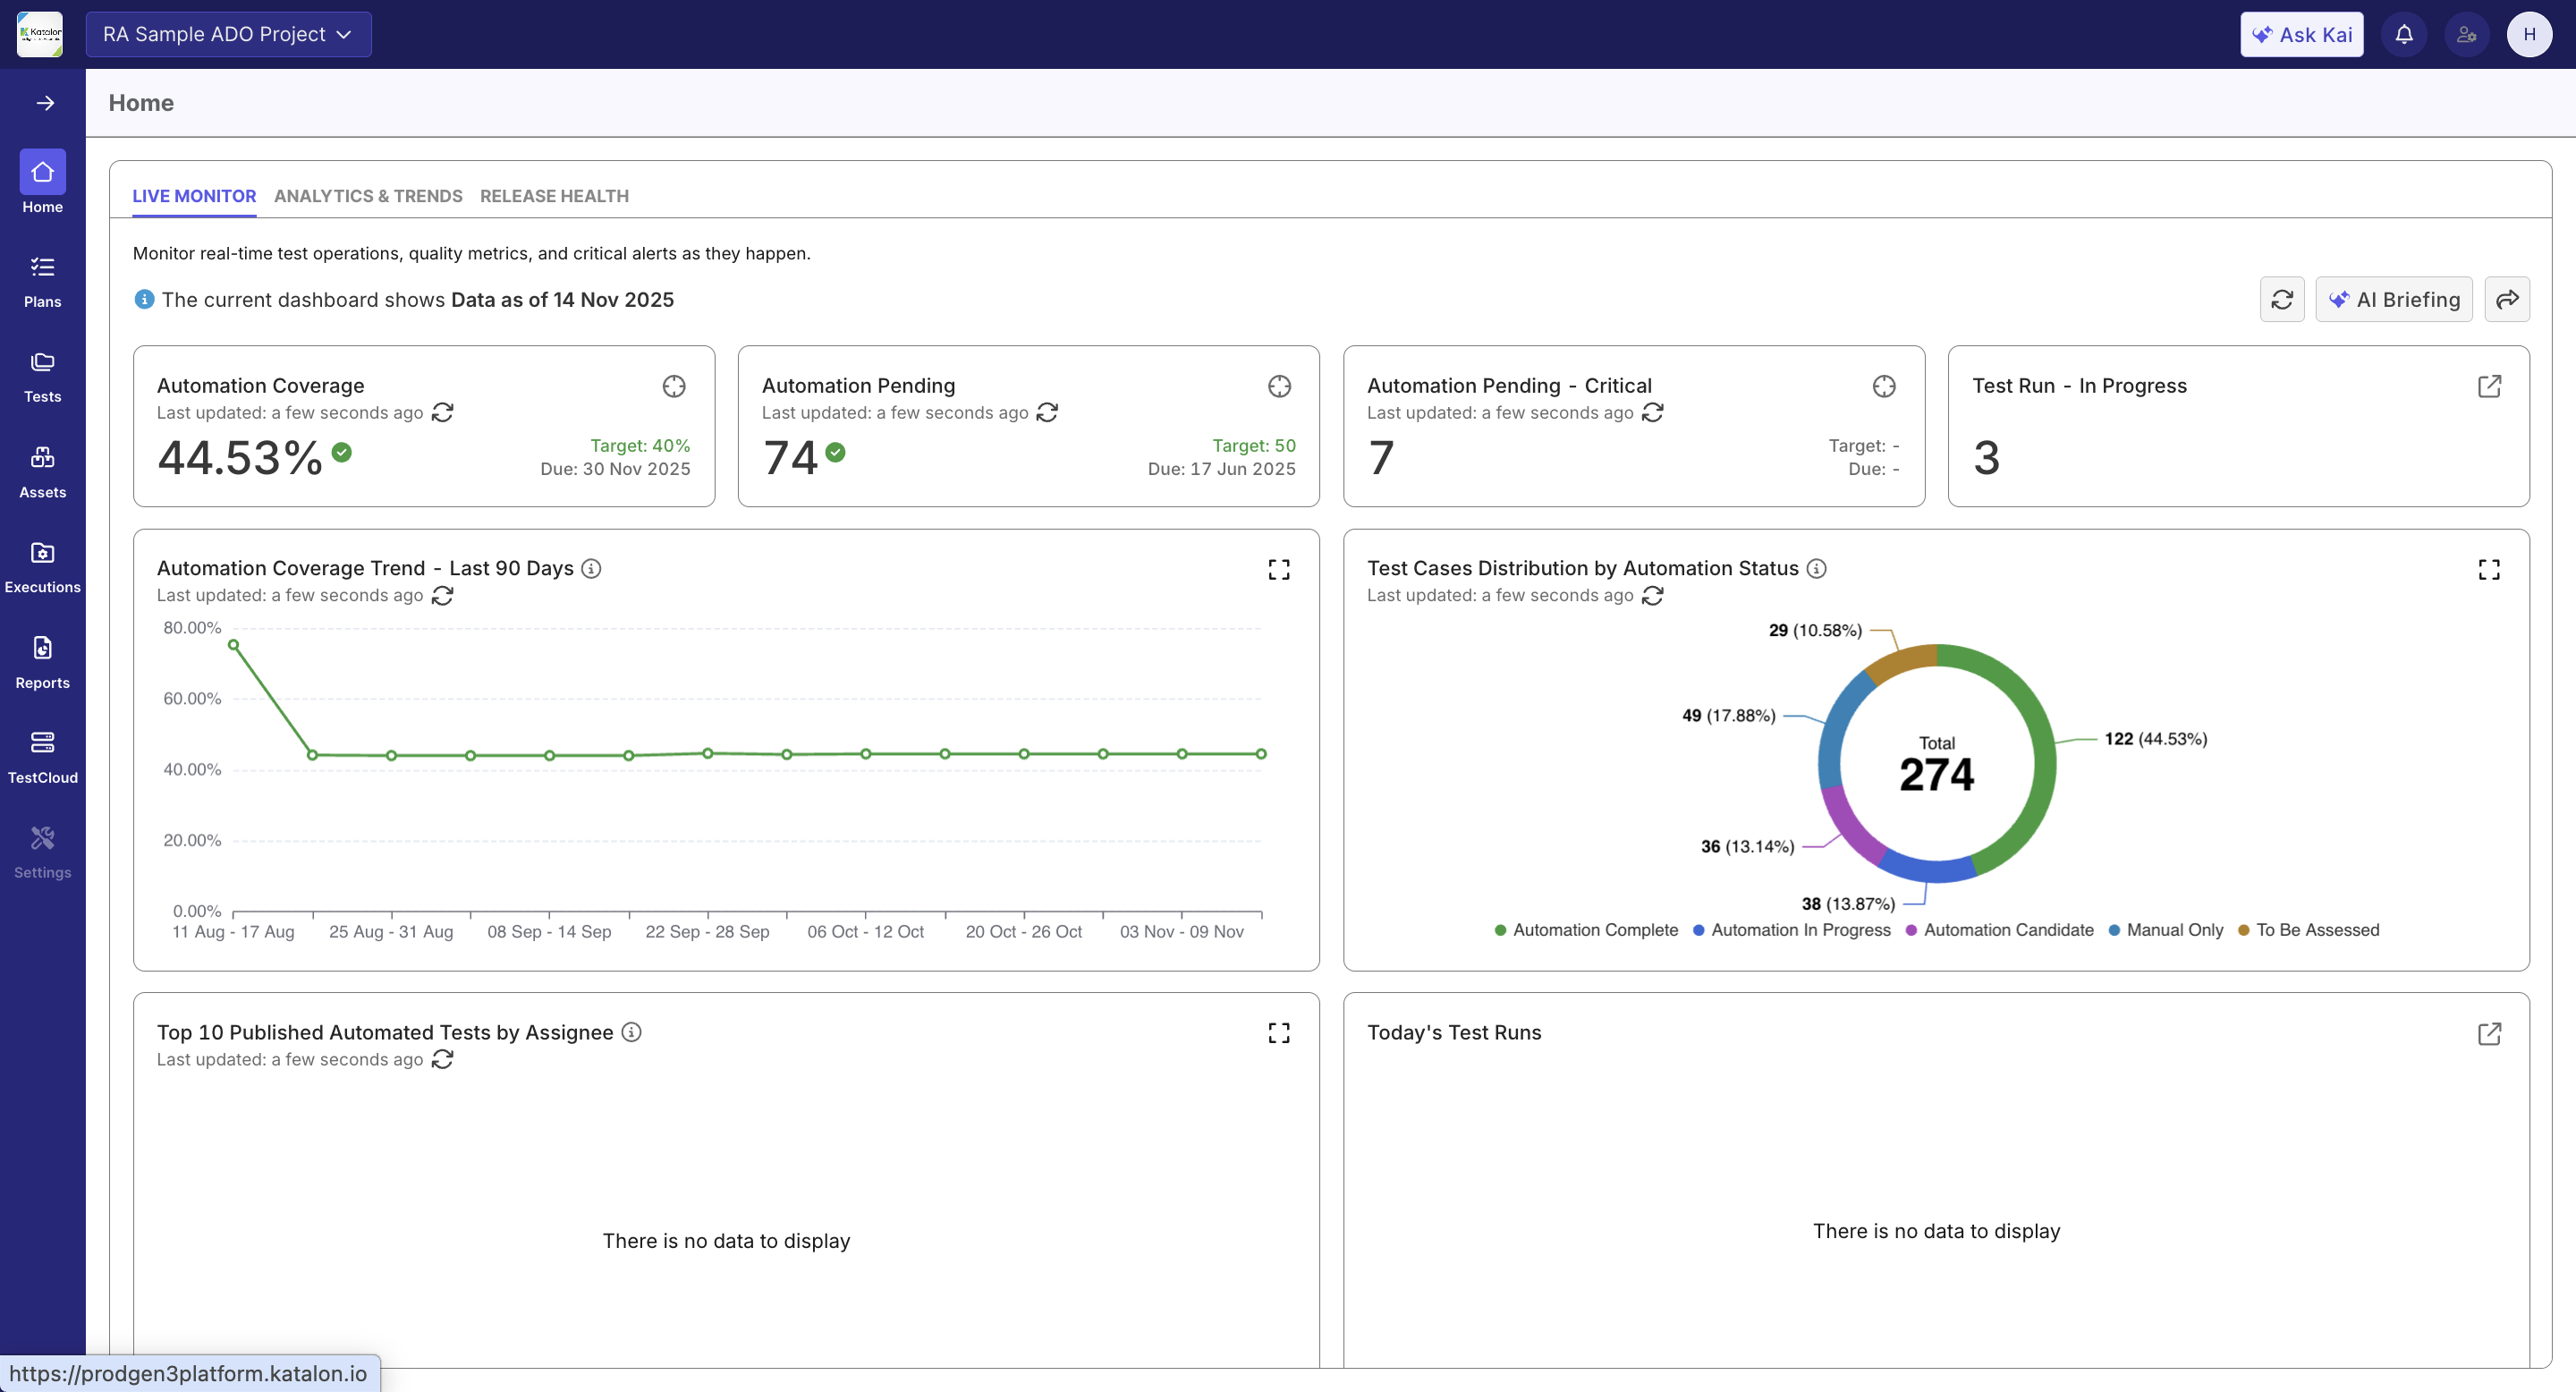
Instead of manually compiling metrics from multiple tools, TestOps consolidates data from connected ALM and CI/CD systems into standardized models. This enables consistent visibility across time-based and iteration-based perspectives-helping teams monitor testing health, release readiness, and long-term quality trends.
How TestOps Structures and Uses Data
All analytics in TestOps are project-based. Each project aggregates entities like test cases, executions, requirements, and defects drawn from integrated tools such as Jira and Azure DevOps.
Data from these entities are presented in either time-based and iteration-based perspectives:
- Time-Based View – Focus on activities and trends within a date range (e.g., testing activity this month, defect trends over time).
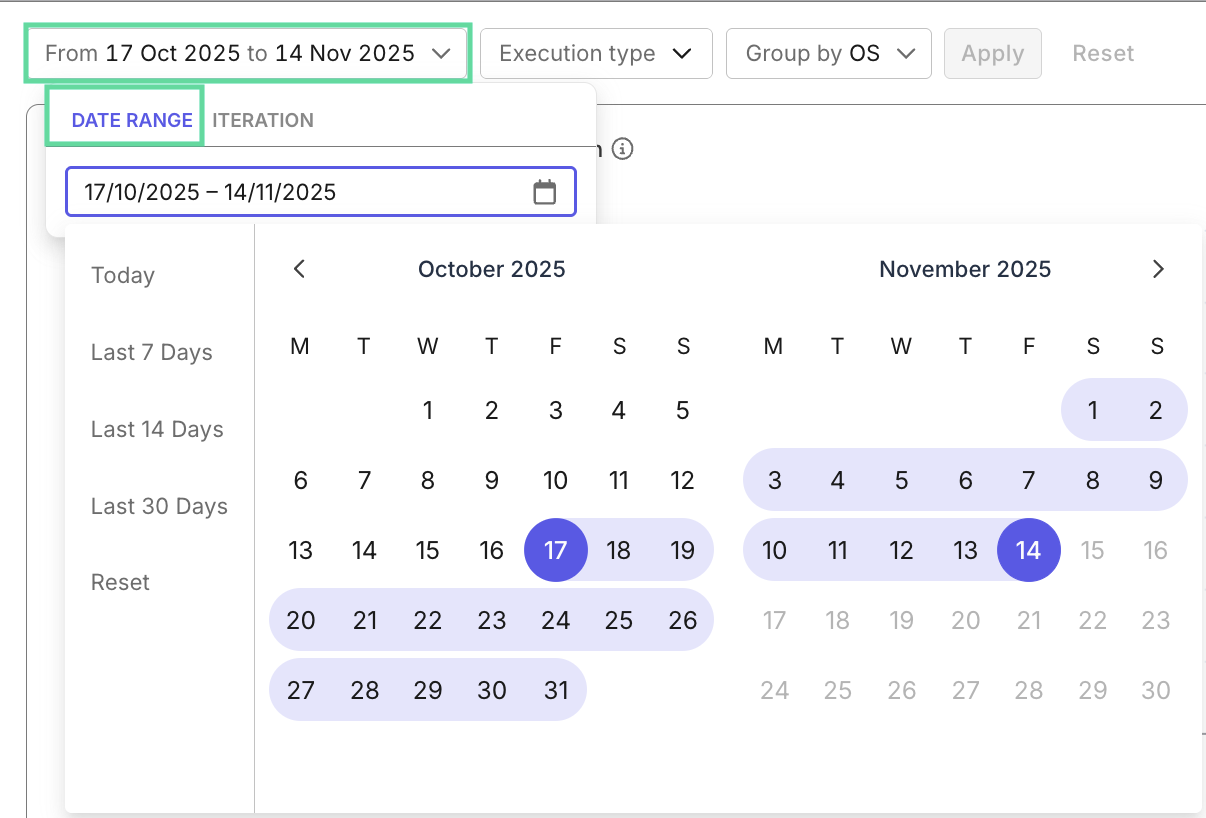
- Iteration-Based View (Release/Sprint) – Focus on milestones and readiness evaluation for specific iterations or versions.
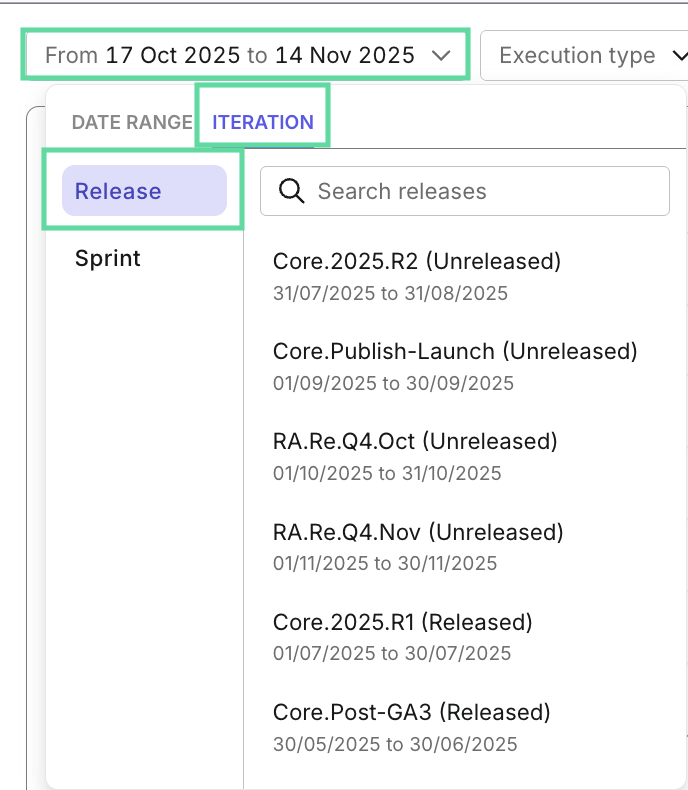
This approach guarantees that all TestOps dashboards and reports interpret data consistently, providing reliable comparisons across projects and timelines.
Core Features of TestOps Analytics
Dashboards and Reports
TestOps provides dashboards for summaries and reports for deeper analysis.
- Dashboards (e.g., Analytics & Trends, Release Readiness, Live Monitor) give a quick overview of test health and execution progress.
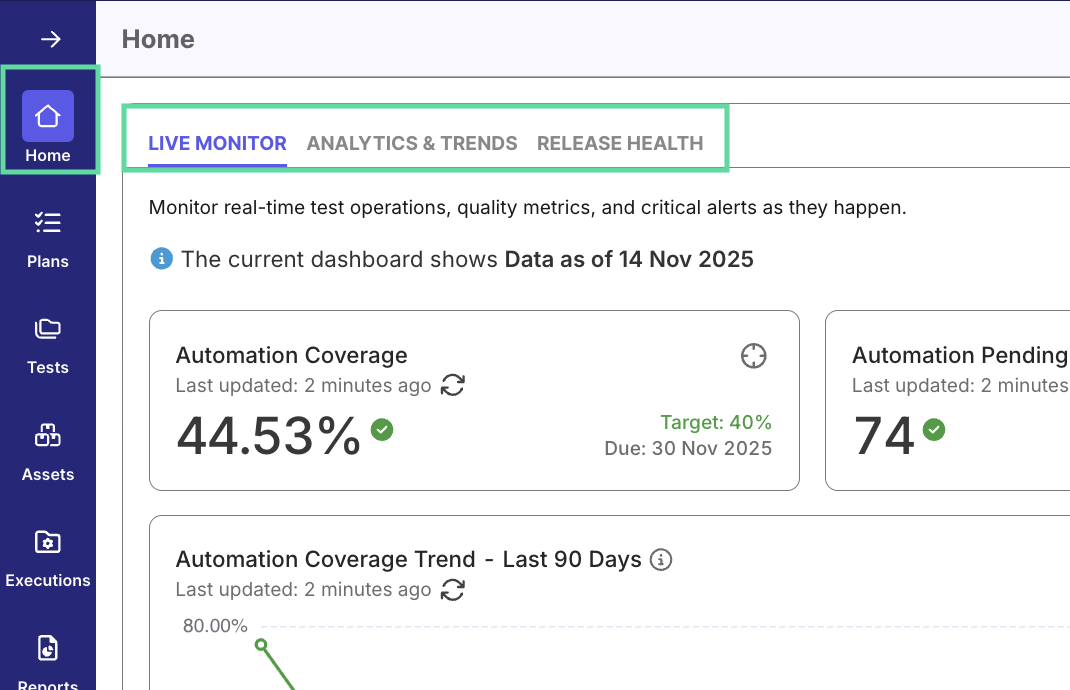
- Reports (e.g., Test Runs Analysis, Defect Trends, Requirement Coverage) let you drill into details to identify issues or improvement opportunities.
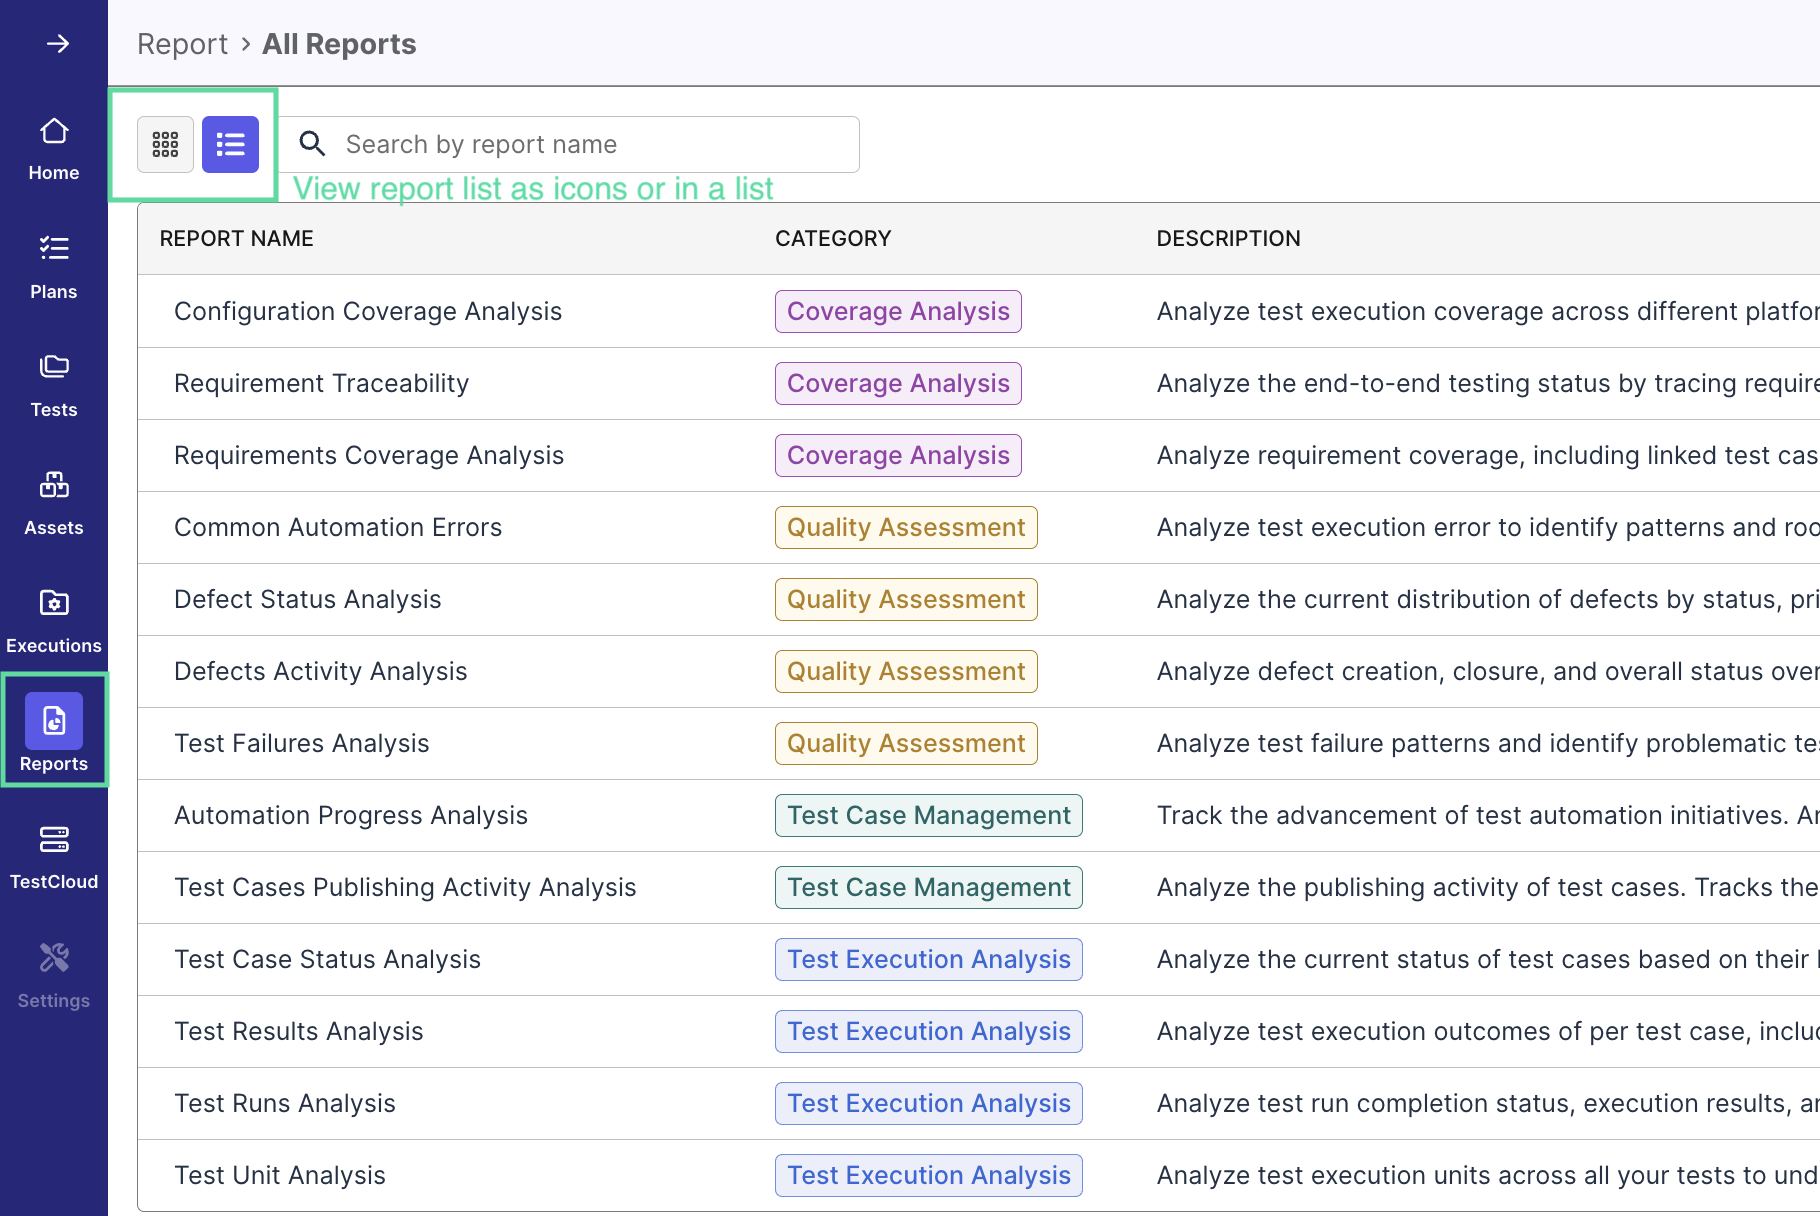
Together, dashboards and reports offer both high-level awareness and detailed investigation capability. View Navigate Dashboards and Reports section below for navigation tips.
Filtering and Scoping
You can switch between scope modes depending on your analysis goal:
-
Time-Based: to observe historical trends or productivity changes.
-
Release/Sprint: to evaluate iteration progress and quality.
For filters in reports, you can filter data by entity-level details (for example, Test Case Status, Defect Priority, or Run Type) and combine them with broader scopes such as Time-Based, or Release/Sprint.
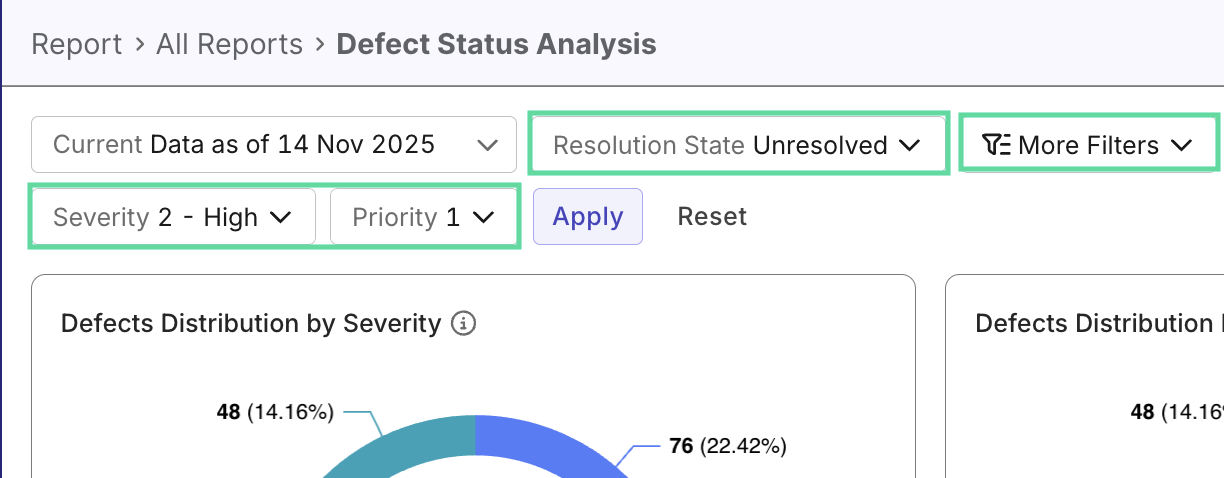
This gives you precise control over what data is shown, while keeping all widgets and reports synchronized to the same filter context.
Custom Views
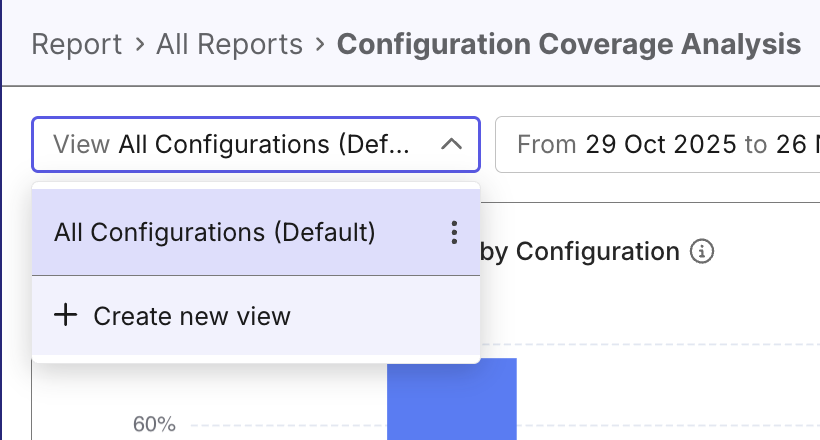
In any report, you can create custom views that store filter for different perspectives, to quickly switch between them without reconfiguring the filters each time. This is especially useful when you regularly configure one report for different purposes—such as focusing on failed automated tests, tests from specific suites, or activity within a particular sprint.
With the custom views, every report becomes a personalized workspace that adapts to the way you analyze quality.
What you can do:
- Save filter configurations: After applying filters in any report, save them as a new view with a descriptive name.
- Switch between views instantly: Use the view selector at the top of the report to load saved filter combinations with a single click.
- Set a default view: Mark your most-used view as the default so it automatically loads whenever you open that report.
- Manage your views: Edit, clone, or delete saved views as your analysis needs change.
Widgets and Visual Insights
Dashboards are composed of widgets, modular visual elements that summarize metrics from underlying reports. You can expand widgets to view more details and see the report it's linked to:
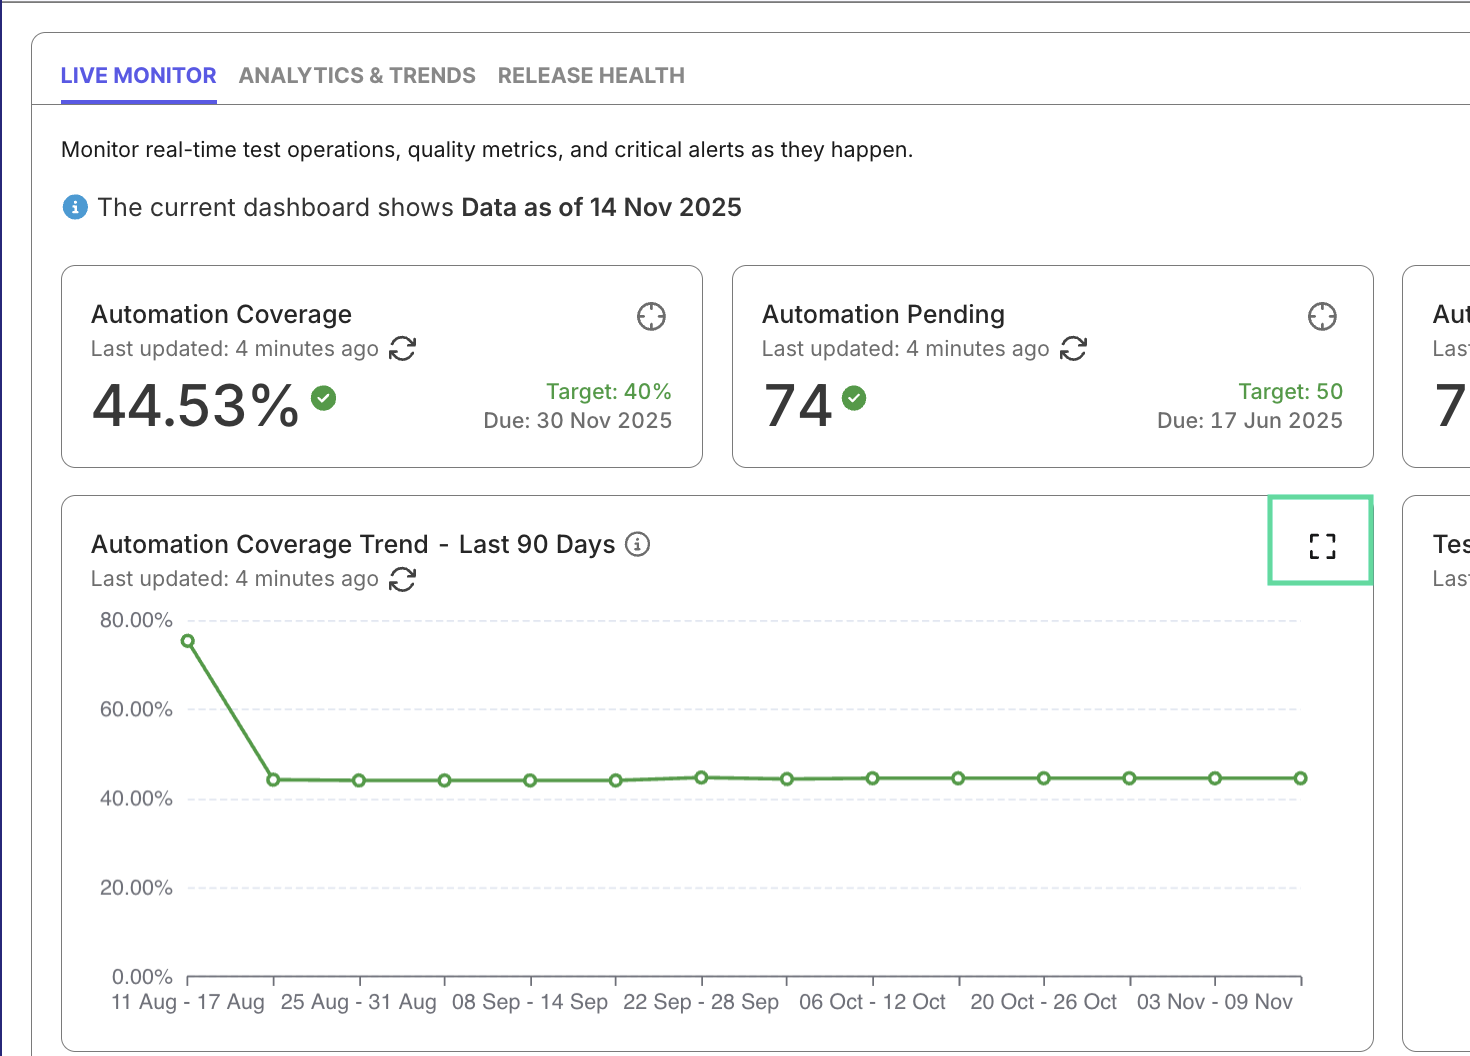
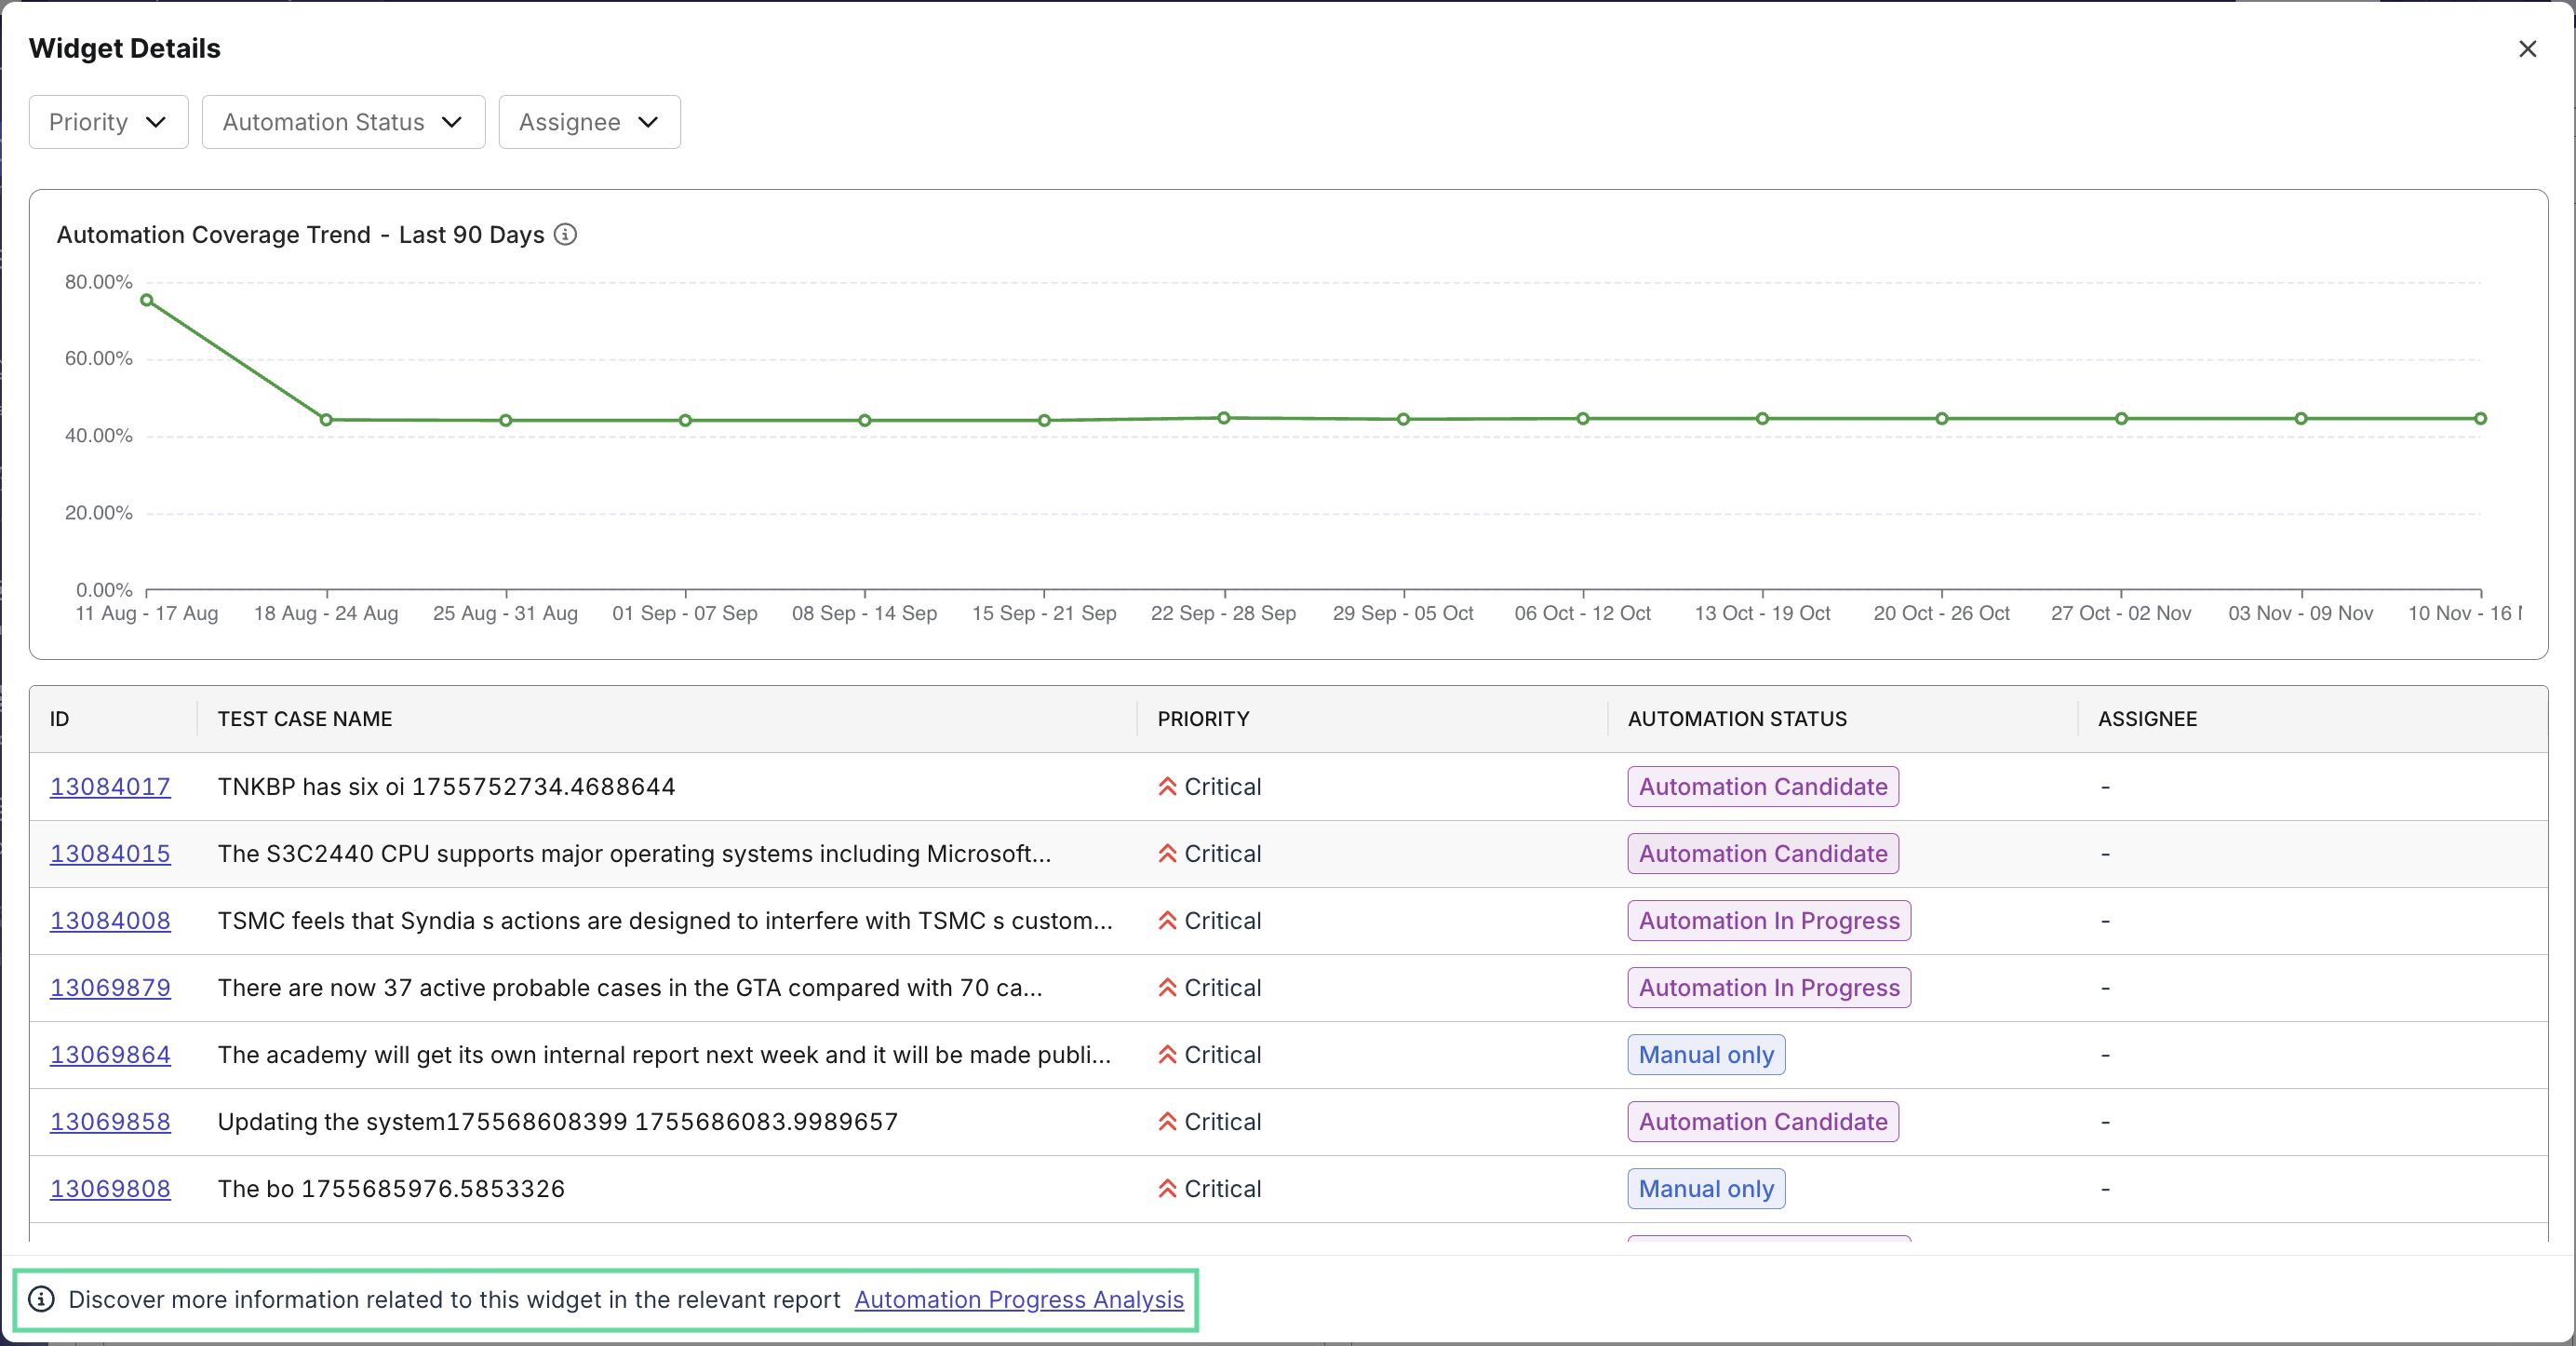
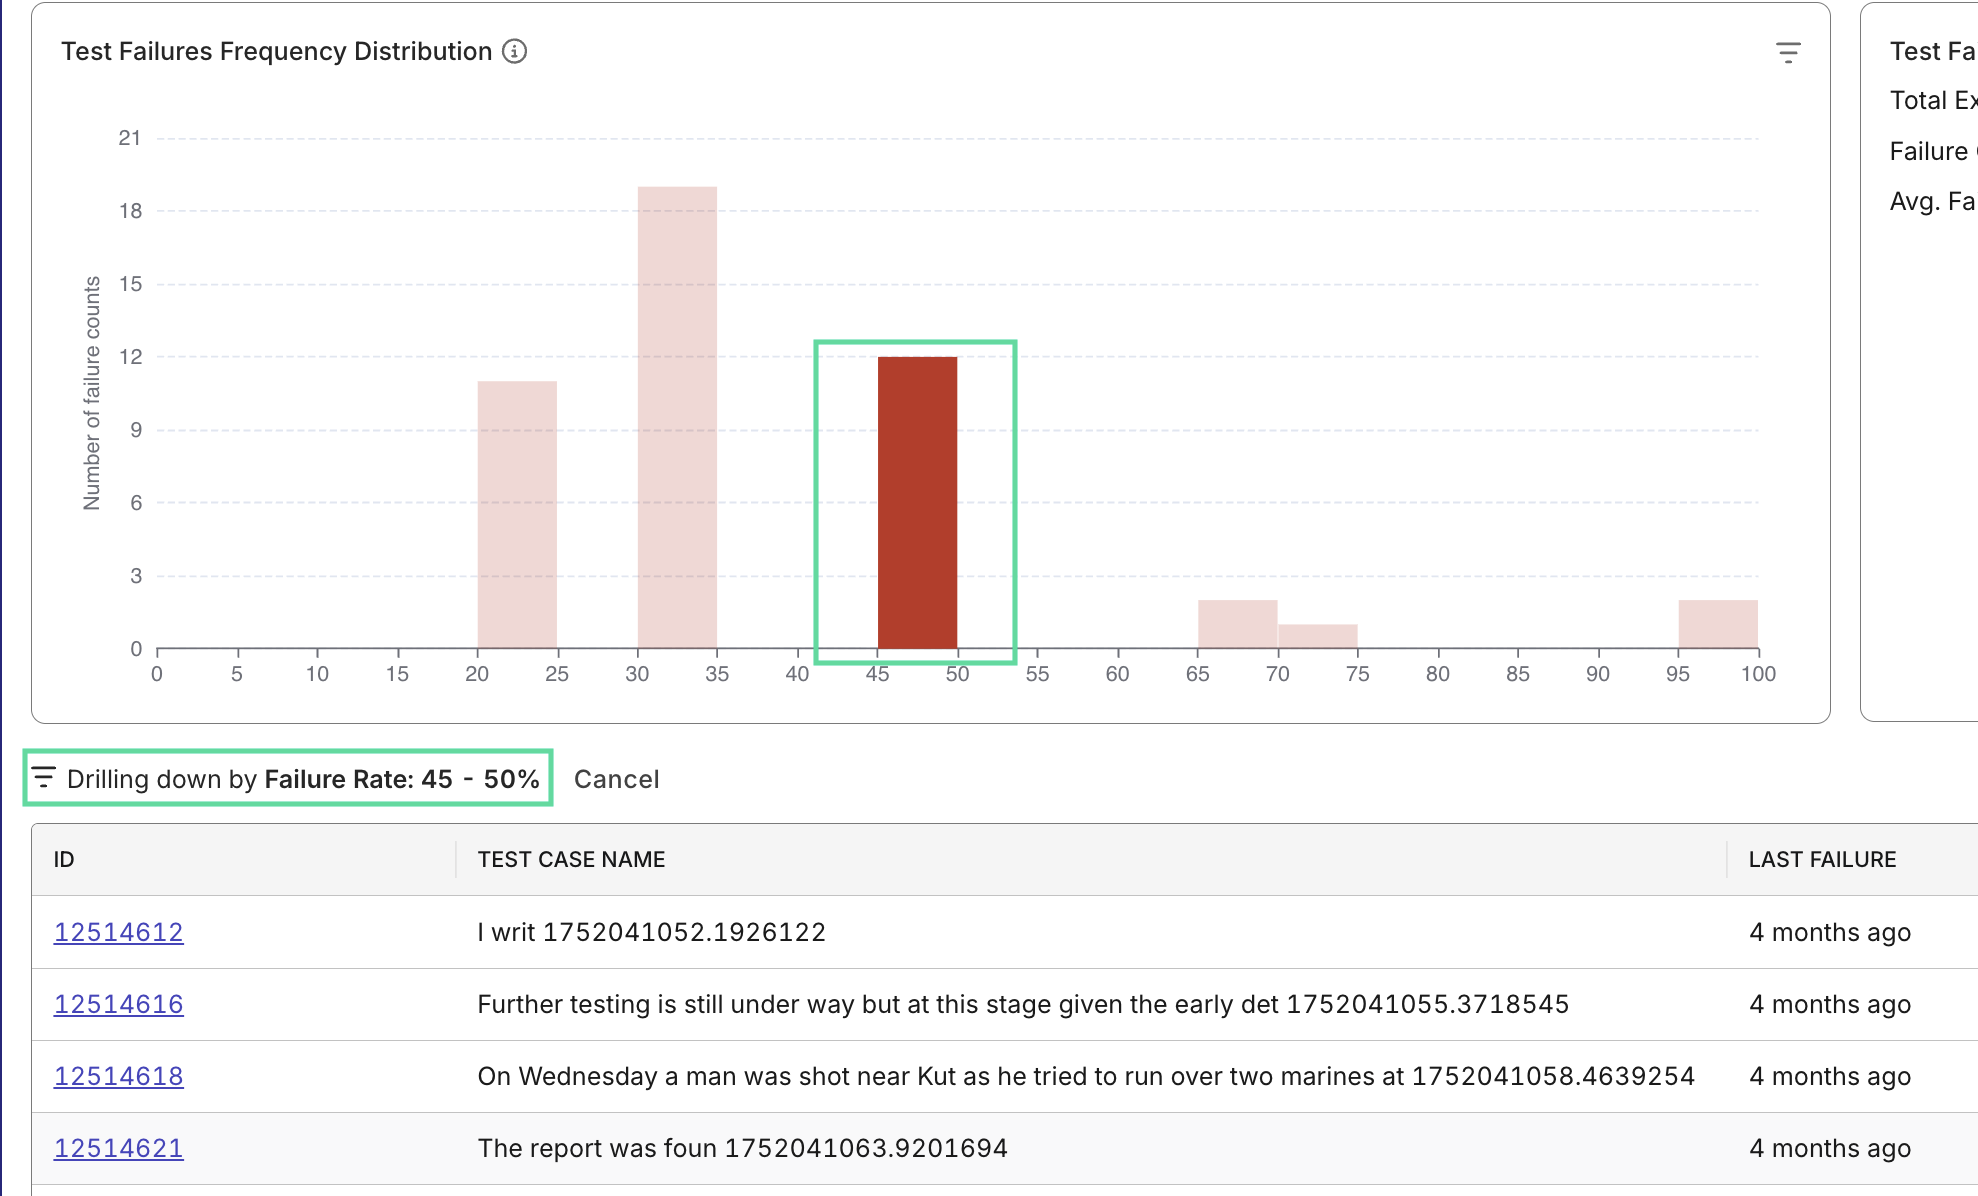
While widgets are static in dashboards, they become interactive report view - clicking a segment filters and refreshes the related data view below it. This allows seamless transition from visual overview to analytical evidence.
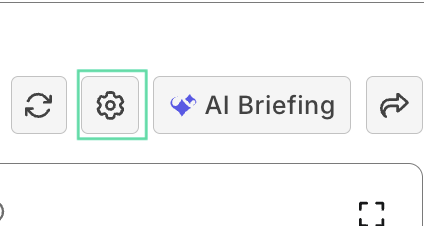
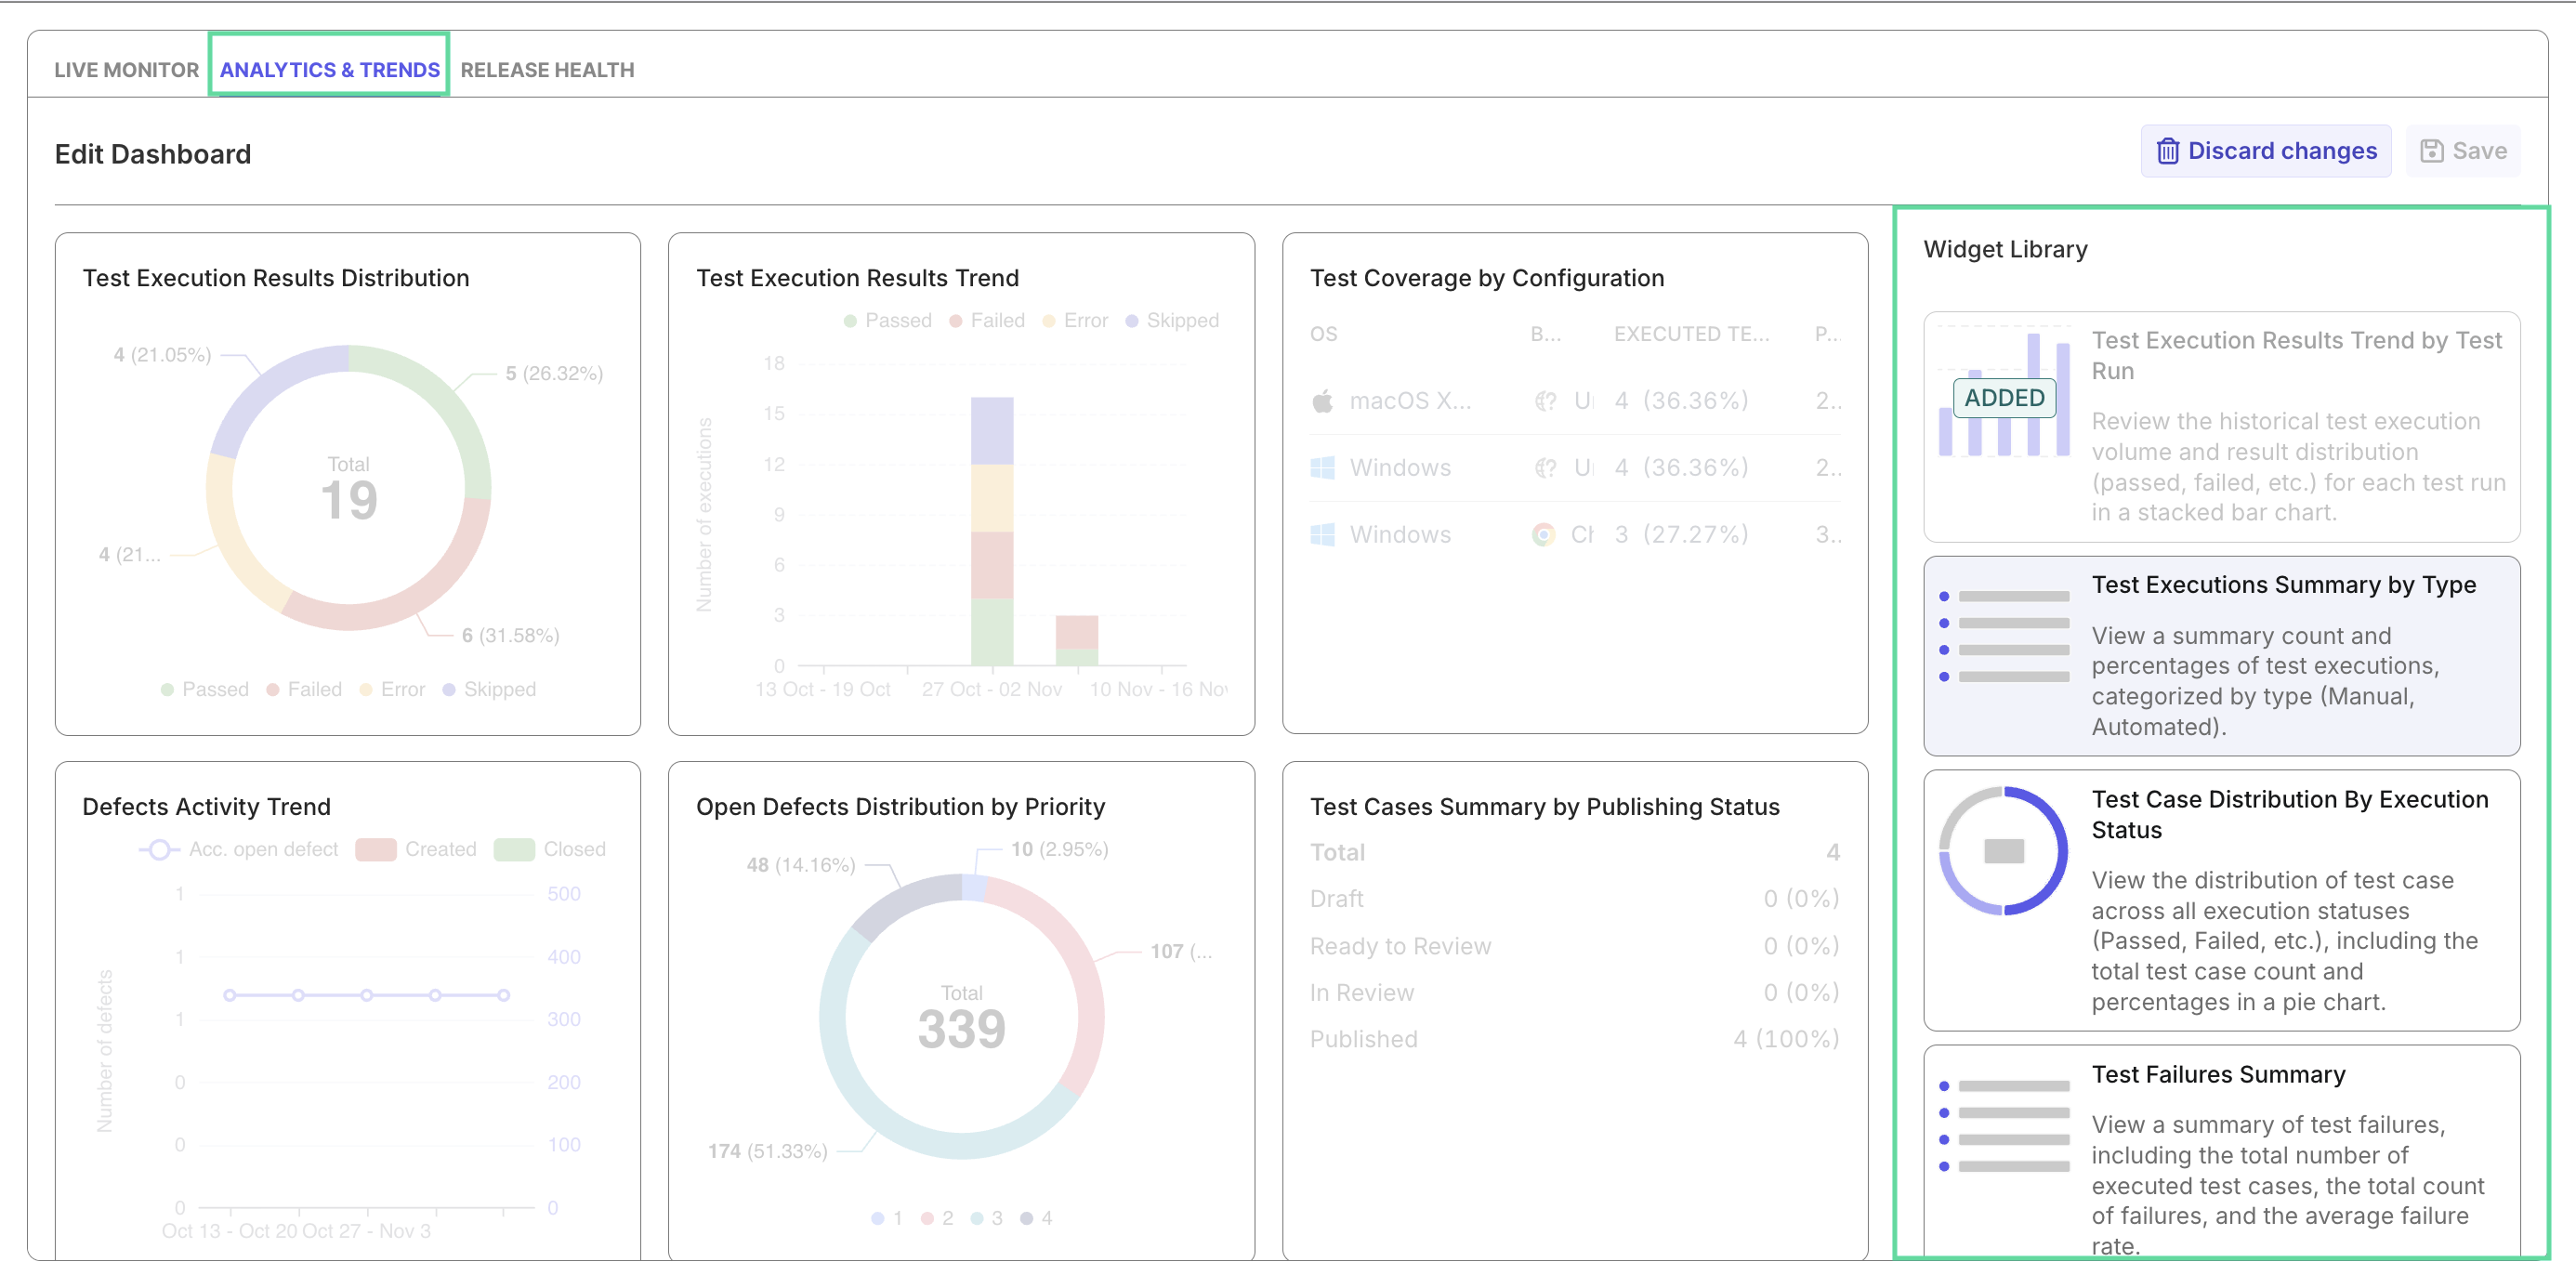
For Analytics & Trends dashboard, you can customize the dashboard by adding more widgets pulled from reports, to tailor to your team's needs.
AI Summarization
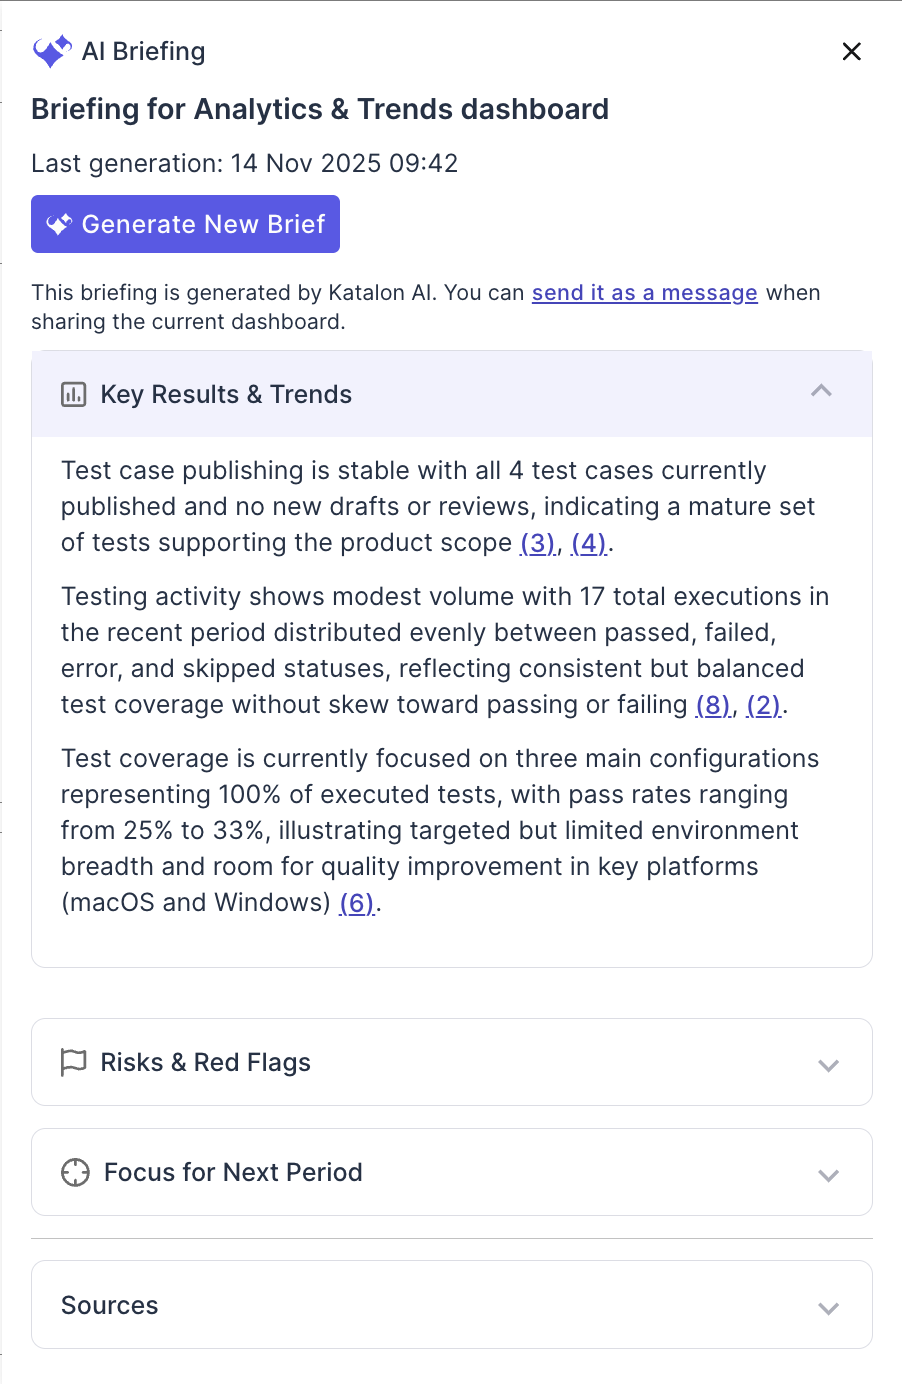
The AI Summary feature condenses report data into concise, insight-ready text for stakeholders. It captures key achievements, risks, and trends to support executive briefings and retrospectives with minimal effort.
Export and Sharing
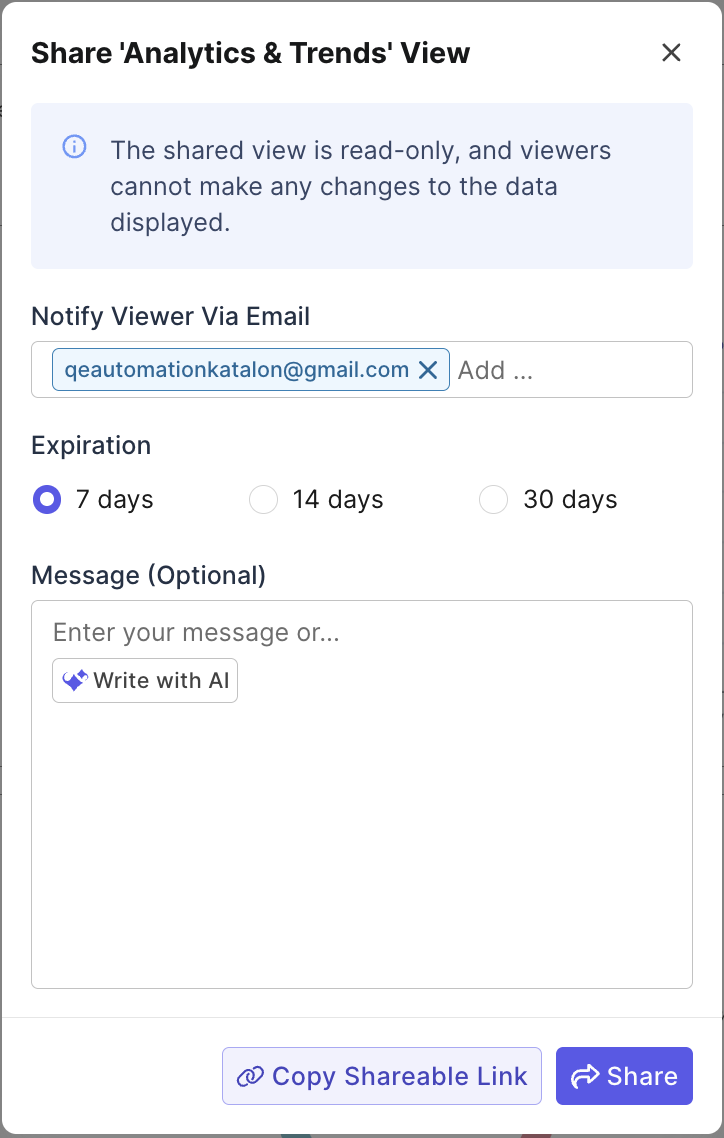
Each dashboard or report can be exported to PDF, CSV, or Excel for record-keeping or shared directly via link. This simplifies collaboration and enables teams to review the same data during stand-ups, sprint reviews, or release planning.
Navigate Dashboards and Reports
TestOps offers three main dashboards and a collection of specialized reports that work together to form a complete analysis ecosystem.
Dashboards for Overviews
Live Monitor Dashboard – Real-time visibility into ongoing runs, automation health, and open defects. See more details at Live Monitor Dashboard.
Analytics & Trends – Time-based and iteration-based trend analysis for test performance and team productivity. See more details at Analytics & Trends Dashboard.
Release Readiness Dashboard – Quality gate and threshold tracking to assess release or sprint readiness. See more details at Release Readiness Dashboard.
Reports for Deep-Dive Analysis
Reports target a specific aspect of testing performance, and are grouped by purpose for easy navigation:
Coverage Analysis:
- Configuration Coverage Analysis - Pass/fail coverage by environments (OS, browser, device, profile) to reveal gaps or env-specific issues. See more details at Configuration Coverage Analysis Report.
- Requirement Coverage Analysis - Which requirements are linked to tests and verified, useful for progress toward coverage goals. See more details at Requirement Coverage Analysis Report.
- Requirement Traceability - End-to-end mapping across Requirement ↔ Test Case ↔ Test Result ↔ Defect for compliance and audit. See more details at Requirement Traceability Report.
Quality Assessment:
- Common Automation Errors - Recurring automation error types (e.g., locator/timeout) to prioritize fix-the-framework tasks. See more details at Common Automation Errors.
- Defect Status Analysis - Live picture of defect backlog by severity/priority and resolution state (e.g., unresolved vs. resolved). See more details at Defect Status Analysis Report.
- Defect Activity Analysis - Open/close velocity and net change in defects to gauge how quickly issues are being addressed. See more details at Defect Activity Analysis Report.
Test Case Management:
- Automation Progress Analysis - Movement of automated vs. manual over time against targets to track automation adoption. See more details at Automation Progress Analysis Report.
- Test Cases Publishing Activity Analysis - Authoring/publishing throughput and distribution to understand team test creation output. See more details at Test Cases Publishing Activity Analysis Report.
Test Execution Analysis:
- Test Case Status Analysis - Current status distribution and latest outcomes for test cases within the selected sprint/release or time window. See more details at Test Case Status Analysis Report.
- Test Results Analysis - Trends of execution outcomes (pass/fail/error/skipped, etc.) across the chosen period to spot anomalies or regressions. See more details at Test Results Analysis Report.
- Test Runs Analysis - Volume and stability of test suite executions, with recent run patterns and overall run health in scope. See more details at Test Runs Analysis Report.
- Test Failure Analysis - Concentration of repeated failures and flaky tests to target stabilization work in automation or environment. See more details at Test Failure Analysis Report.
Each report shares the same design logic - filter → visualize → analyze → export - ensuring that you can move intuitively between dashboards and detailed data exploration.