Test Failures Analysis Report
This document explains how to use the Test Failures Analysis Report to identify, diagnose, and prioritize failing or flaky automated test cases within a project’s execution history.

With this report, you can visualize failure trends, locate problematic tests, and make data-driven decisions to improve test suite reliability.
Why Use This Report
- Monitor test suite health to understand overall automation quality and identify systemic issues.
- Assess test stability by distinguishing between consistently failing and intermittently flaky test cases.
- Prioritize remediation by focusing on test cases with the highest impact or consistent failure patterns.
- Accelerate root cause investigation by pinpointing specific test cases that require deeper exploration before diving into raw execution data.
- Track test quality over time to evaluate the effectiveness of fixes and test maintenance efforts.
Explore the Report
- Navigate to Home > All Reports > Test Failures Analysis
- Select Scope and Filters
- A time period or Release/Sprint.
- Add filters to your needs: by Profile, Test Suite, Test Suite Collection, Executor or Build Label.
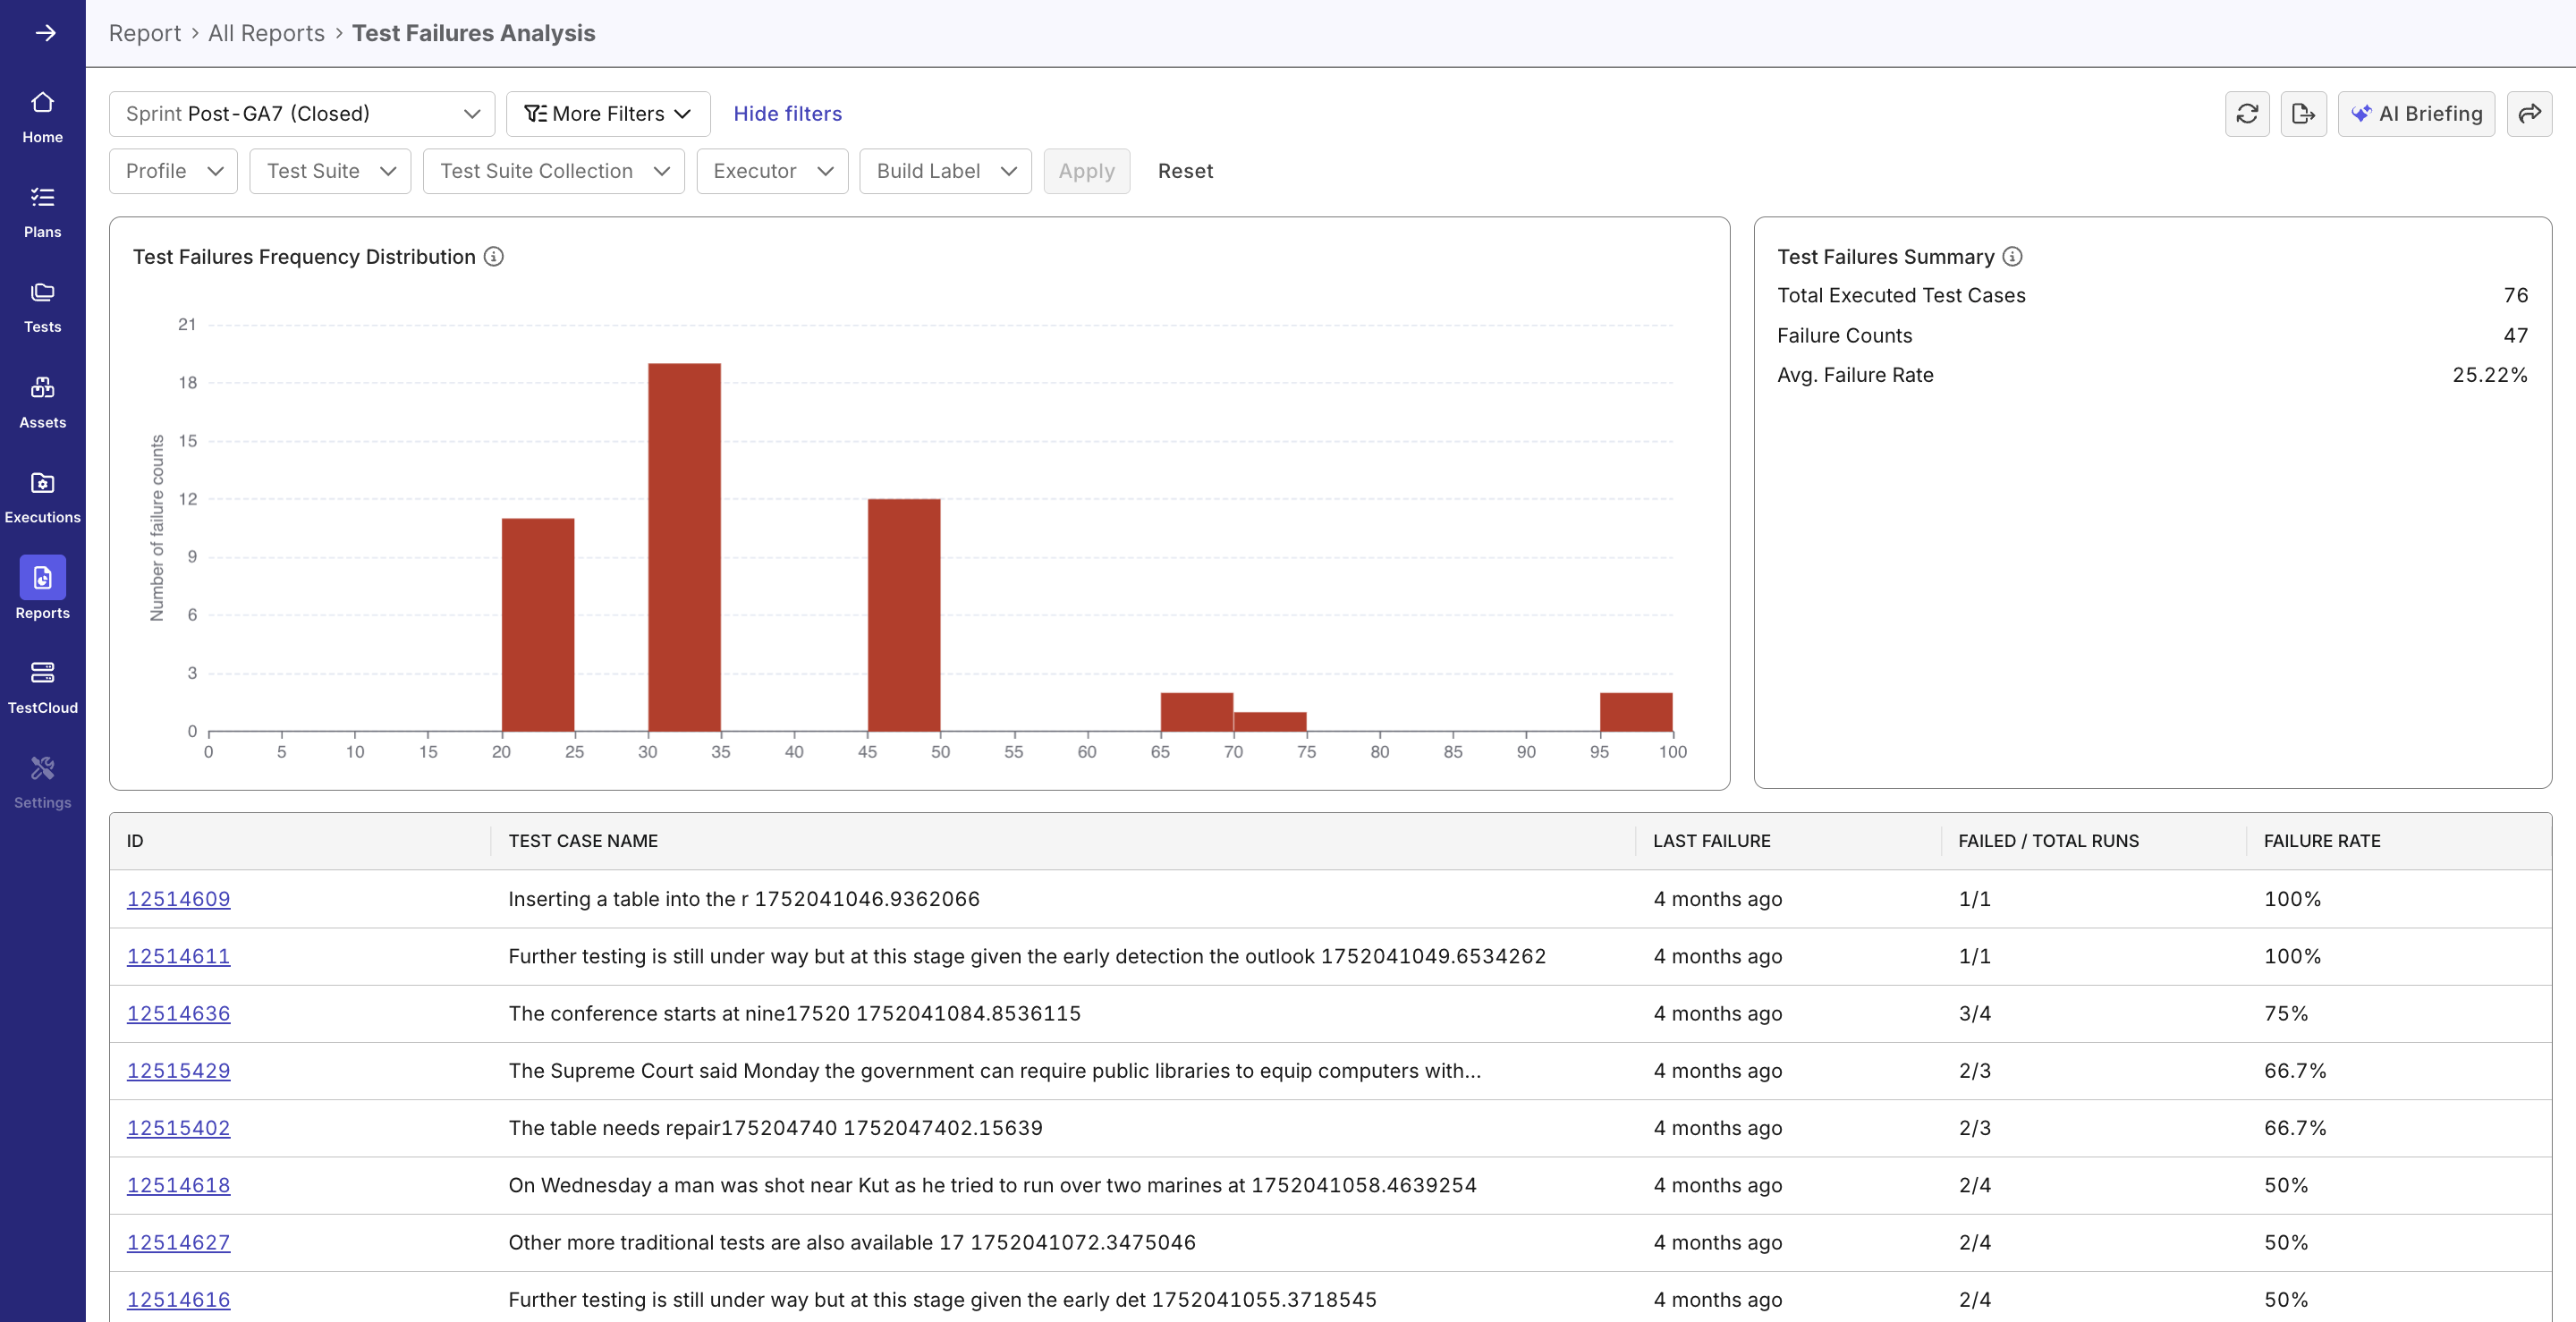
- Review the Summary Panel for these overall test health indicators:
- Total executed test cases
- Total failure counts
- Average failure rate (%)
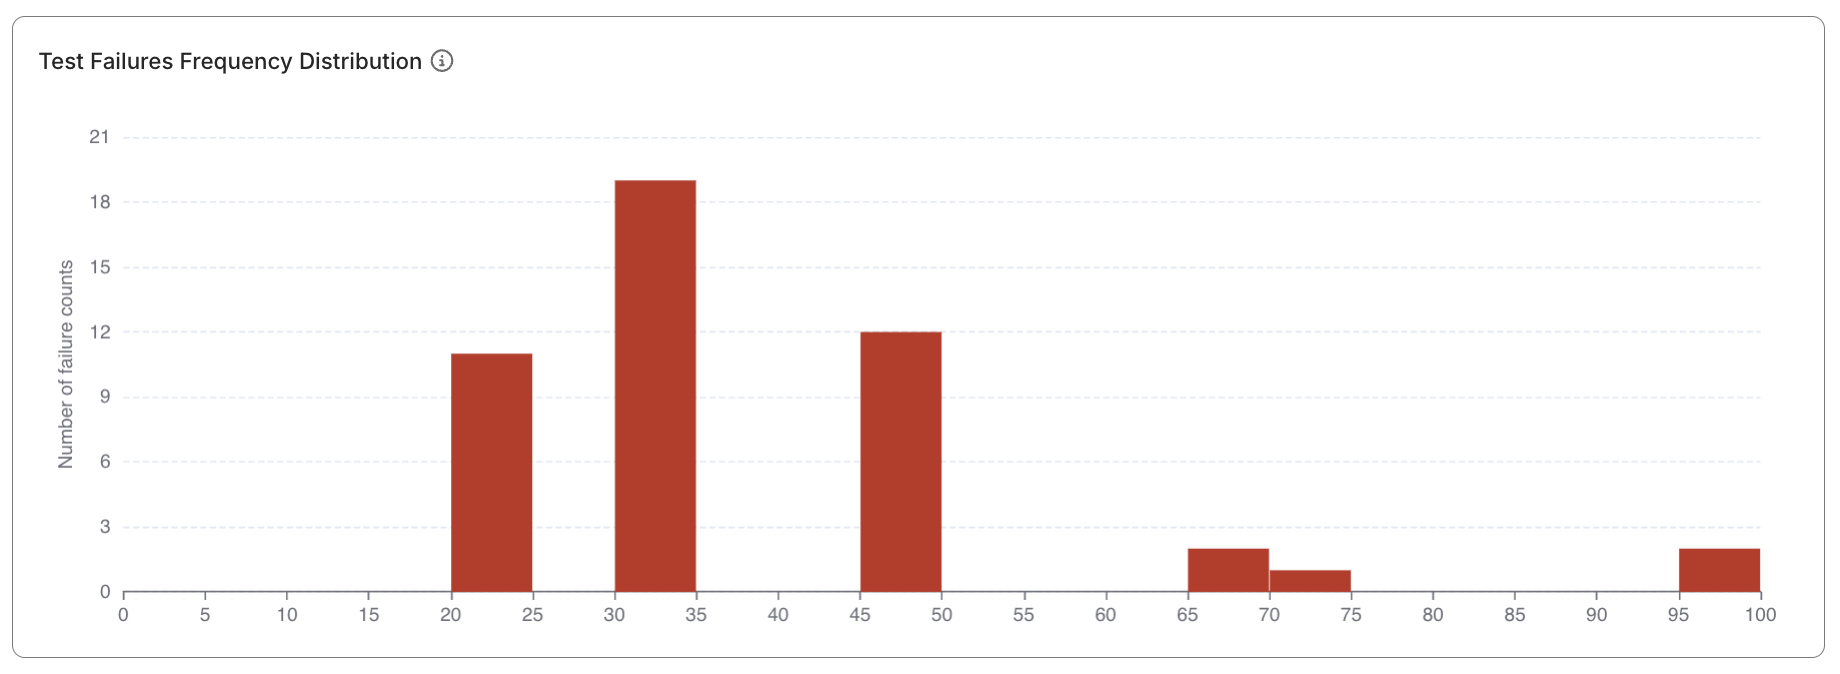
- View the Failure Frequency Distribution Chart
The histogram visualizes how many test cases fall within each failure rate range (e.g., 0–10%, 10–20%, etc.).- High concentration at 100% > Broken or invalid tests.
- Spread in 20–80% range > Flaky or environment-sensitive tests.
- Low failure density (less than 10%) > Generally stable tests.
- Drill Down into Test Case Details
Scroll down to the Test Case Details Table. Each row lists:- Test case ID and name
- Last failure timestamp
- Failed/Total run ratio (e.g., 44/44, 34/54)
- Calculated failure rate percentage Click any Test Case ID to open its details for deeper investigation.
- Use Widget-Level Drill-downs
Within charts and panels, click data points to reveal detailed views or filtered test case lists.
Report Features
Filtering & Scoping
Narrow the dataset to focus on relevant subsets:
- Time Range Selector: Choose from predefined or custom date ranges.
- Context Filters: Profile, Test Suite, Test Suite Collection, Executor, Build Label.
- Combine filters to isolate failures by environment, configuration, or version.
Summary Metrics Panel
Displays top-level indicators summarizing execution activity and failure performance:
- Total Executed Test Cases: Number of distinct test cases run within the selected scope.
- Total Failure Counts: Aggregate number of failed runs across all cases.
- Average Failure Rate: Average percentage of failed runs during the analysis period.
                        Failed Runs
Average Failure Rate = ------------- × 100%
                        Total Runs
This helps QA leads assess whether the test suite is trending toward stability or degradation.

Failure Frequency Distribution Chart
A histogram showing how test cases distribute across different failure rate ranges:
- Visualizes concentrations of stable, flaky, or broken tests.
- Quickly identifies “hot zones” of unreliability.
- Useful for communicating test quality trends to stakeholders.

Test Case Details Table
A sortable, filterable table listing all test cases within the report scope:
- Columns include: ID, Name, Last Failure Timestamp, Failed/Total Ratio, and Failure Rate (%).
- Clickable Test Case IDs for drill-down navigation.
- Sorting: Order by failure rate to identify top problem areas first.

Drill-down & Navigation
Interact with report widgets to explore deeper data layers:
- Clicking bars in the histogram shows all tests within that failure rate range.
- Selecting a test case opens its historical run data.
- Enables transition from overview > insight > action.