Test Runs Analysis Report
Last updated: April 2026
This document lists features of the Test Runs Analysis Report.
The Test Runs Analysis Report helps teams monitor, evaluate, and interpret test execution performance across multiple test runs within a specific time period. With this report, you can track test execution health and stability overtime, identify patterns or anomalies, compare automation and manual testing activities, and evaluate executor performance through test run outcomes.
Tutorials:
Report Features
Filtering & Scope Control
- Customizable time range selection (daily, weekly, monthly) to match reporting needs. Scoping by Release or Sprint is also an option.
- Advanced filters allow granular slicing by test attributes such as type, status, executor, and profile.
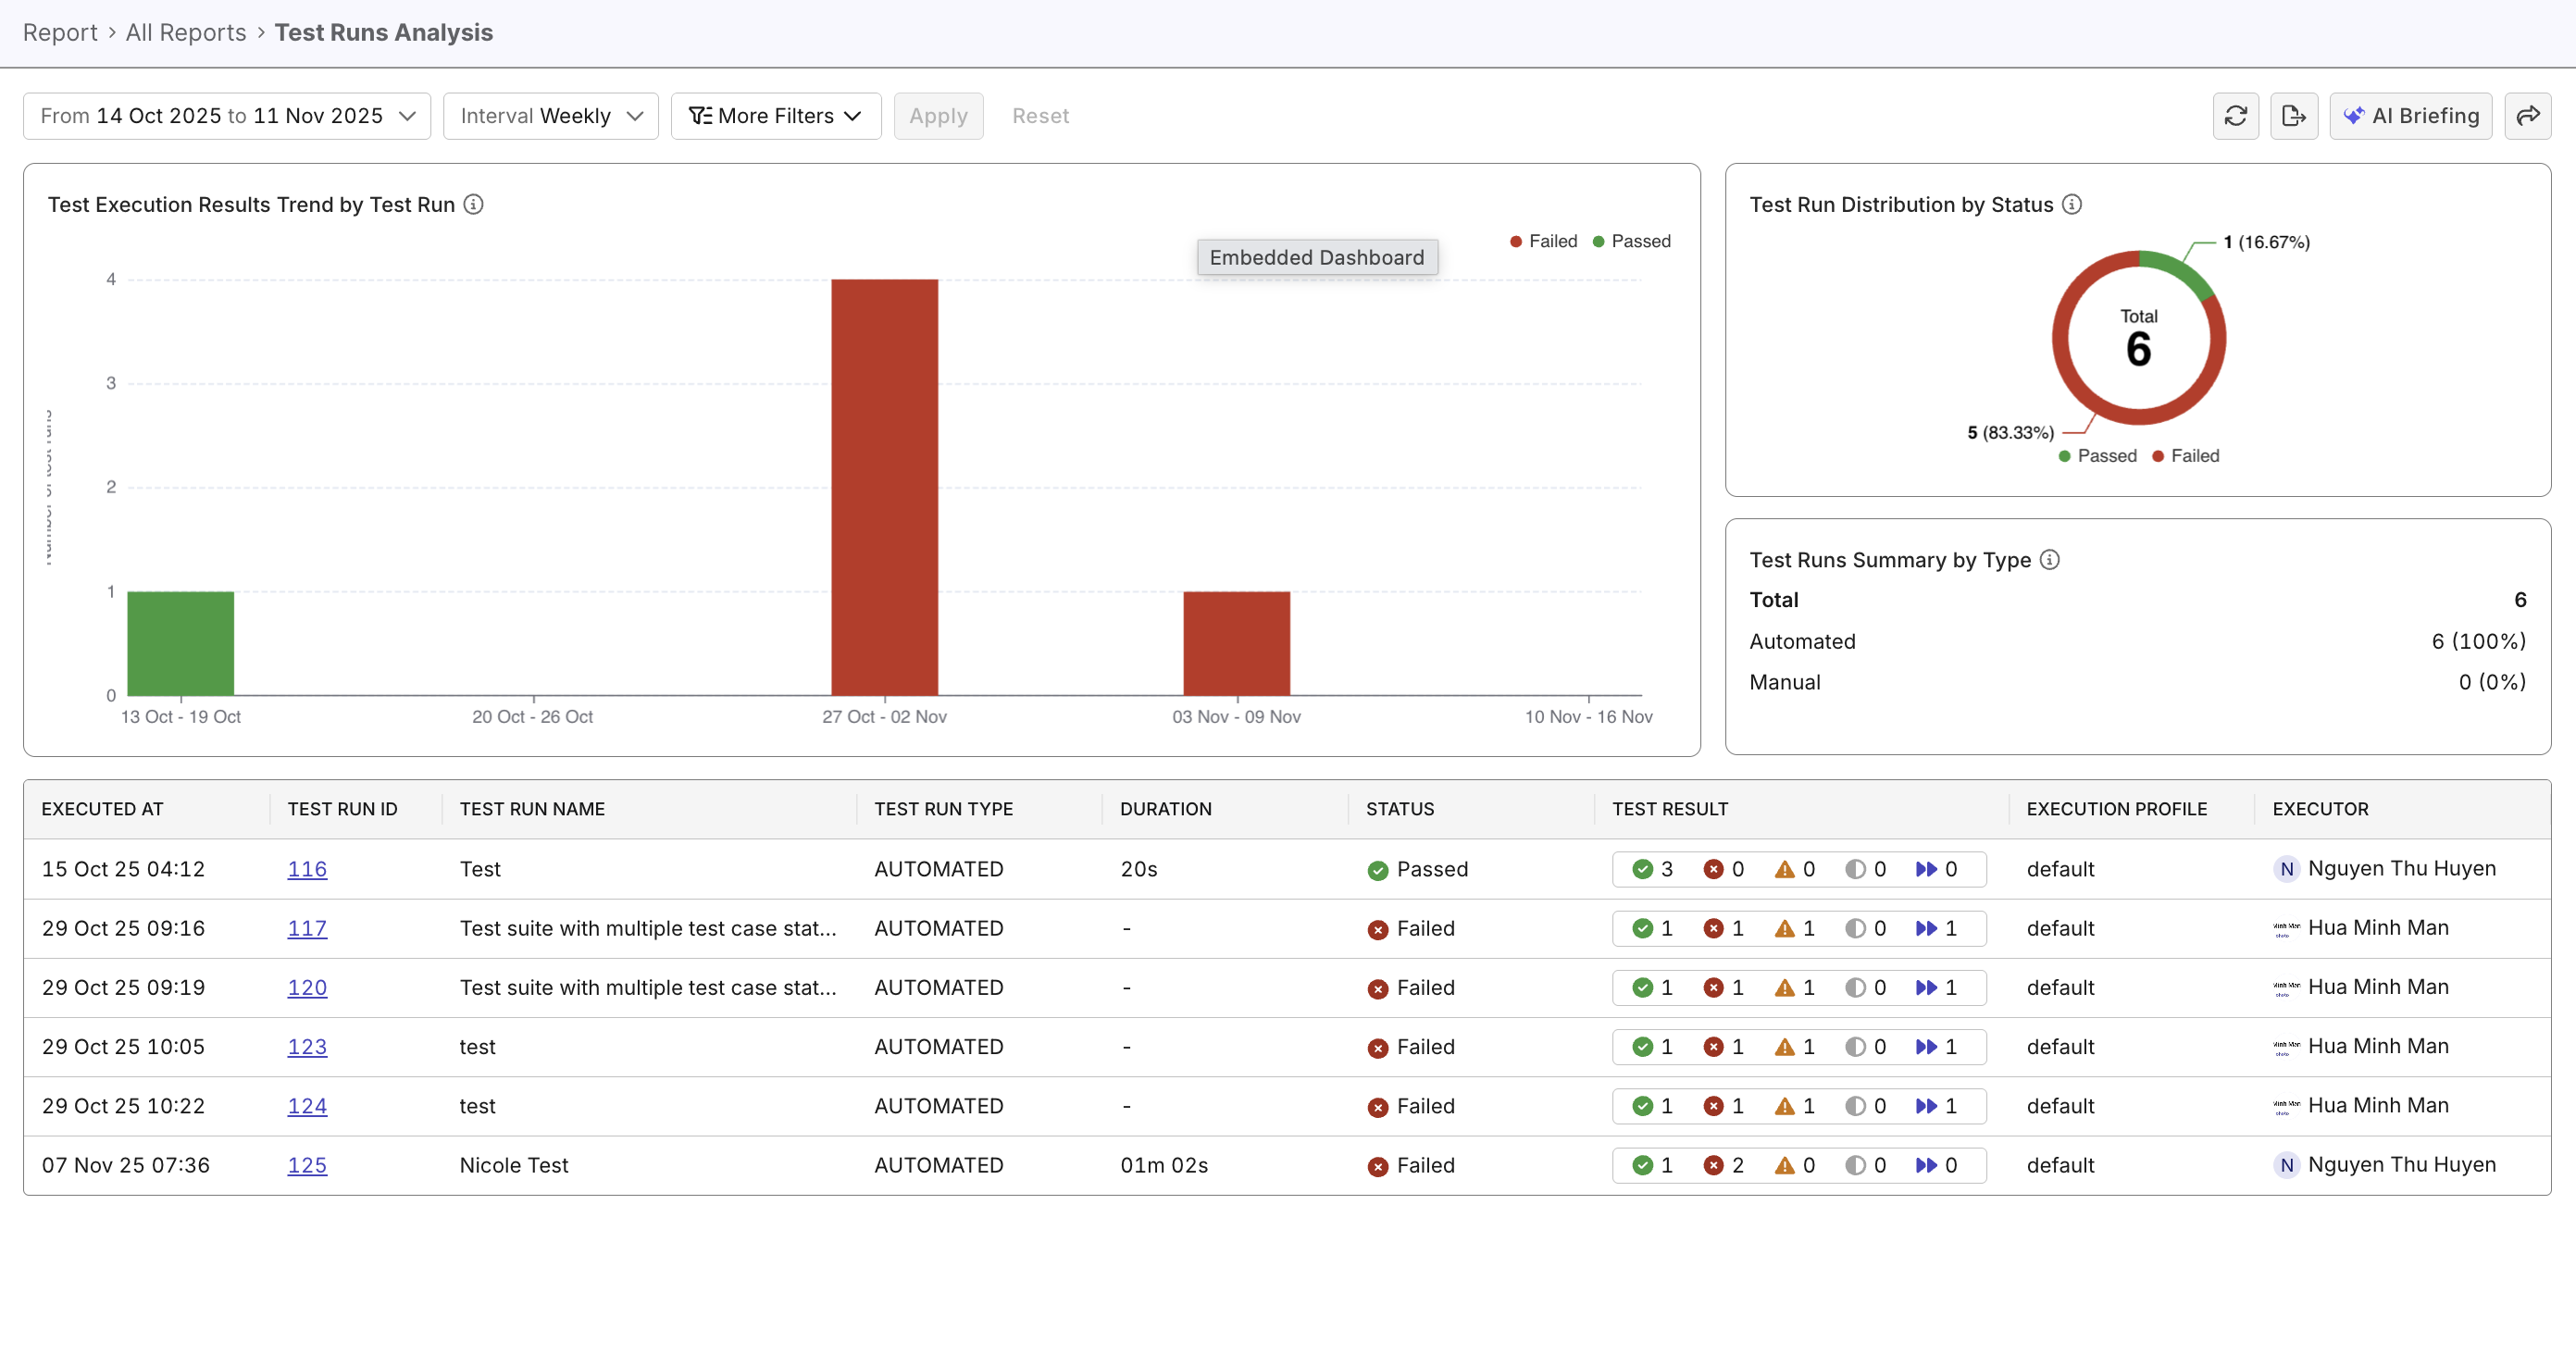
Test Execution Results Trend by Test Run widget
- A stacked bar visualization showing Passed, Failed, and Incomplete runs across the chosen intervals.
- Enables trend monitoring to spot regressions or improvements in test stability.
- Each bar section is clickable for drill-down to specific test run details.

Test Run Distribution by Status widget
- A donut chart summarizing the relative proportions of test outcomes.
- Quickly conveys the overall health of recent test runs.
- Useful for quick executive summaries.
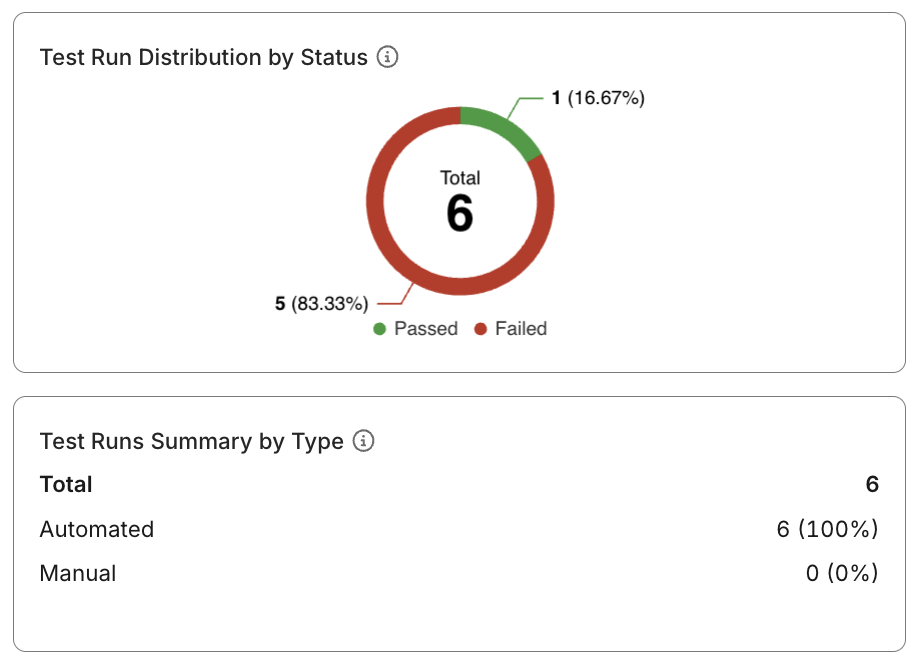
Test Runs Summary by Type
- A table breakdown of Automated vs. Manual test runs.
- Provides insight into automation coverage and testing capacity.
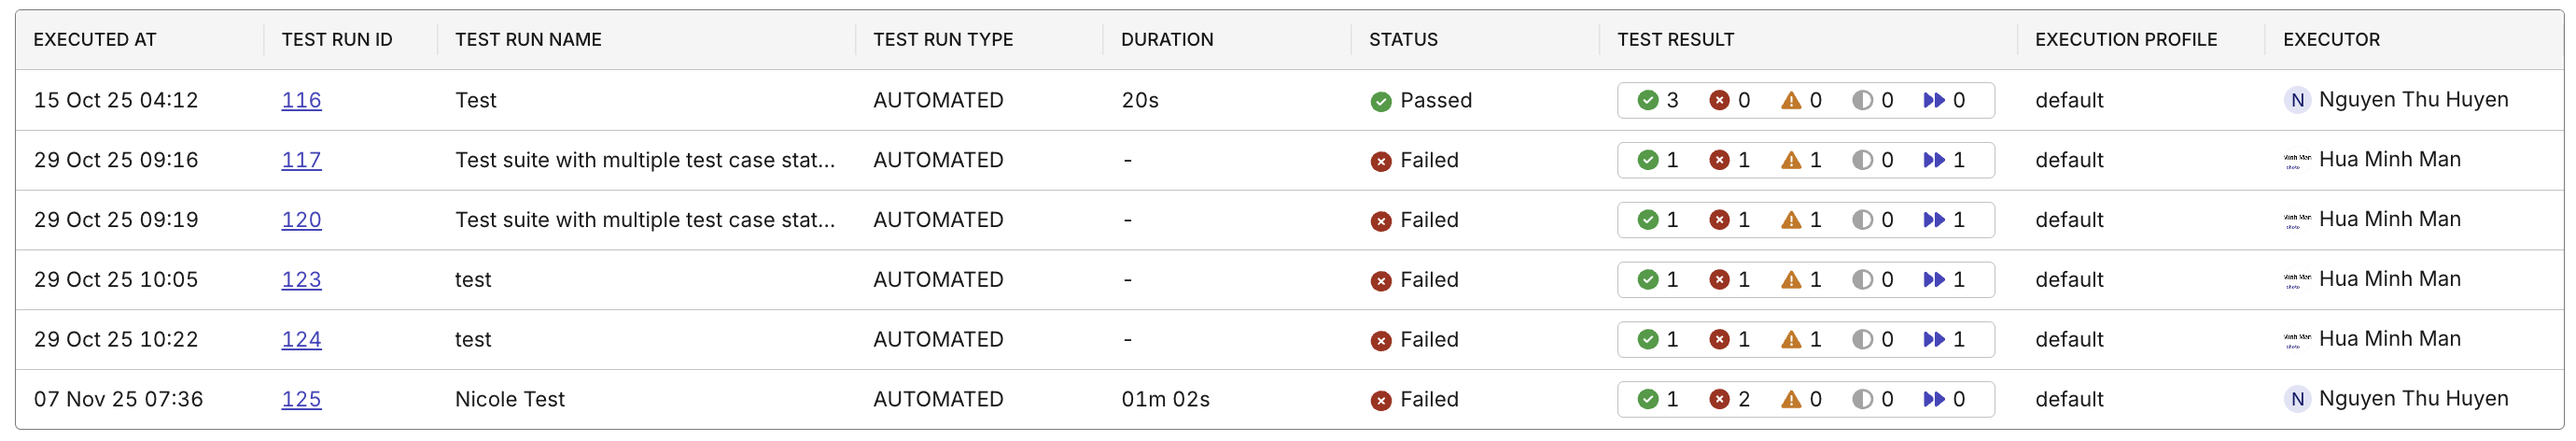
Interactive Data Table
- Displays detailed run-level information, including:
- Timestamp and run identifier
- Run type and duration
- Outcome status
- Inline result indicators (Passed / Failed / Warning / Skipped)
- Execution context (Profile, Executor)
- Sortable and filterable columns to aid detailed analysis.
- Supports export or integration with other analytics workflows.