Common Automation Errors Report
This document lists features of the Common Automation Errors Report.
The Common Automation Errors Report groups similar error messages to provide a consolidated view of your most frequent and impactful issues.
Tutorials:
Report Features
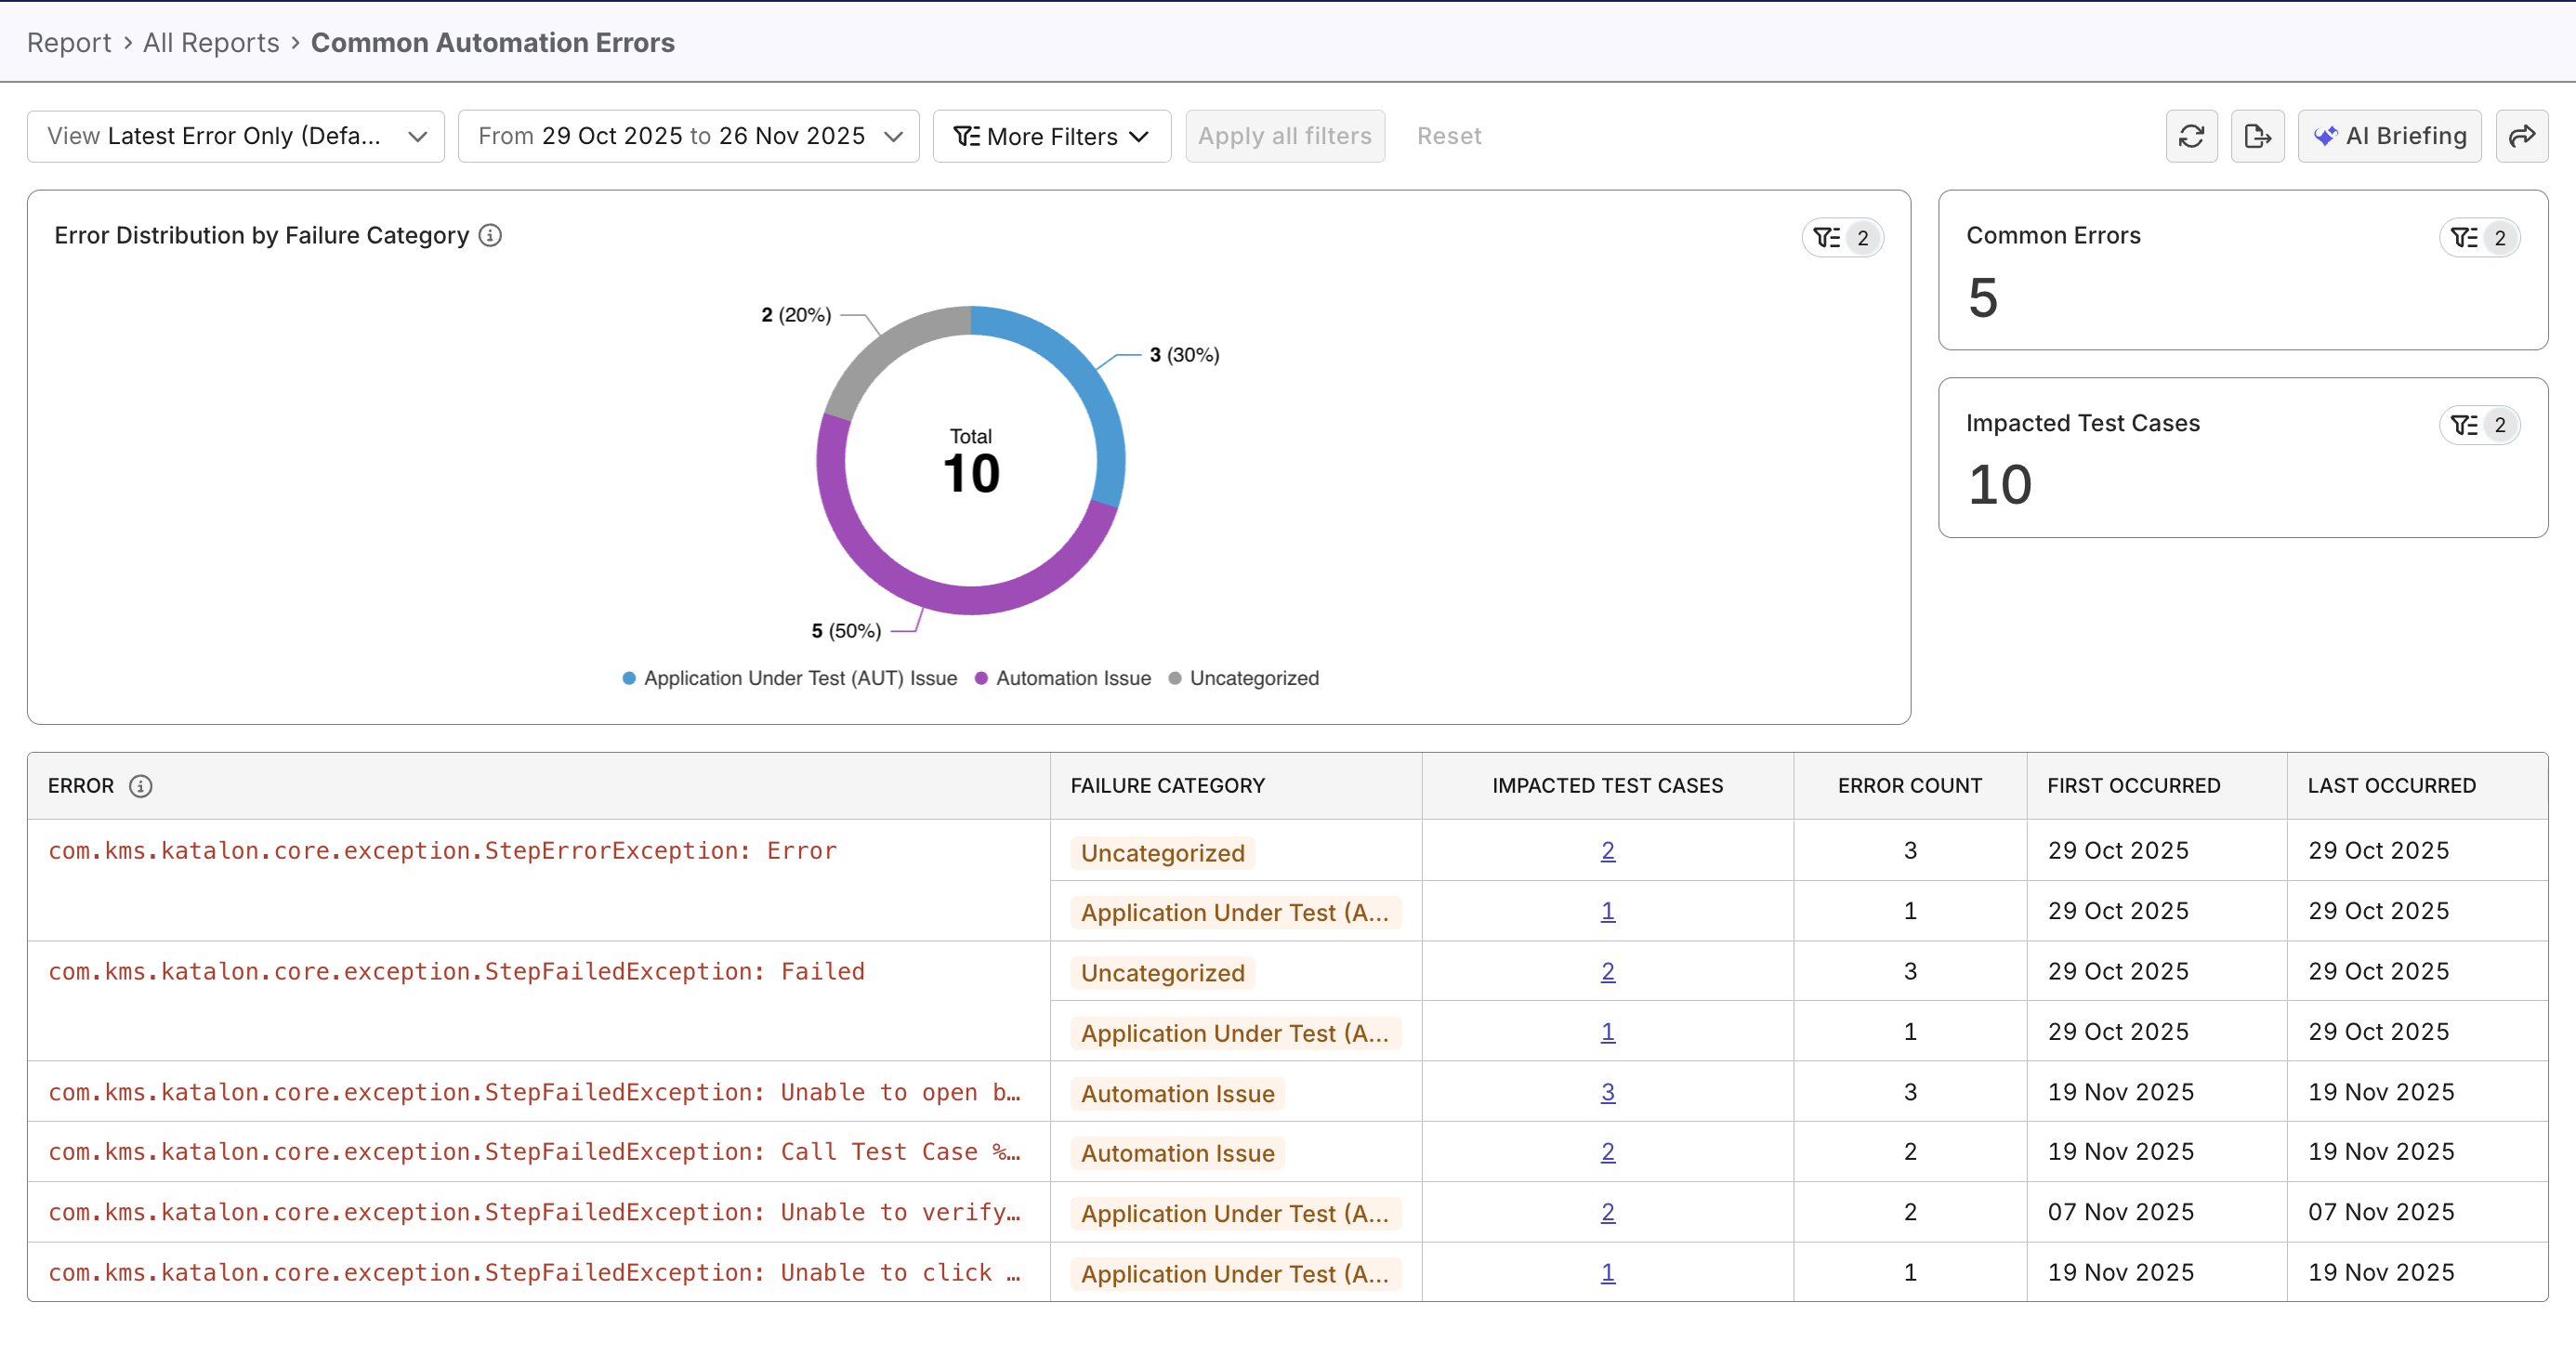
The Common Automation Errors Report consists of two main views, several supporting metrics, and a data table that link to each error.
Error View Modes
The report provides two complementary views to review automation errors, depending on whether you want to understand recent failures or the full historical pattern.
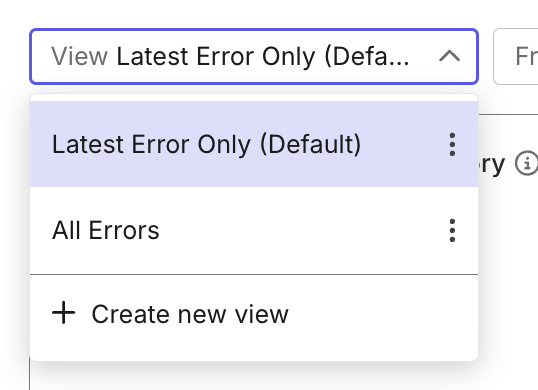
Latest Error Only (Default) view focuses on the most recent occurrence of each error. It helps teams quickly understand what is actively failing at the moment:
- Shows one latest instance per grouped error.
- The distribution chart and table automatically update to reflect only latest occurrences.
- The “Impacted Test Cases” count represents only the tests affected by the latest instance.
- Selecting an error allows you to inspect the most recent failed run and its details.
All Errors view displays all appearances of each error in test cases/runs, across the selected date range or sprint/release. This view is ideal when you need to understand recurring issues, scope of impact for each issue, or assess overall automation stability.
- Includes both current and historical occurrences. Data of the whole report changes accordingly.
- Selecting an error allows you to inspect the Test Result Analysis report filtered by the error, with trend and distribution charts for the selected error. This report provides a high-level view of all impacted test cases, and a data table with link to each test case/run if you want to investigate further.
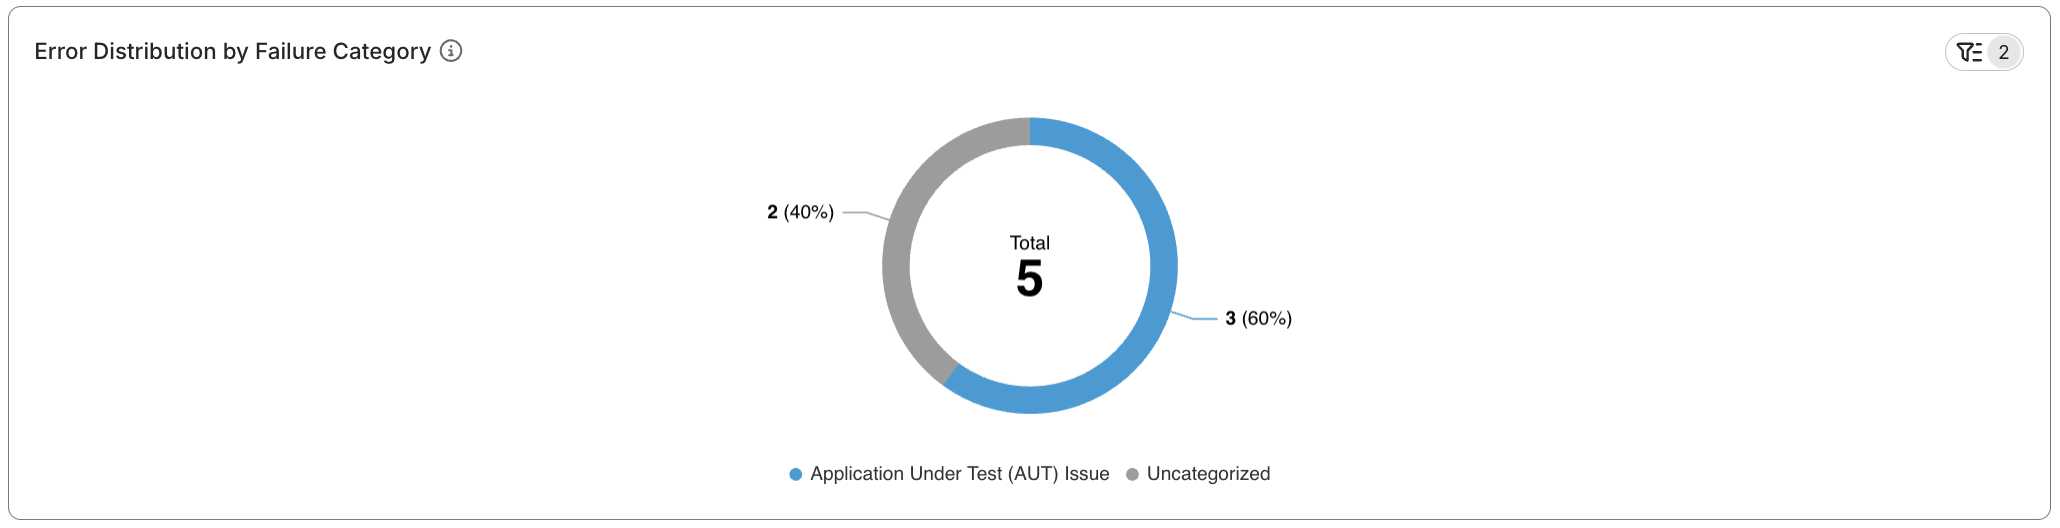
Error Distribution by Failure Category
This pie chart shows the breakdown of failure types (Environment, AUT Issue, Test Script, etc.) across all test results. It helps you quickly spot dominant failure patterns (e.g., environment errors vs. script issues).
Common Error Data Table
This detailed, sortable table listing recurring errors with occurrence counts, number of affected test cases, and sample messages. It enables you to drill into critical error patterns. You can click on the impacted test cases to view details.
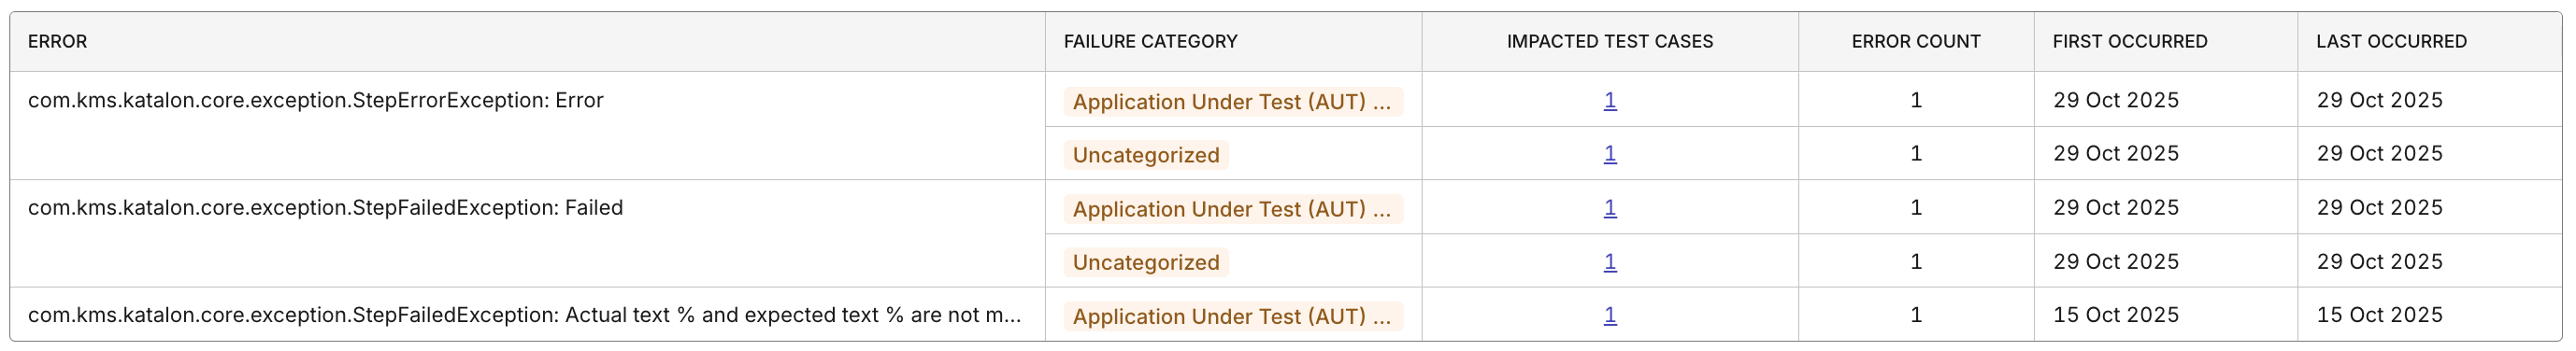
Failure Categories
Each error in the table is now labeled with a Failure Category. Categories help you quickly understand the nature of recurring problems without reading through long error messages.
Failure categories include:
- Application Under Test (AUT) Issue – Functional or UI issues in the application under testing (AUT).
- Test Script Issue – Errors in the test script such as runtime errors, element not found, wait issues, or assertion failures.
- Test Data Issue – Incorrect, missing, outdated, or invalid data used during execution.
- Automation Issue – Problems in the automation framework, libraries, or tooling.
- Integration Issue – Failures caused by components or systems not working together correctly.
- Configuration Issue – Incorrect setup of tools, browser versions, or execution parameters.
- Environment Issue – Instability or unavailability of test environments, servers, networks, databases, or third-party services.
- Others – Unspecified issues, to be investigated further.
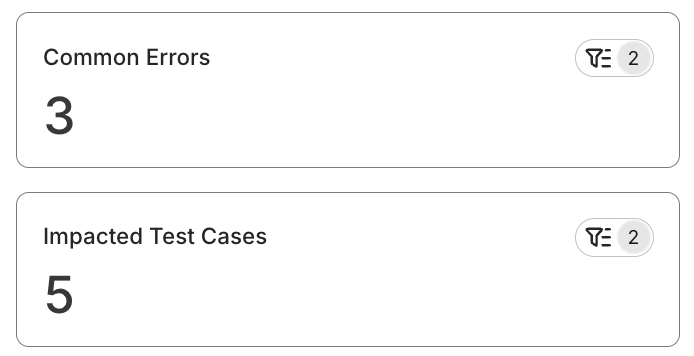
Impact metrics
The aggregated totals for each error type show how many tests and runs are affected. This reveals the severity and scale of each issue.
Advanced Filtering
The report includes several filters that let you isolate specific problem areas or release cycles.
Available filters:
- Failure Category
- Environment (Execution Profile)
- Test Suite / Test Suite Collection
- Time Range
The report uses Katalon True Platform’ internal error-pattern recognition system to automatically cluster similar failure messages into common error types.