Release Health Dashboard
This document explains what the Release Health Dashboard is, how to navigate it, and what its components are.
- Connect to an ALM tool (Jira, ADO) to sync your defects and view them in this dashboard.
- Configure requirement-test linkages to view requirement coverage in this dashboard.
Overview
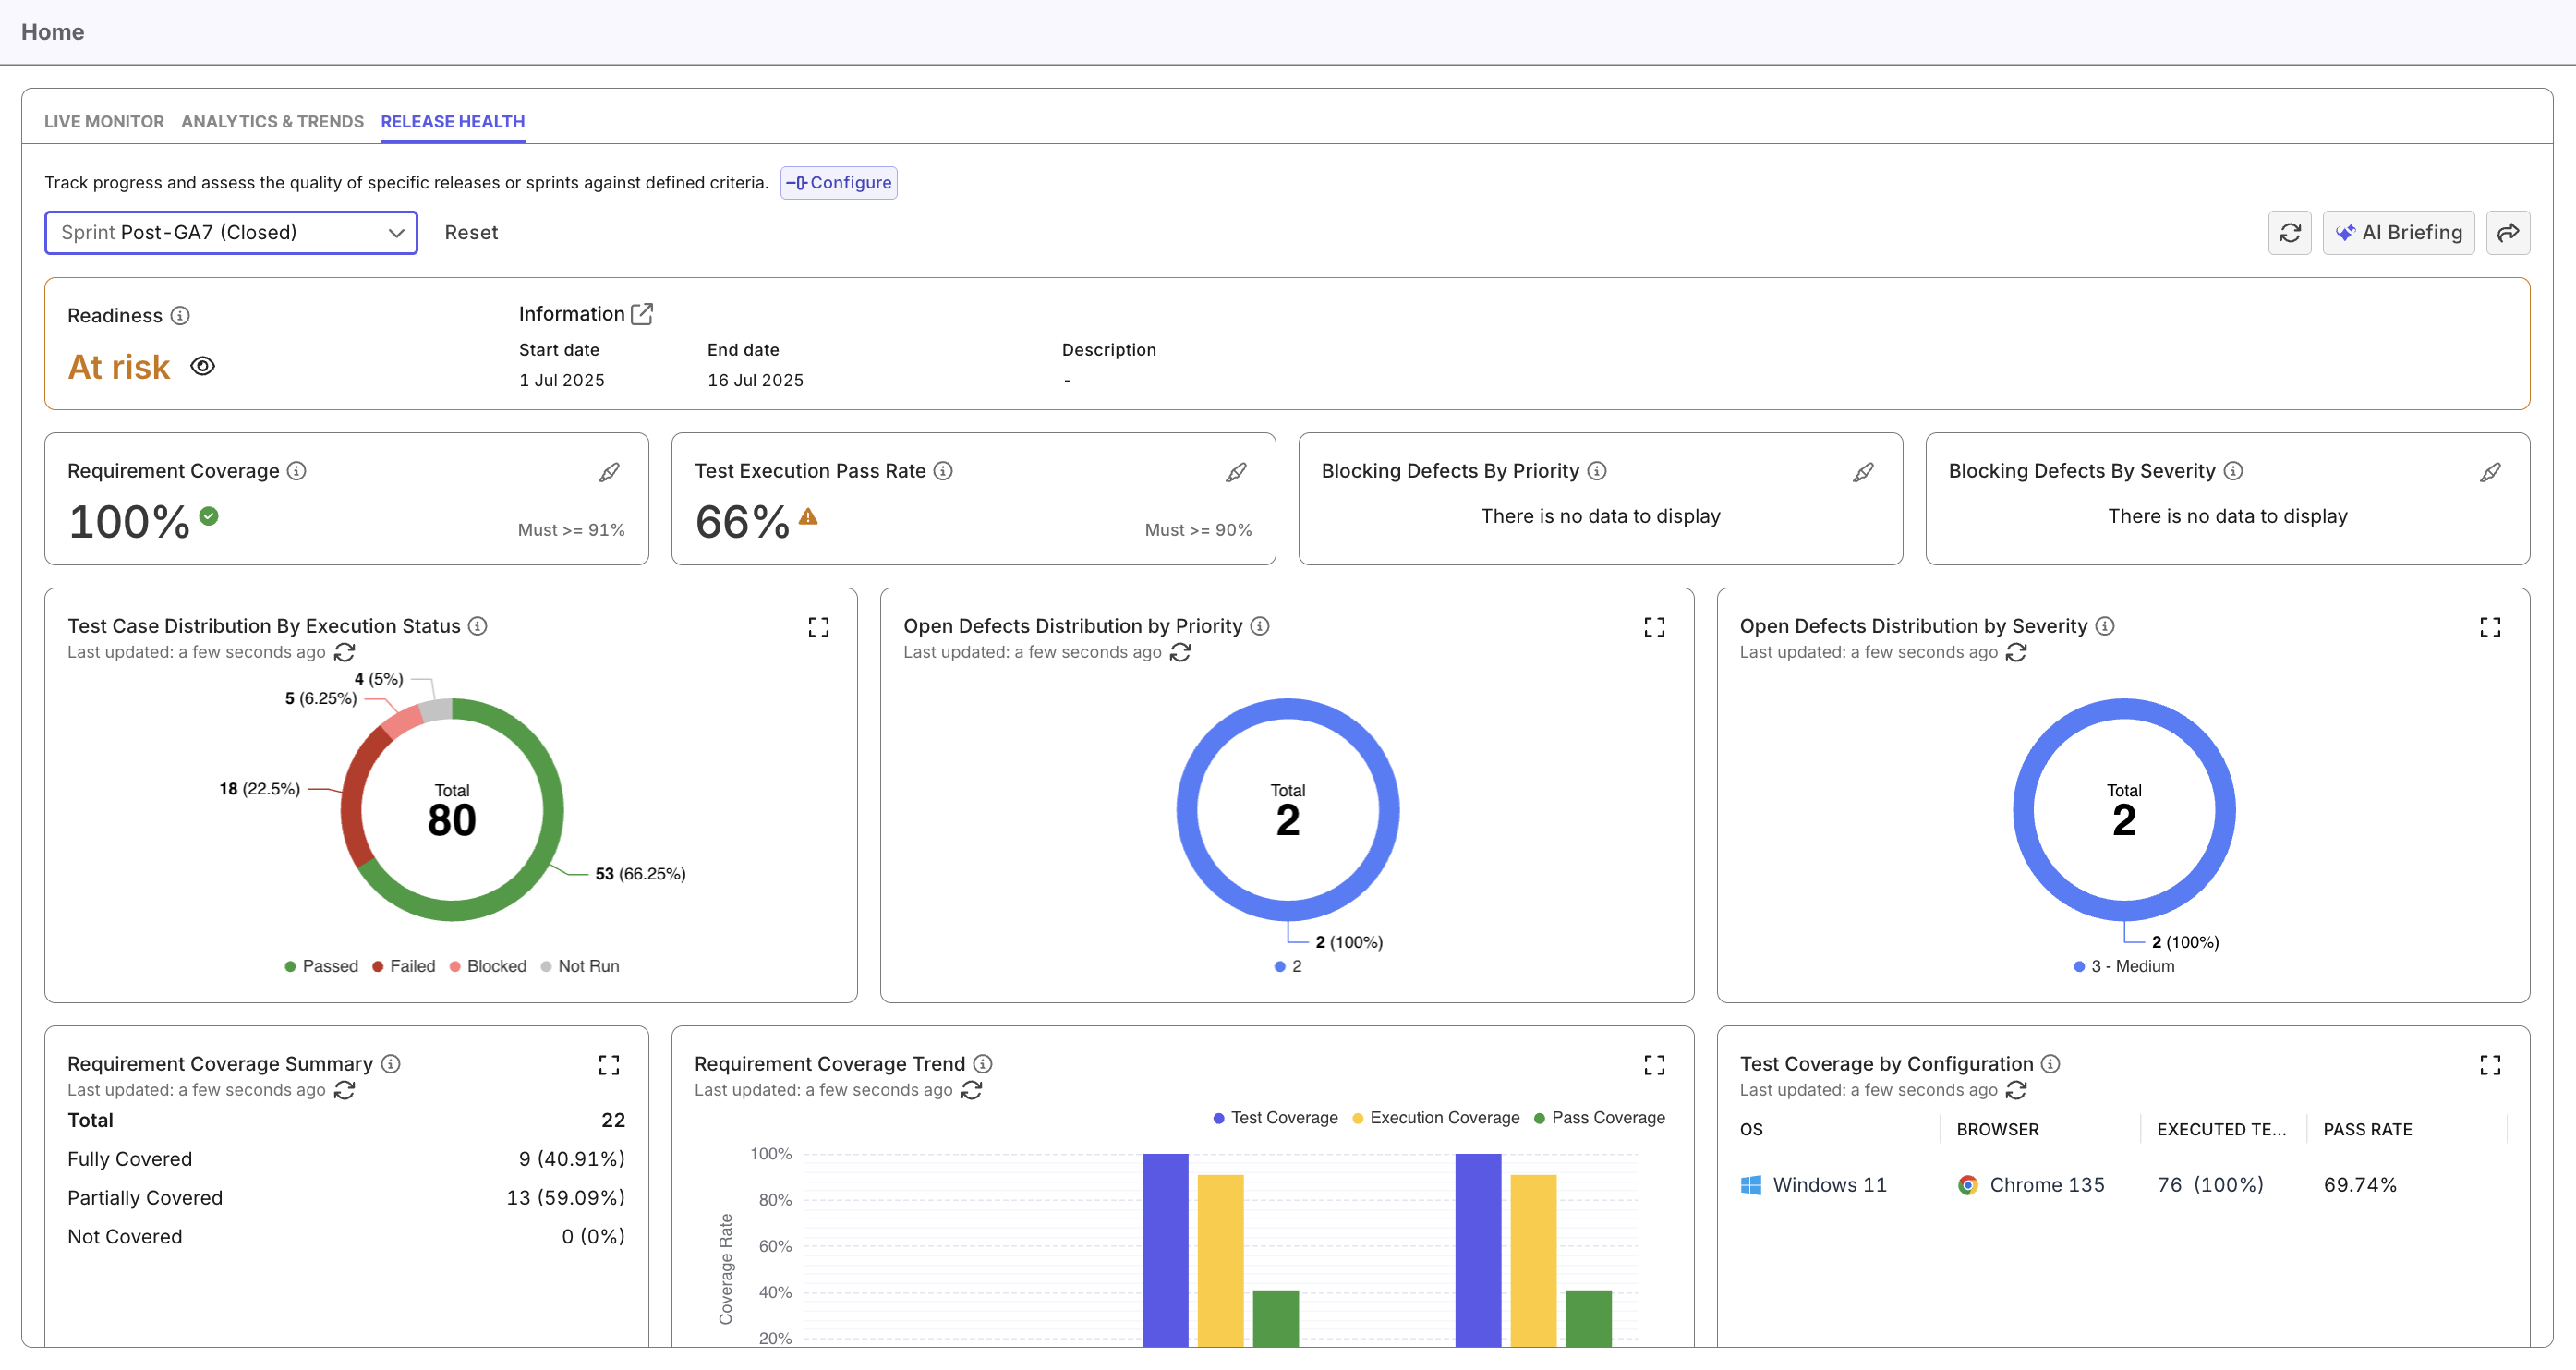
The Release Health Dashboard helps you evaluate the overall quality and readiness of your Sprint or Release. Instead of gathering data from multiple reports, this dashboard consolidates execution results, defect status, requirement coverage, and configuration coverage into a single, actionable view.
The dashboard also allows you to configure how readiness is automatically calculated using customizable quality thresholds.
Navigate the Release Health Dashboard
- Go to Home > Release Health.
- Select the Release or Sprint you want to assess from the dropdown.
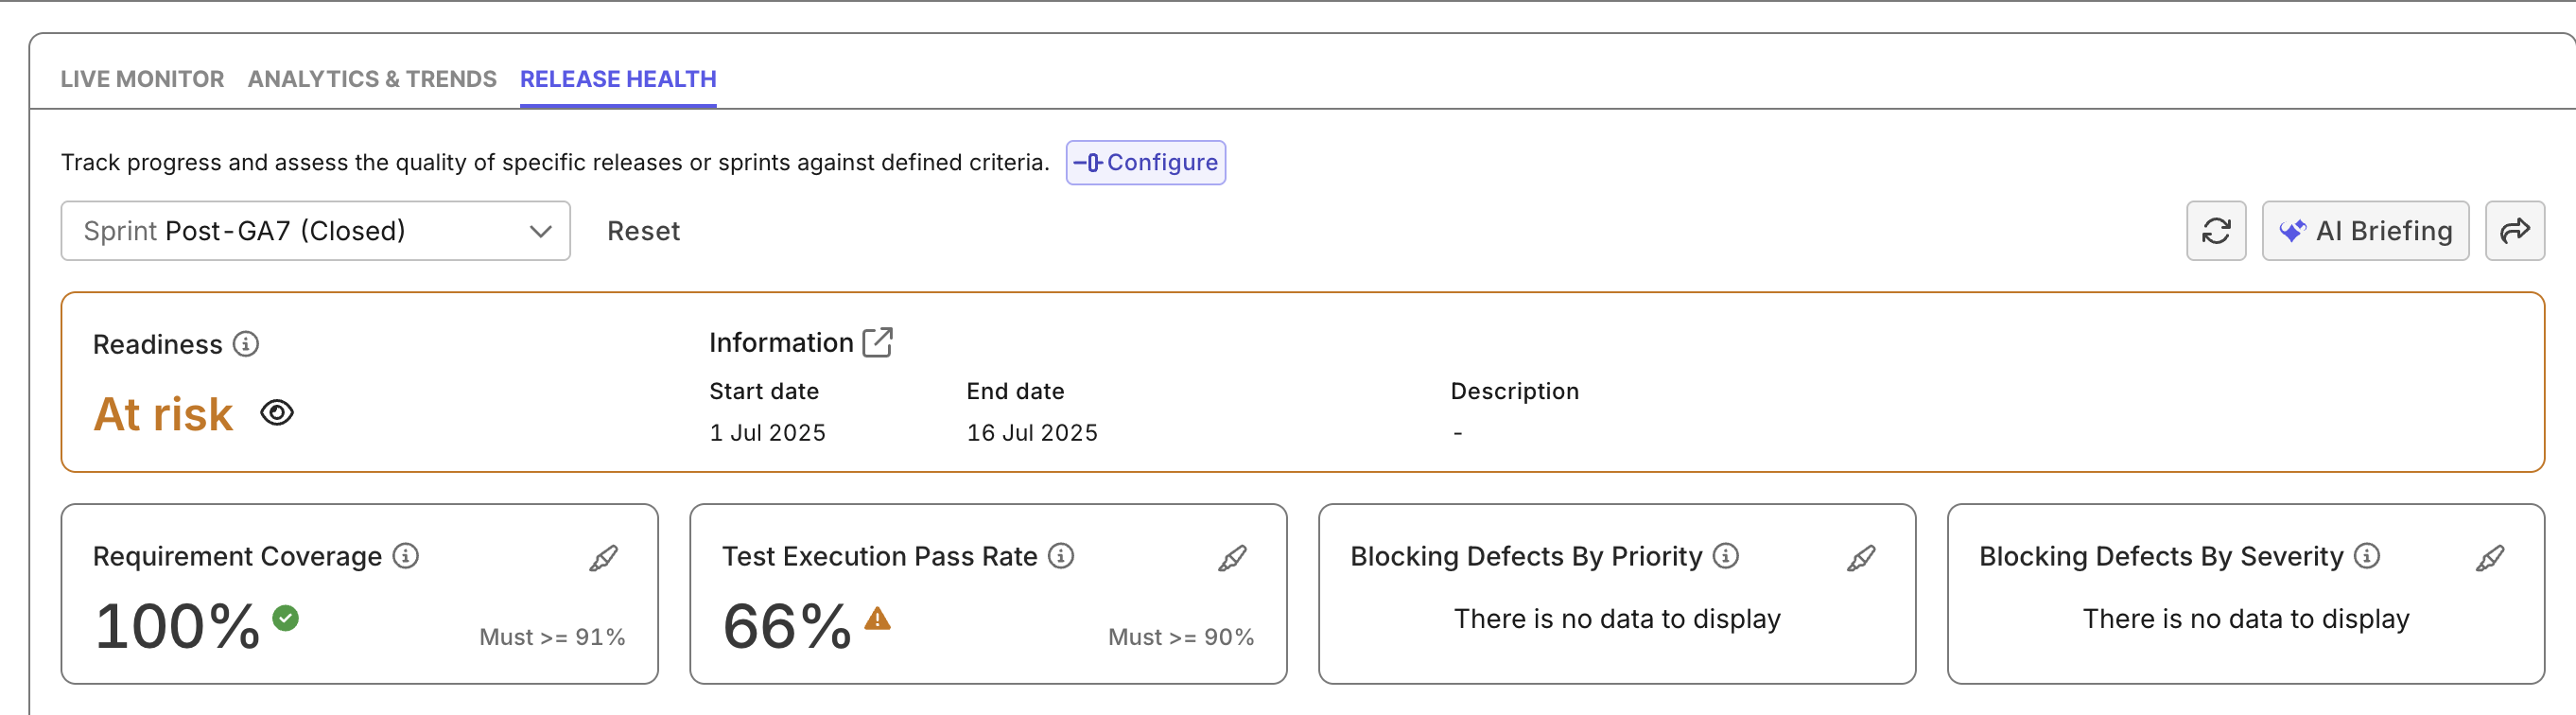
- At the top of the dashboard, you will see:
- Readiness status
- Start / End date of the iteration
- Description (if added in the Plan)
- A Configure button for managing Readiness Criteria. See Configure Readiness Criteria to learn more.
- Explore the key widgets, grouped by area:
- Key metrics:
Requirement Coverage, Test Execution Pass Rate, Blocking Defects by Priority, Blocking Defects by Severity - Test Case Distribution:
Test Case Distribution by Execution Status - Defect monitoring:
Open Defects Distribution by Priority and Severity - Requirements:
Requirement Coverage Summary and Requirement Coverage Trend - Platform coverage:
Test Coverage by Configuration
- Key metrics:
- For each widget, you can:
- Click the Expand icon ([ ]) to open the related detailed report
- Click the pencil icon on threshold-based metrics to highlight the widgets that impact that metric
Release Health Components
Below are the key components available in the Release Health Dashboard.
Release Readiness Metrics
The Release Readiness indicator provides an at-a-glance evaluation of whether your Release or Sprint meets all configured quality thresholds.
Color indicators:
- Ready (Green): All criteria met
- At Risk (Orange): One or more criteria fail
The readiness assessment is based on:
- Requirement Coverage
Percentage of requirements with linked test cases - Test Execution Pass Rate
Portion of executed tests that passed out of total planned tests - Blocking Defects by Priority
Unresolved defects matching configured priority levels - Blocking Defects by Severity
Unresolved defects matching configured severity levels
Defect priority/severity are Katalon True Platform's native terms, not your ALM tool's. Configure mapping between the terms when configuring your ALM tools.
Each criterion is marked Ready or At Risk depending on whether it meets the configured threshold.
Widgets
The widgets below provide detailed breakdowns of the release’s quality indicators and link to relevant reports for deeper investigation.
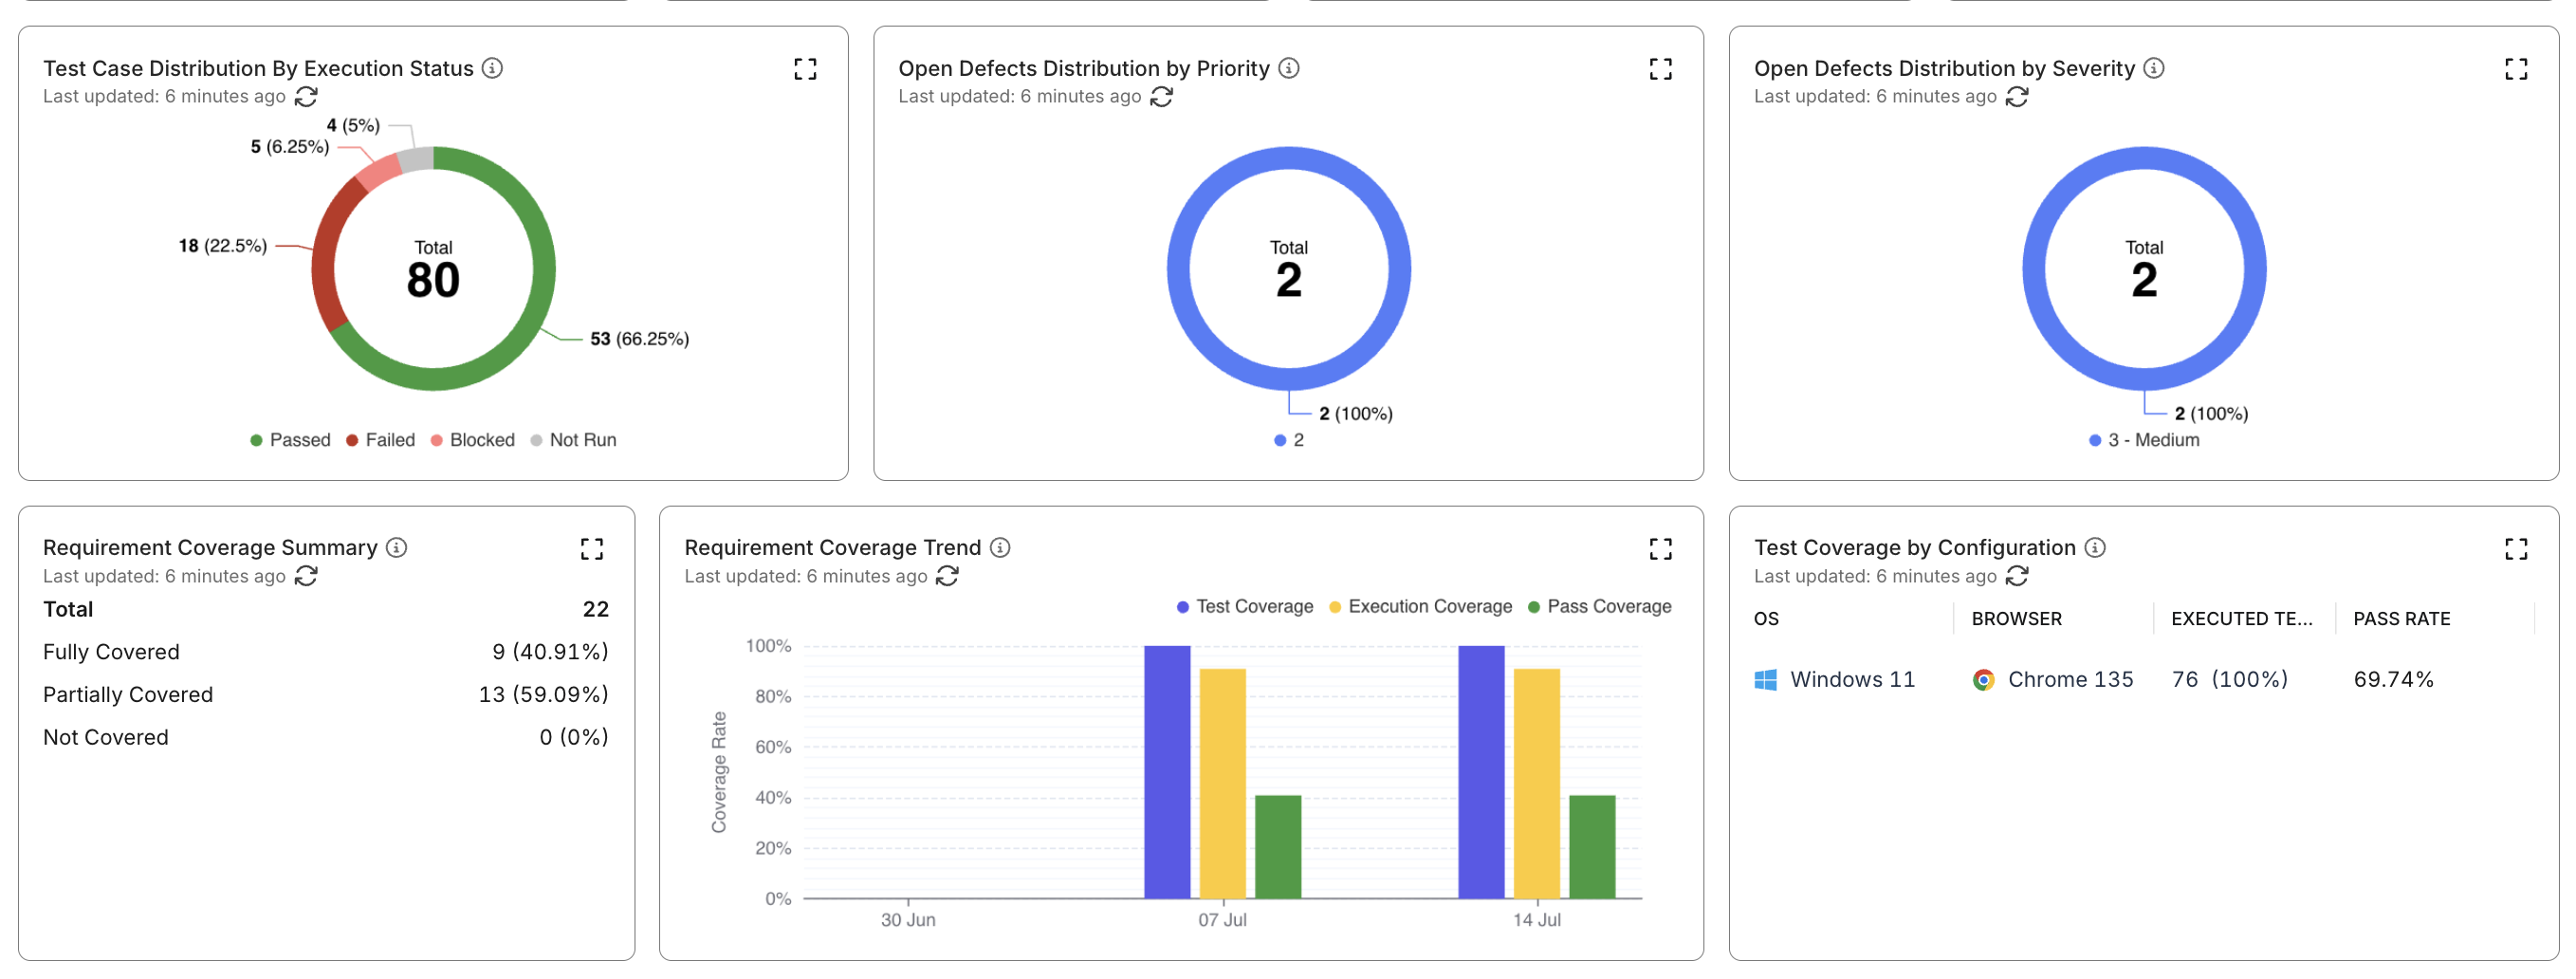
- Test Case Distribution by Execution Status
Groups test cases by latest execution result to help assess testing progress and risk. - Open Defects Distribution by Priority / Severity
Shows all unresolved defects grouped by priority and severity. - Requirement Coverage Summary
Categorizes requirements into:- Fully Covered: Linked tests published and passed
- Partially Covered: Linked tests exist but results vary
- Not Covered: No linked published test cases
- Requirement Coverage Trend
Visualizes weekly progress of test coverage, execution coverage, and pass coverage. - Test Coverage by Configuration
Displays execution distribution across operating systems, browsers, and devices.
All widgets support:
- Expand icon (↗) to open a related detailed report
- Pencil icons on metric widgets to highlight which widgets contribute to that metric