Defects Activity Analysis Report
The Defects Activity Analysis Report (formerly Total Defects During Period by Status) provides a clear, time-based view of defect creation, closure, and accumulation trends across a selected period.
It helps QA and development teams track defect dynamics, identify backlog growth, and evaluate resolution performance over time.

Why Use This Report
With this report, you can:
- Monitor how many defects are created, closed, and remain open within each time unit (x day, x week, etc.)
- Detect backlog growth and recurring quality issues early.
- Evaluate the team’s responsiveness to defect resolution.
- Support release readiness decisions through historical trend analysis.
The Defects Activity Analysis Report aims to provide a comprehensive, time-based view of defect creation, closure, and accumulation trends. Combining data and visuals, it helps QA teams prioritize fixes, monitor progress, and ensure quality alignment before each release.
Explore the Report
-
Open the report: Go to Reports > Defects Activity Analysis.
-
Select filters: Set Time Range (or Sprint) and choose Interval (Daily/Weekly/Monthly), then Apply.
-
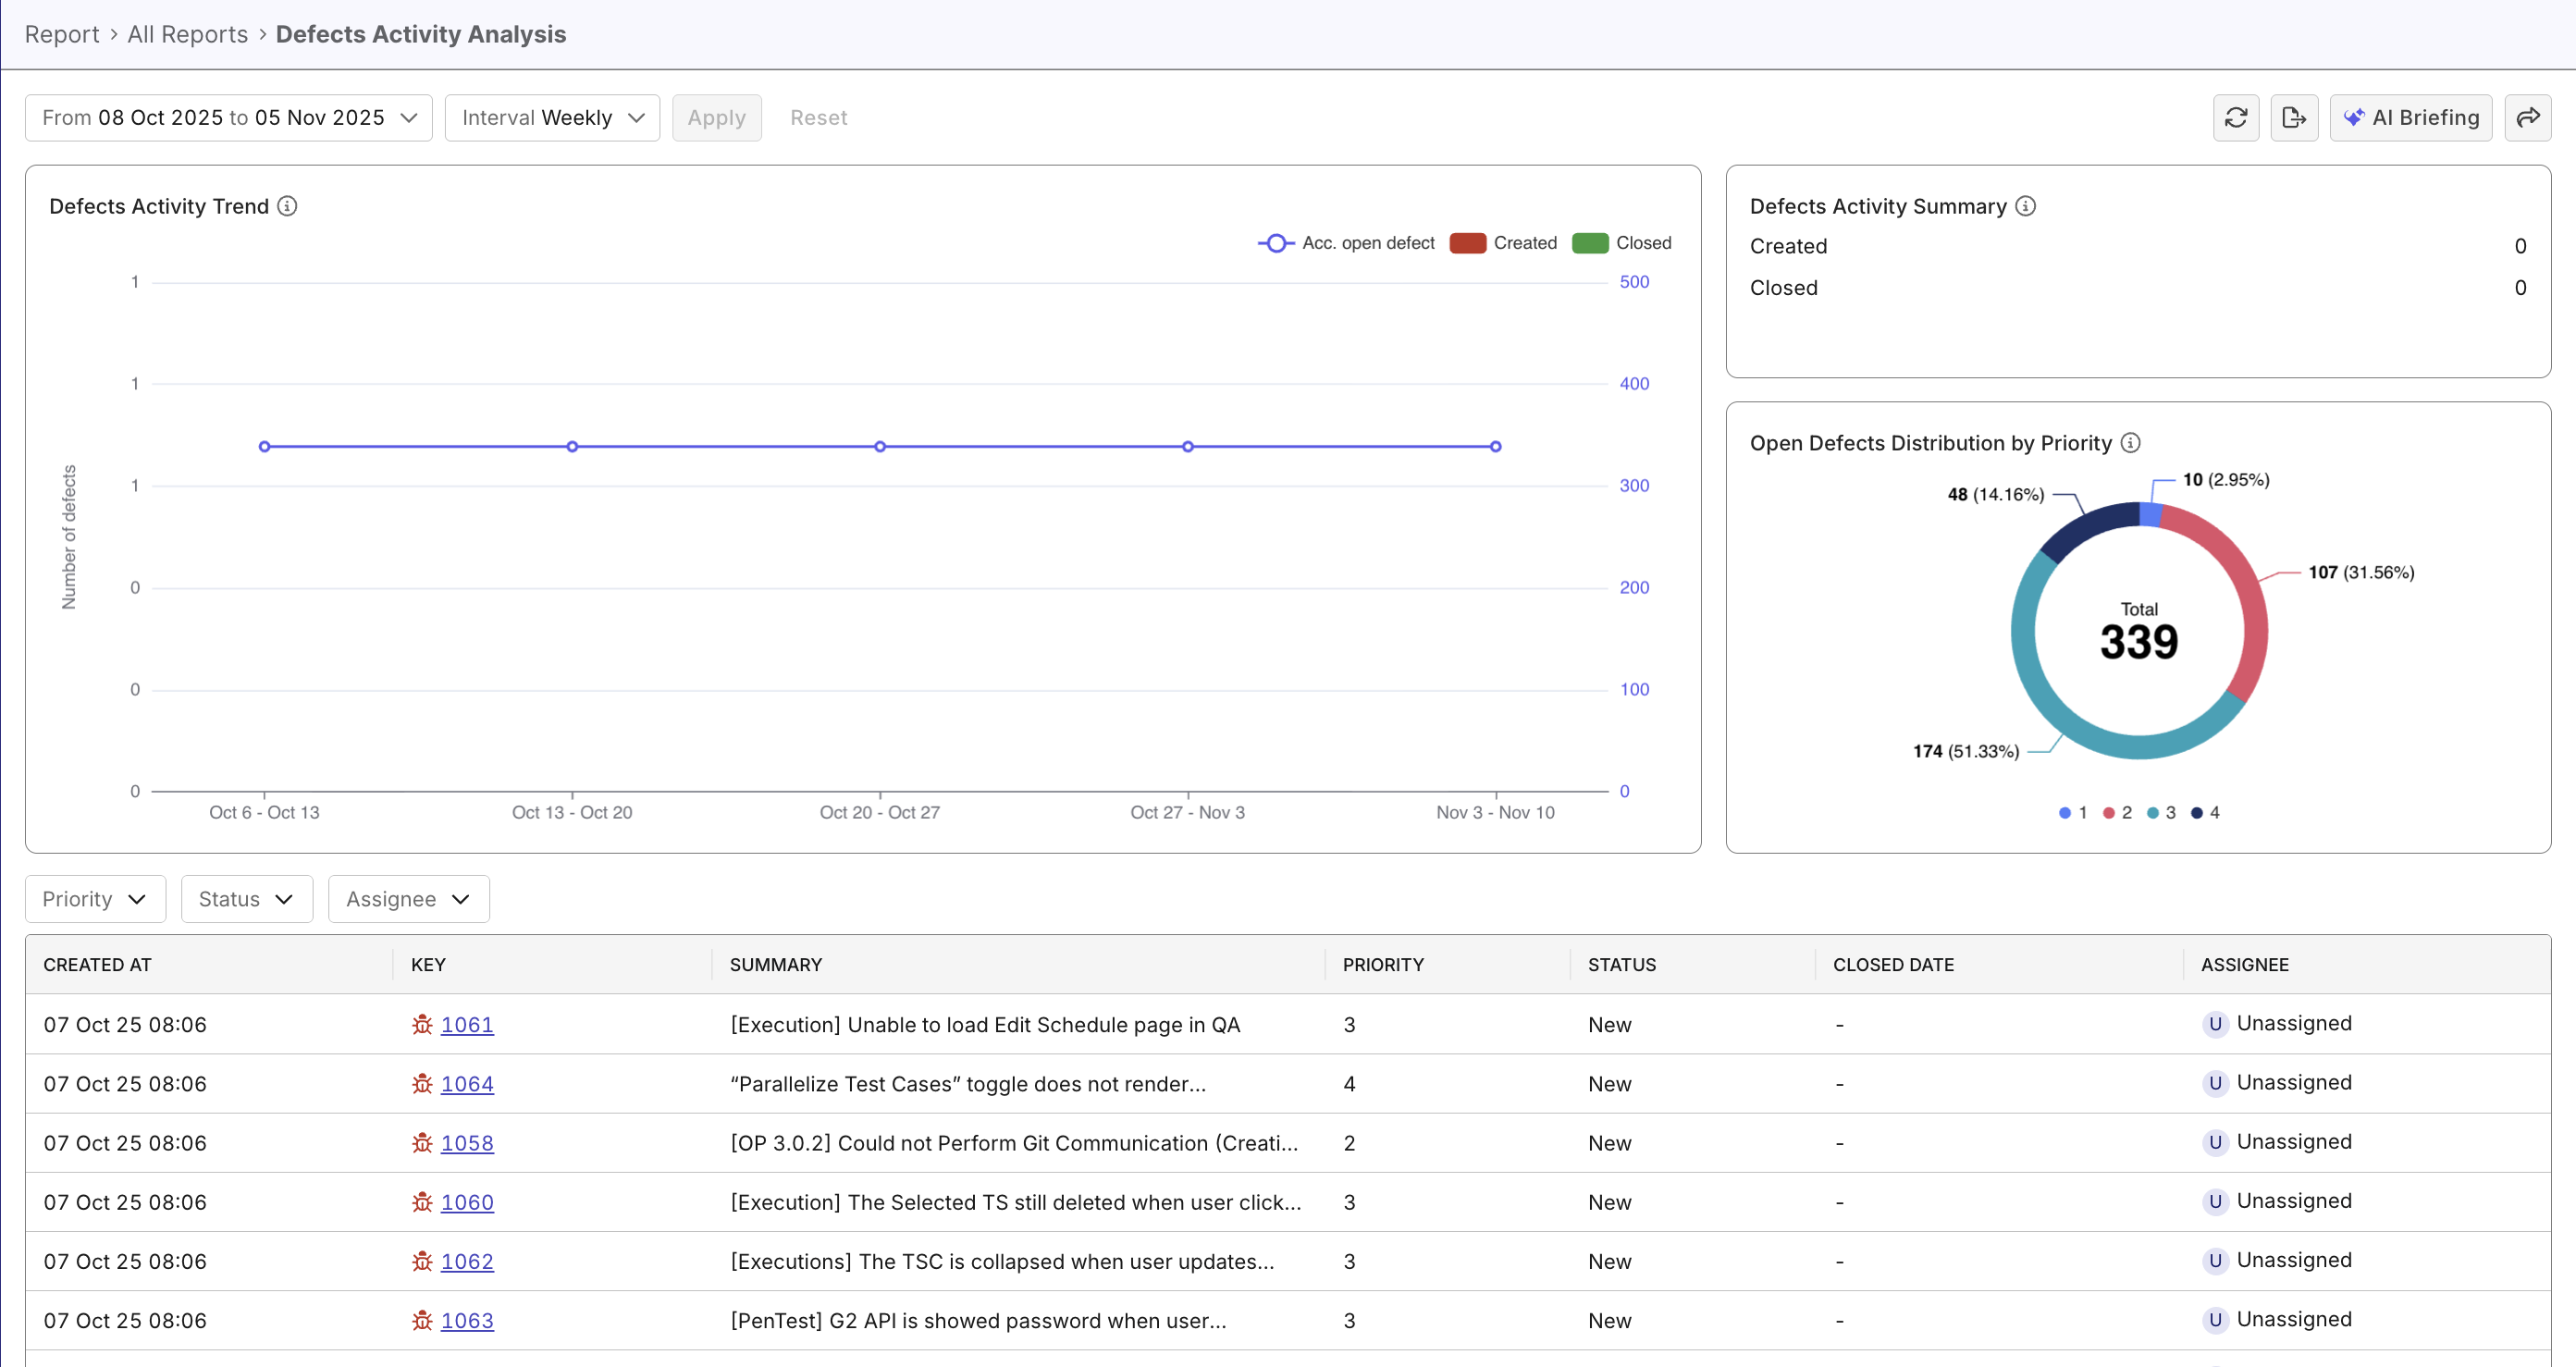
Review visuals: Check the Defects Activity Trend (created/closed vs. accumulated open), the summary metrics, and the priority distribution chart.
-
Drill into details: Hover or click a bar/slice to filter; review the defect table below for Created At, Key, Summary, Priority, Status, Closed Date, and Assignee.
-
Focus analysis: Filter by Priority/Status/Assignee and sort by Created At or Priority to surface what needs attention first.
-
Interpret patterns: Use the trend to spot backlog growth or improving closure.
-
Take action: Click a defect Key to open details, assign owners, or escalate critical items.
Report Features
The Defects Activity Analysis Report includes multiple visual components and metrics to help you analyze defect trends comprehensively.
Main Chart – Created, Closed, and Open Trends
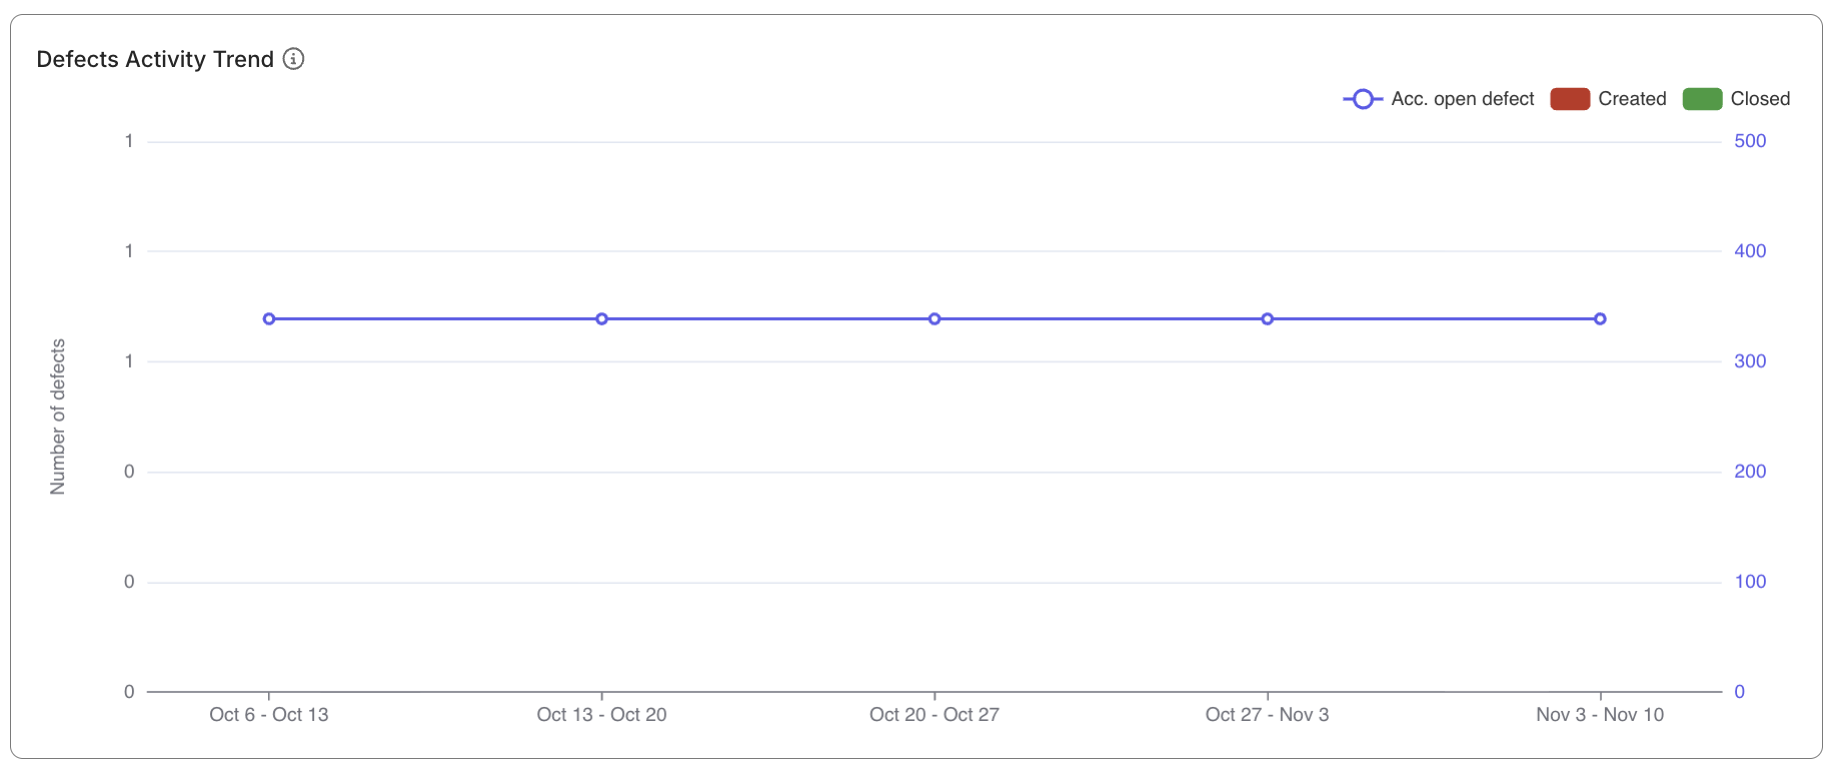
A hybrid stacked bar and line chart that visualizes:
- Created defects during each time period (bars).
- Closed defects within the same period (bars).
- Accumulated open defects over time (trendline).
This visualization helps detect whether defects are being resolved as quickly as they are created.

Defects Activity Summary
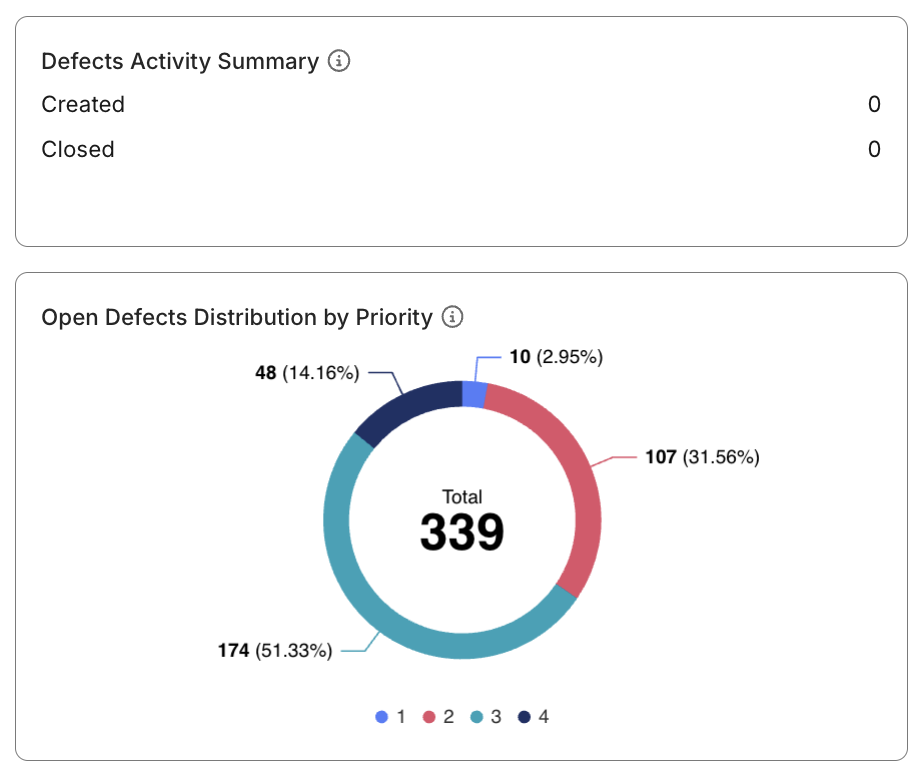
A set of snapshot metrics summarizing total created and closed defects for the selected period.
These KPIs provide an at-a-glance view of current defect handling performance.
Defect Distribution by Priority (Pie Chart)
Displays the proportion of defects by priority level (P1–P3). This chart helps highlight the concentration of critical or high-severity issues.

Defect Drill-down Table
A detailed table listing all defect records that appear in the visualizations.
Each entry includes key fields such as:
- Created At
- Key (Defect ID)
- Summary
- Priority
- Status
- Closed Date
- Assignee
You can click on any Defect Key to open details, assign owners, or escalate critical items.

Reference – Definitions
Metrics and Calculations
| Metric | Definition | Calculation |
|---|---|---|
| Created | Number of defects created during the selected time period. | Count where CREATED_AT ∈ Time Range |
| Closed | Number of defects resolved during the selected time period. | Count where RESOLVED_AT ∈ Time Range |
| Accumulated Open | Active unresolved defects carried over time. | Created − Closed (carried over) |
- Trendline: Shows total accumulated open defects over time.
- Stacked Bars: Represent created and closed defects per interval.
Data Eligibility Rules
To ensure data accuracy, the report includes only eligible defect records:
- Defects originate from ALM integrations such as Jira or Azure DevOps.
- Only defects successfully synced to the TestOps database are counted.
- Defects must be:
- Created or resolved within the selected time range, or
- Still unresolved (
RESOLVED_AT = null).
💡 For best results, ensure your ALM integrations are active and regularly synced with TestOps.