Configuration Coverage Report
This document explains how to use the Configuration Coverage During Period report to analyze your project’s test coverage across operating systems and browsers.

With this report, QA teams can quickly visualize configuration coverage trends and spot coverage gaps to make informed decisions about where to focus additional testings.
Why Use This Report
- Track test coverage trends across different OS and browser configurations.
- Interactive charts for quick filtering and summary statistics.
- Identify top and low-performing configurations, helping allocate testing resources effectively.
- Correlate execution outcomes (pass/fail) with specific configurations to assess reliability.
Explore the Report
- Go to Reports → All Reports and select Configuration Coverage During Period.
- Set Filters
- Select a Time Range, Sprint, or Release.
- Choose other filters if you wish: Execution Type (e.g., manual, automated) and Group By (e.g. OS Name, Browser Name, or combined OS & Browser).
- Click Apply to update report view with new filters. You can Reset to return to default settings.
- Interpret the Main Charts
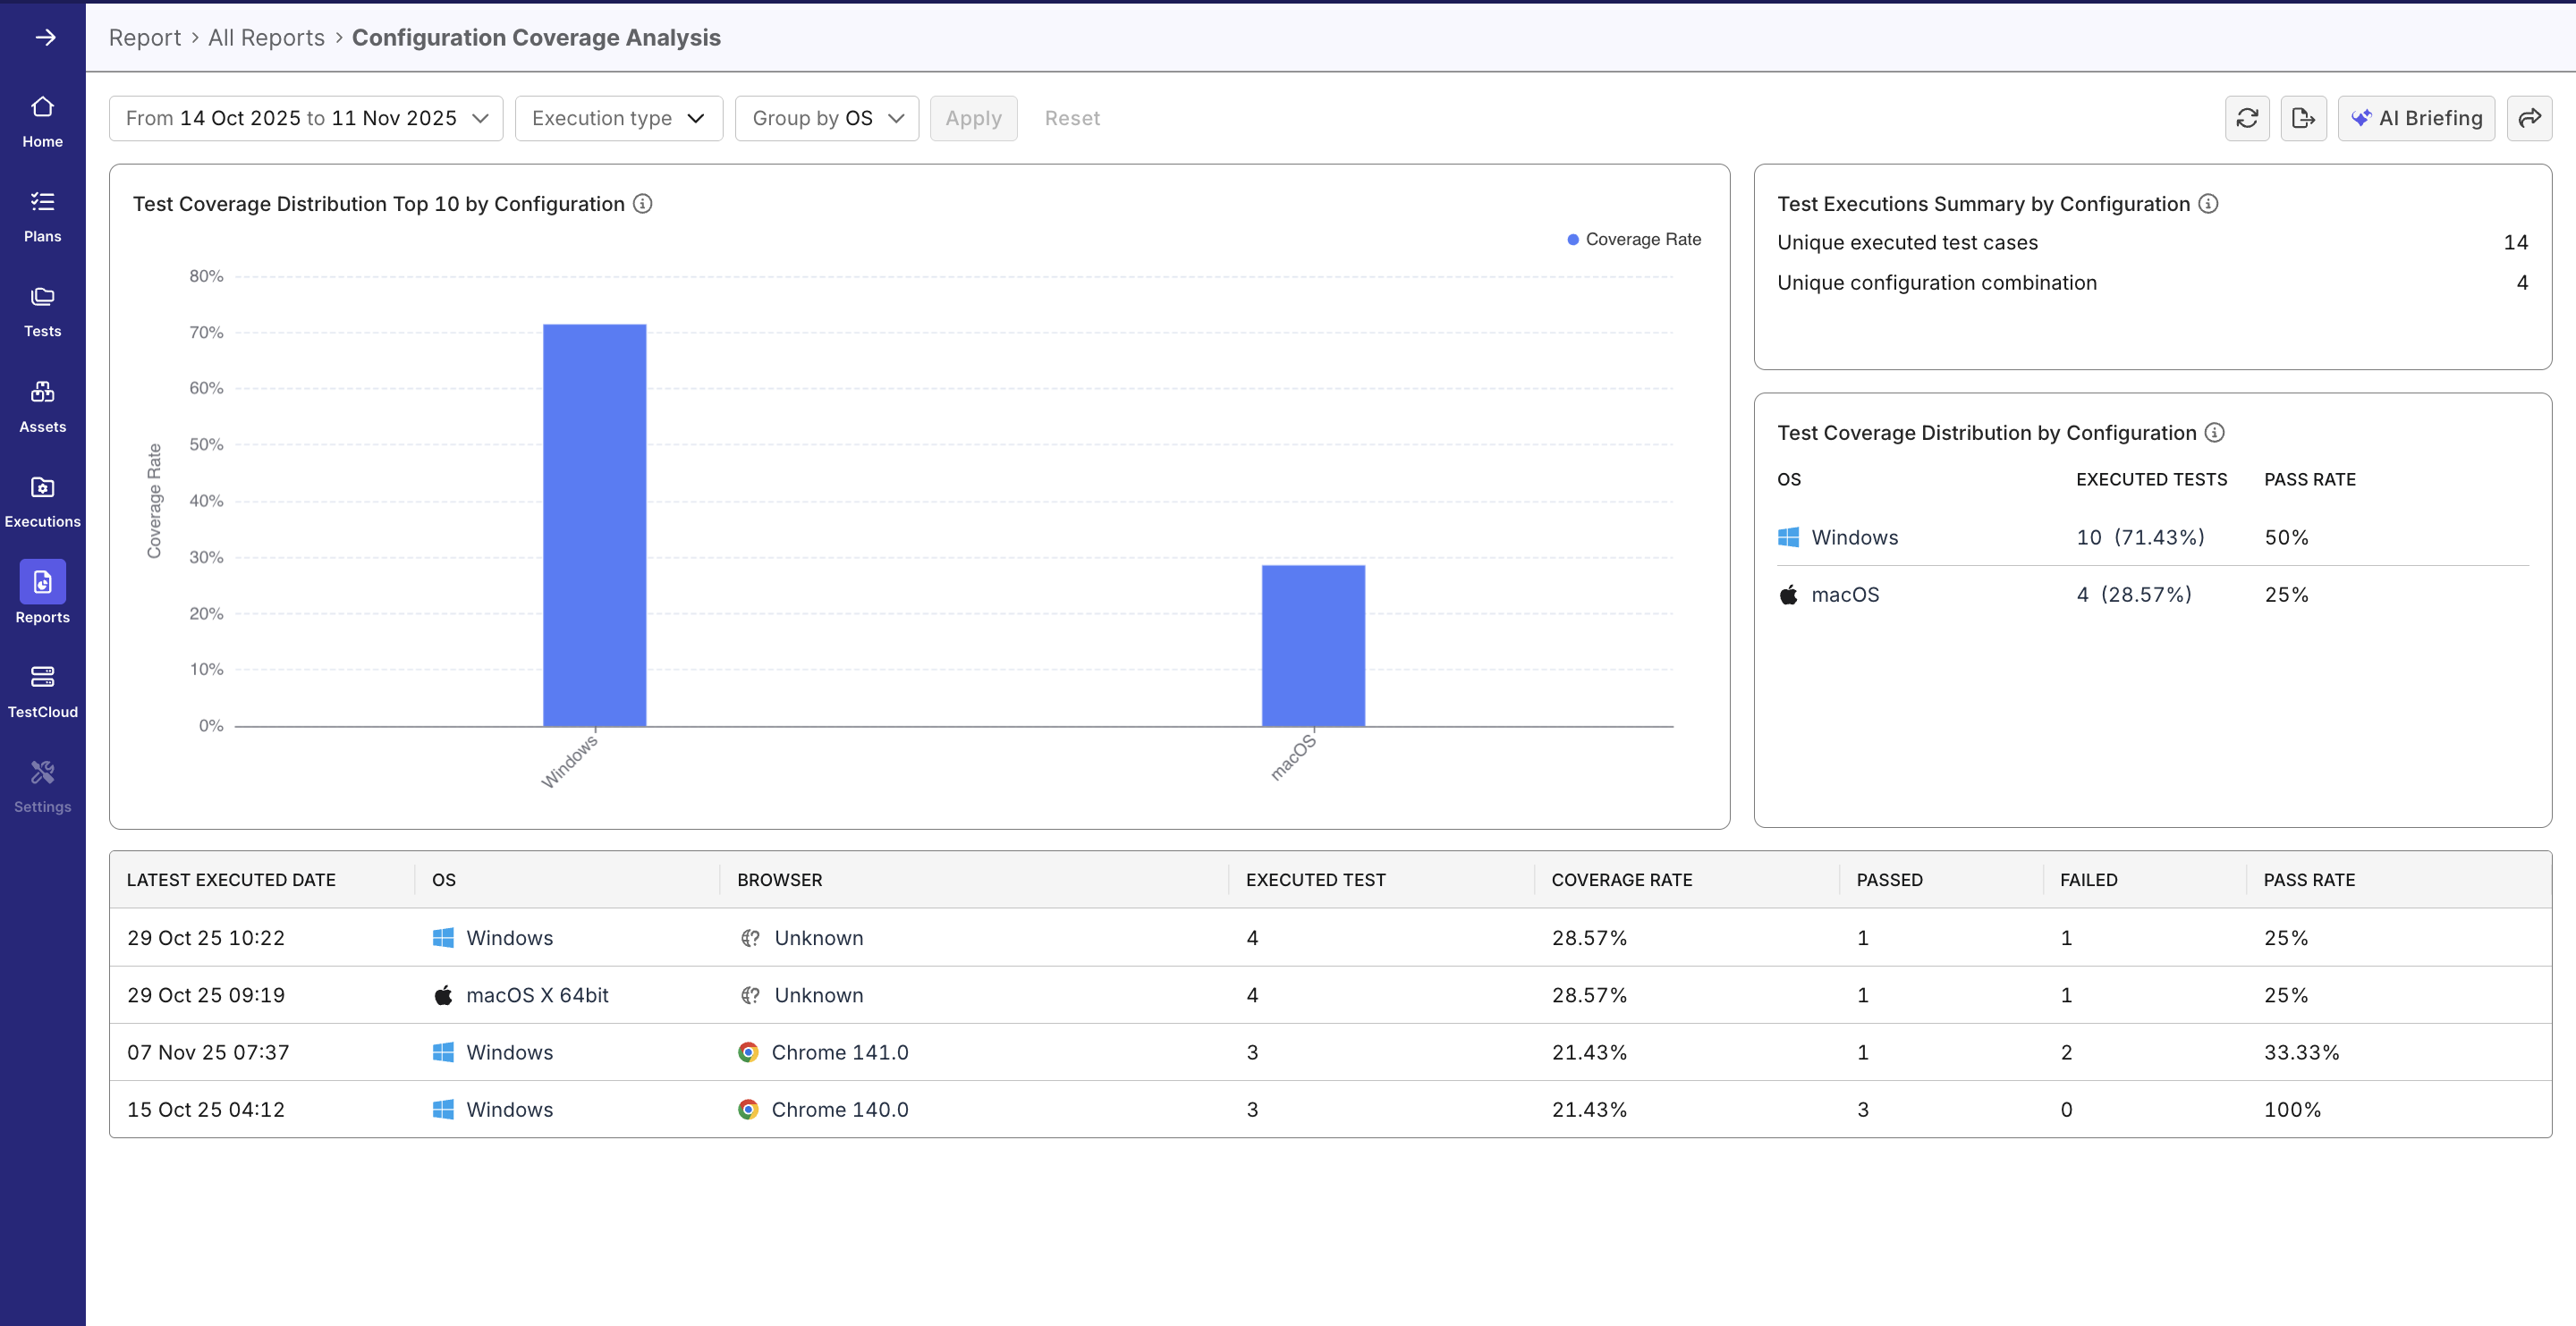
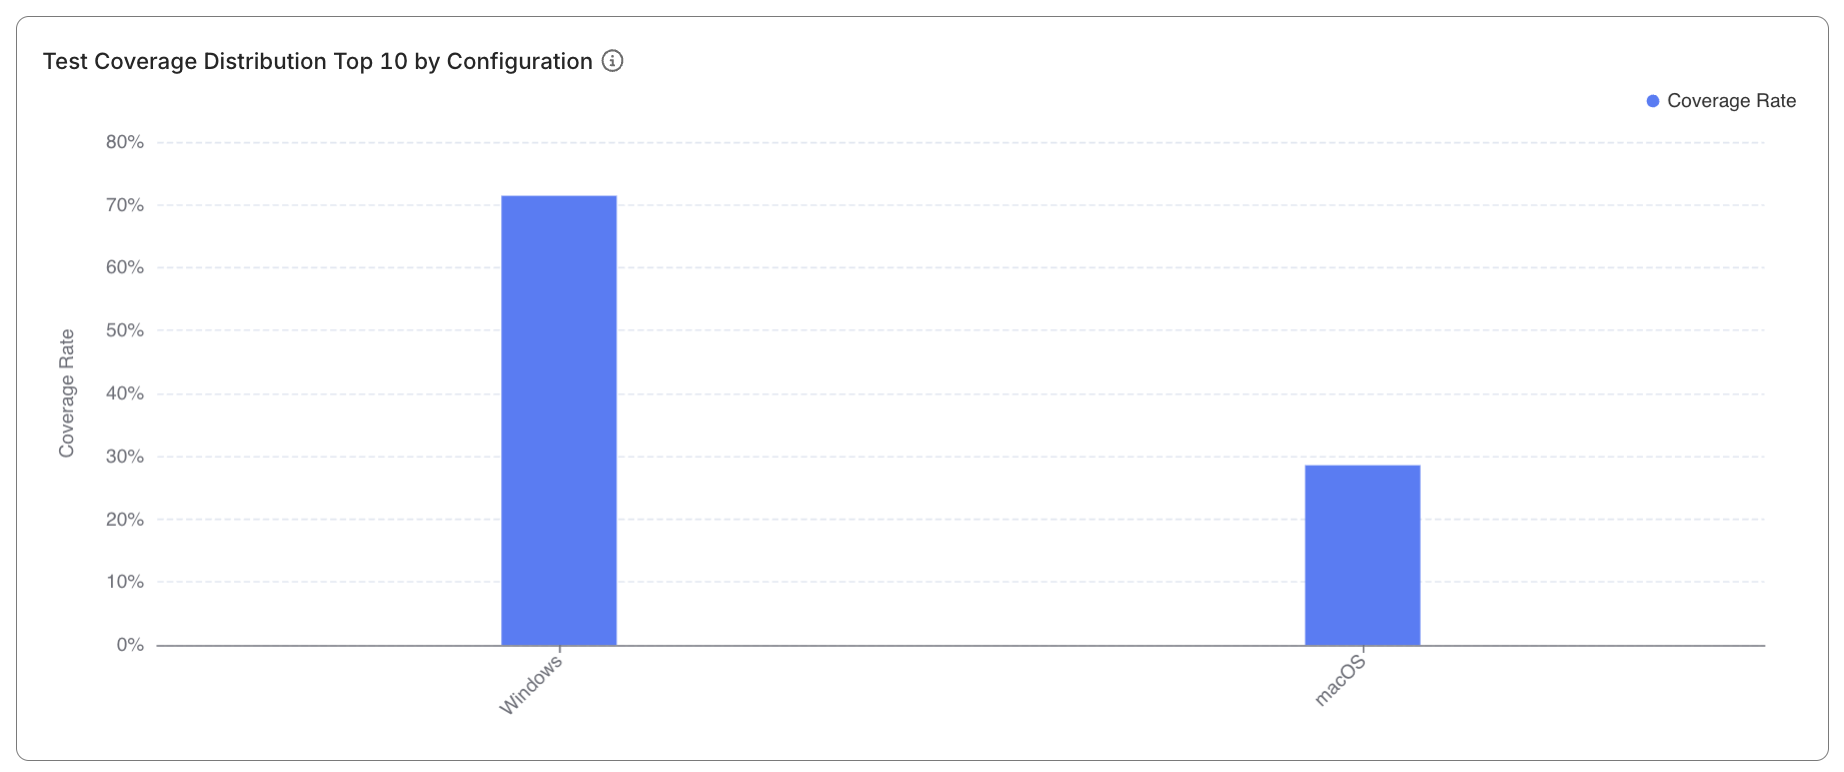
- Review the Top Configuration Chart to see coverage rates by platform.
- Examine summary metrics for unique test cases and unique configurations executed.
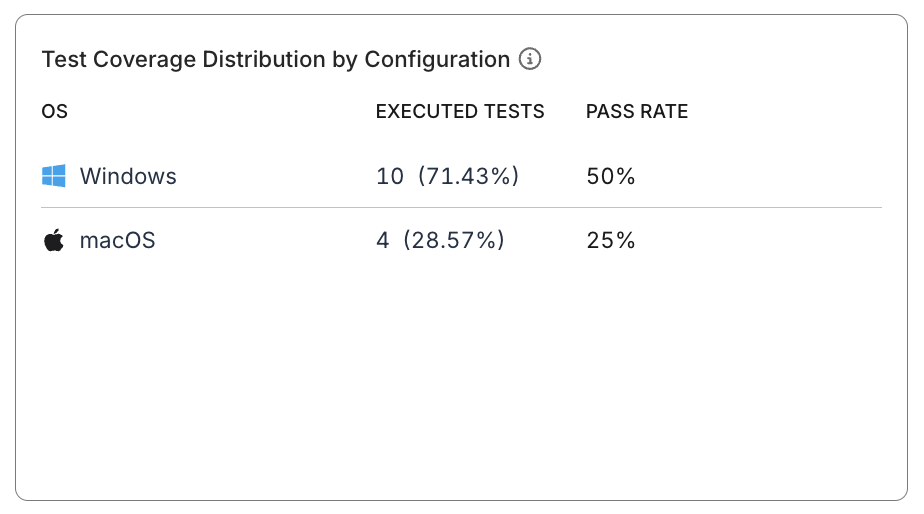
- Use the Top Coverage list to find OS/browser combinations with the highest test coverage.
- Explore the Data Table
- Scroll to view test execution data, including pass/fail counts, pass rate, and coverage rate.
- Sort and filter data by execution date, OS, or browser.
- Hover over columns for percentage details; click a column to drill down into the filtered data table.
Report Features
Dynamic Filters
- Filters allow you to refine report data by time range (or release/sprint), execution type, and grouping criteria.
- Default grouping is by OS Name, but you can switch to Browser Name or OS & Browser for deeper analysis.
Top Configuration Chart (Visualization)
- Displays a bar chart, with each bar representing a configuration’s coverage percentage.
- Maximum of 15 configurations shown, sorted by coverage in descending order.
- Hovering on each bar reveals configuration names and percentages; clicking filters the data table below.

Statistics Summary Panel
- Shows aggregate counts of unique executed test cases and unique configuration combinations (UCC) in the selected period.
- Provides a quick snapshot of test breadth across environments.

Top Coverage Section
- Ranks UCC by coverage rate.
- Paginated, displaying 8 entries per page.

Detailed Data Table
- Presents sortable and filterable records with the following columns:
- Lastest executed date
- OS (icon & name)
- Browser (icon & name). Undetectable browser is labeled "Unknown".
- Executed test cases
- Number of Passed/Failed test cases and calculated pass rate
- Coverage Rate
- By default, data is sorted by Coverage Rate (Descending).

Coverage Calculation Rules:
                 Executed Unique Test Cases per UCC (OS + Browser)
Coverage Rate = ------------------------------------------------------------- × 100%
                                  Total Unique Test Cases
            Passed Unique Executed Test Cases per UCC (OS + Browser)
Pass Rate = --------------------------------------------------------- × 100%
             Total Unique Executed Test Cases per UCC (OS + Browser)