Requirement Coverage Analysis Report
Last updated: April 2026
This document lists features of the Requirement Coverage Analysis Report.
requirements
Configure requirement-test linkages to view requirement coverage in this report.
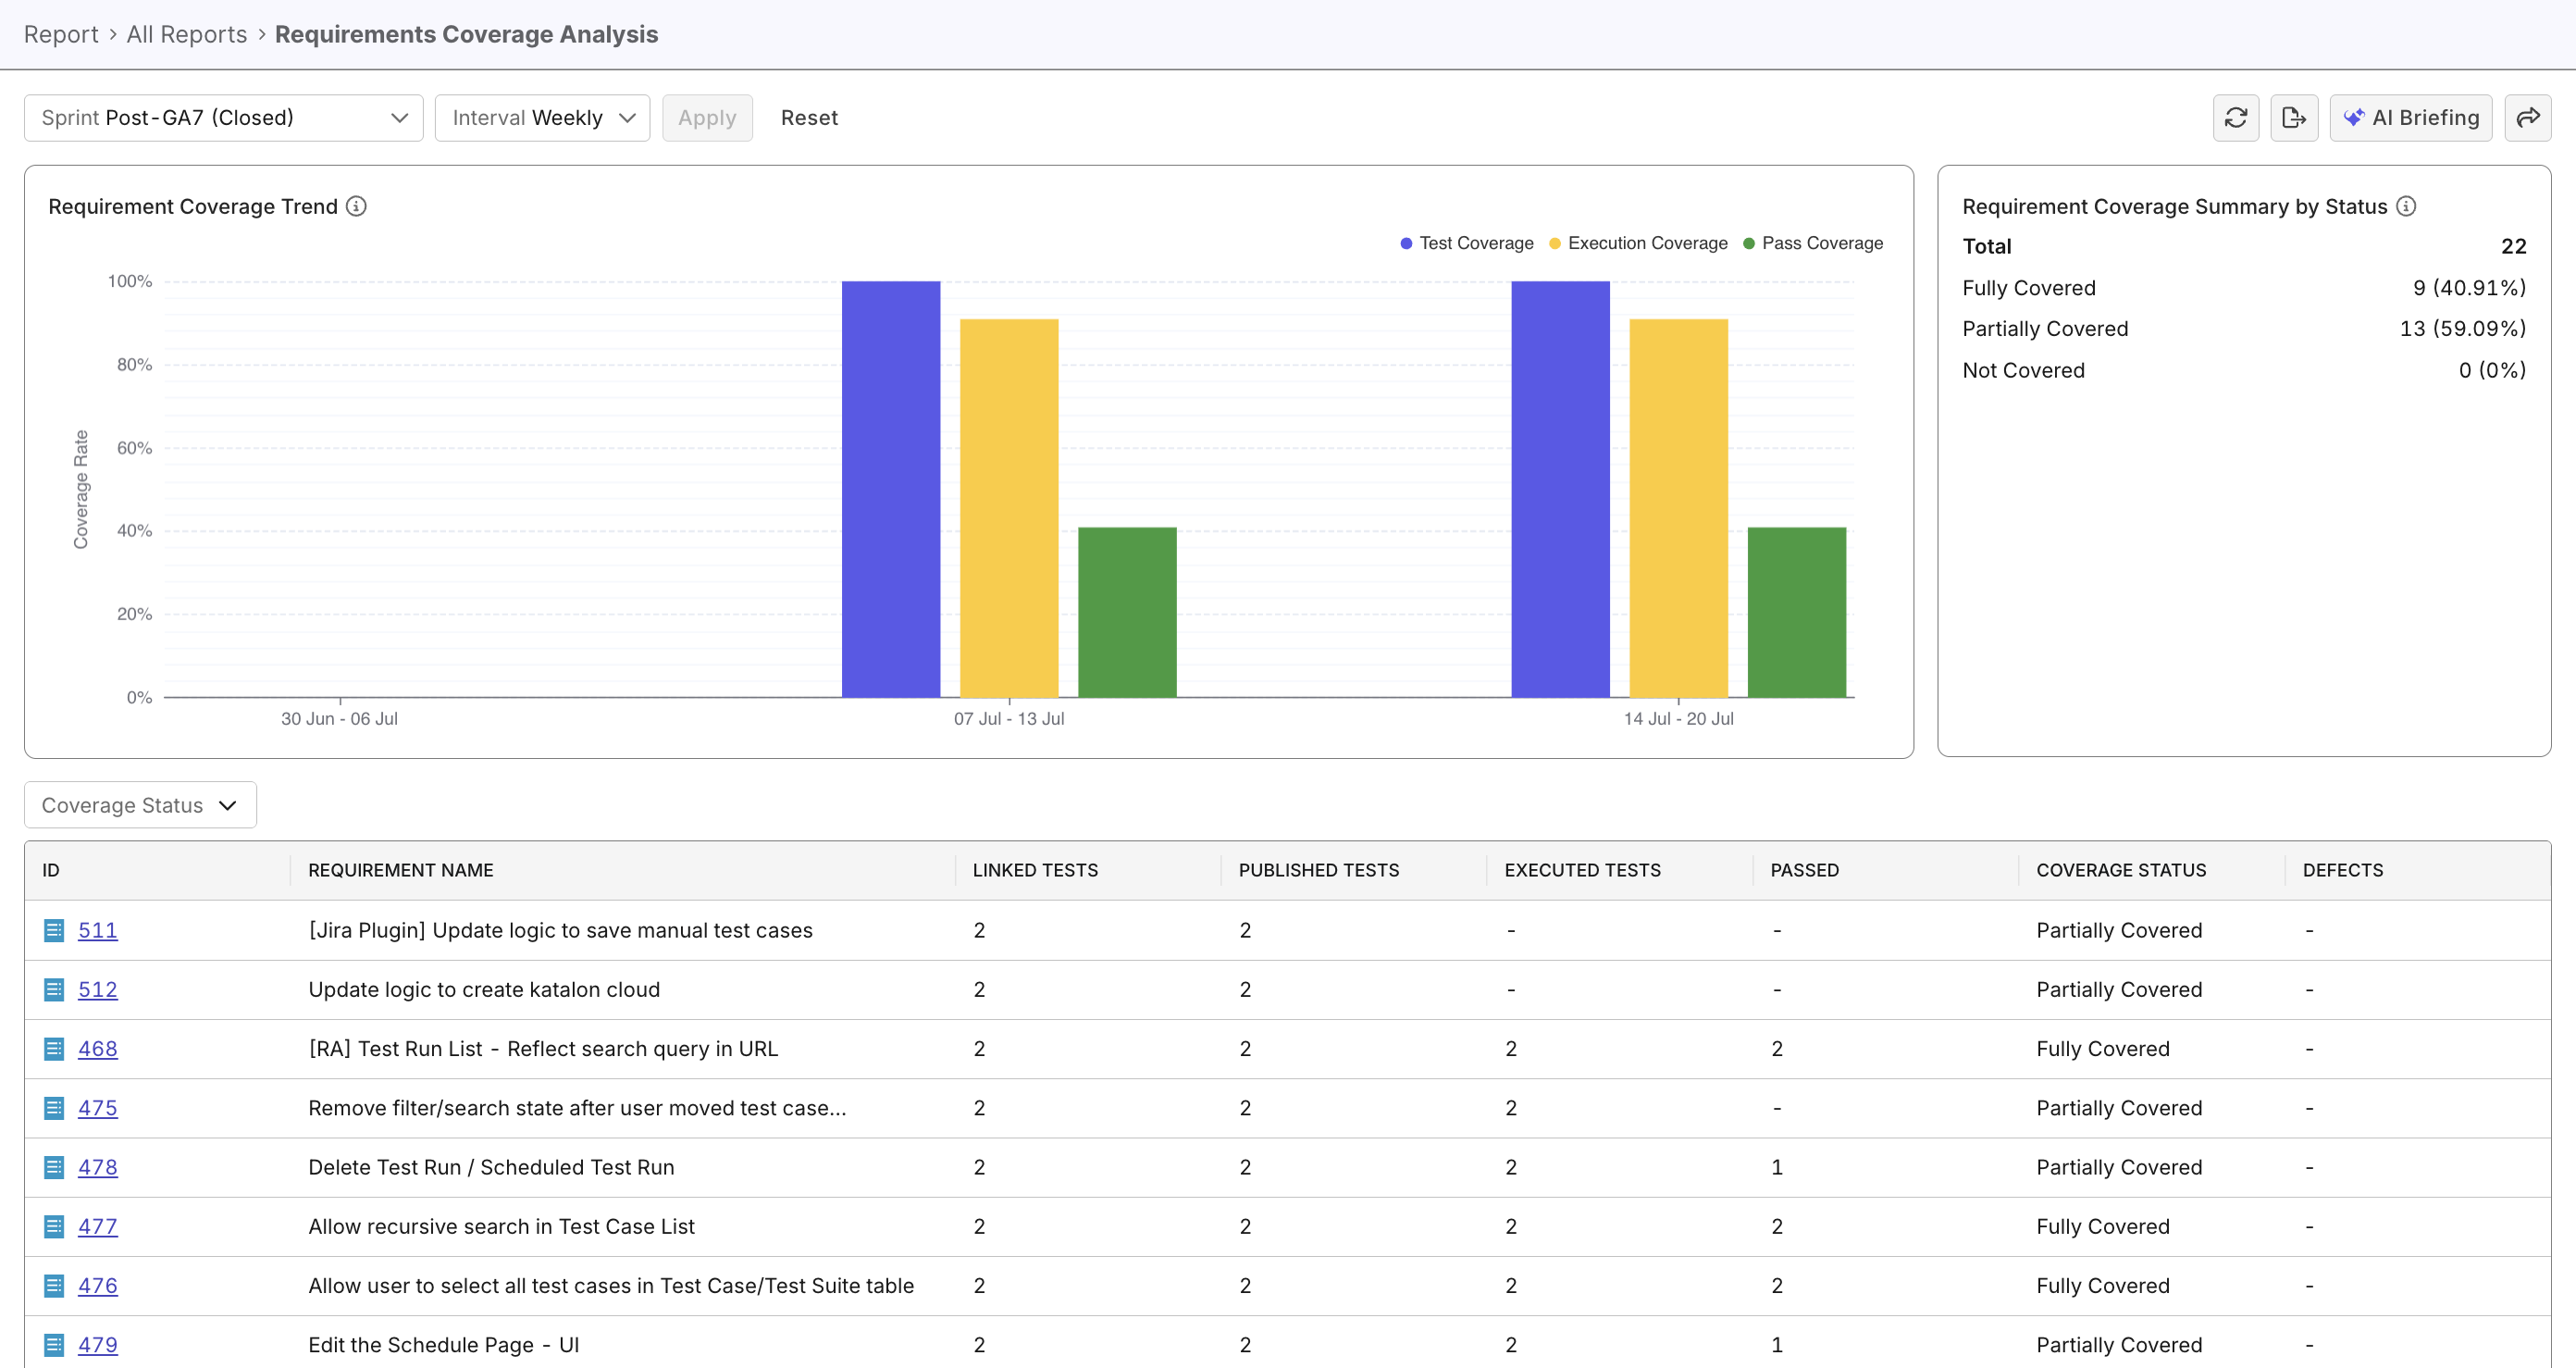
The Requirement Coverage Analysis Report helps teams evaluate how thoroughly project requirements are tested within a sprint or release, to evaluate product readiness. It provides insights into testing completeness, test case execution, and pass rates.
Tutorial: Analyze requirements coverage
Report Features
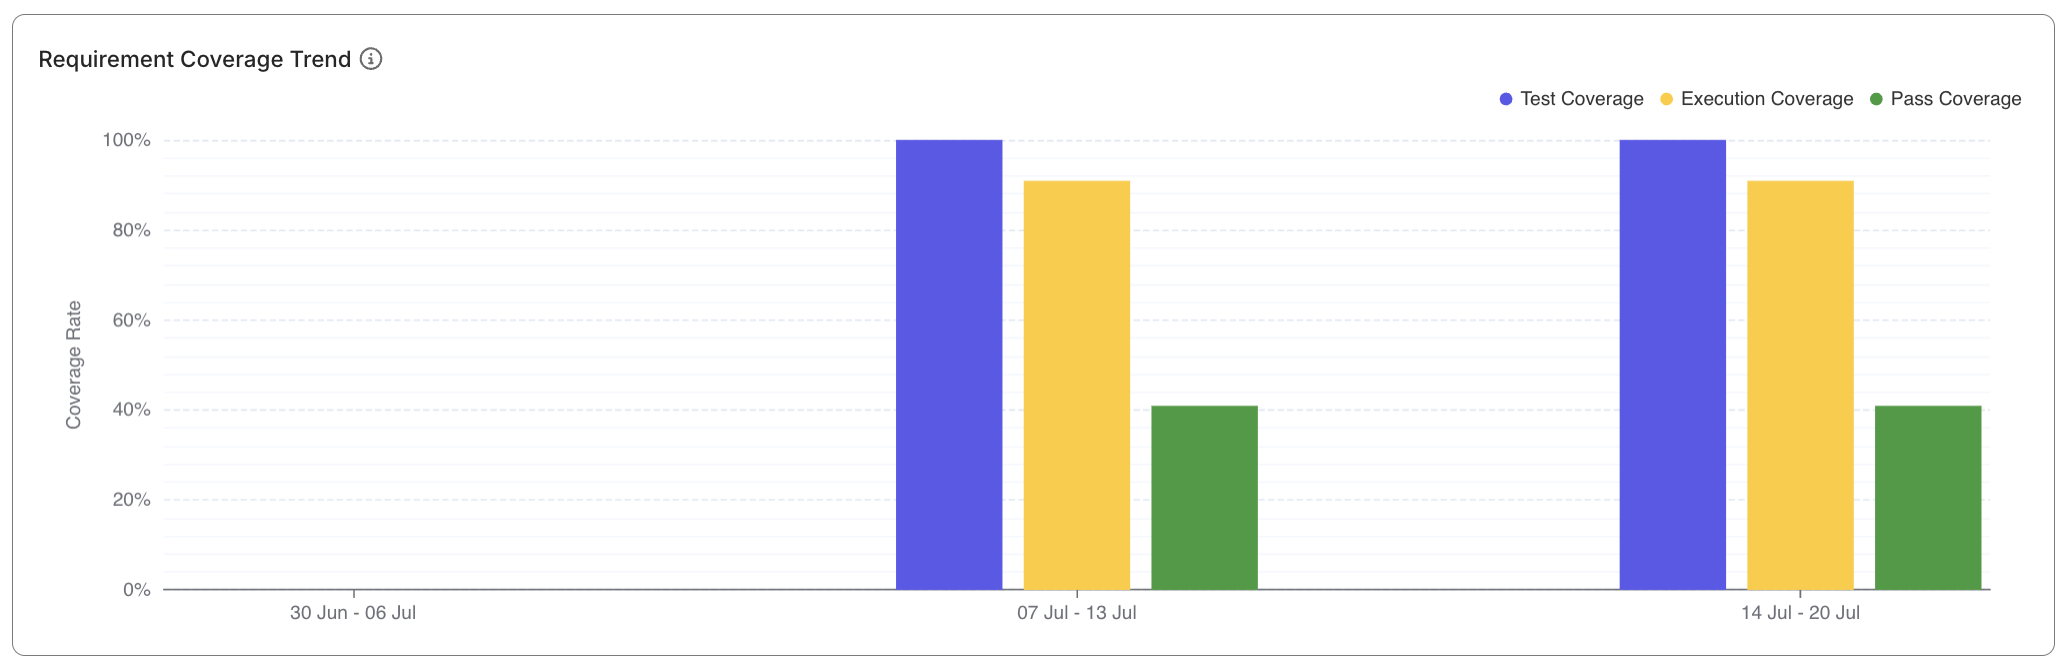
Coverage Trend Visualization
- Each bar group displays perfectages of coverage in selected time intervals:
- Test Coverage Percentage
- Execution Percentage
- Pass Percentage
- Hovering on each series displays summarized series data.
- Click to filter related records in the data table.
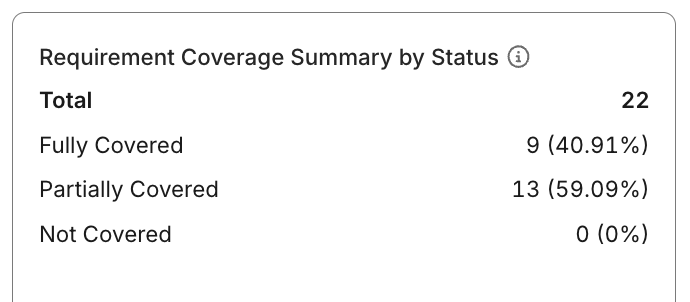
Coverage Status Summary
- Displays counts of requirements grouped by coverage level:
- Not Covered — no linked or published test cases
- Partially Covered — some test cases linked or executed
- Fully Covered — all linked test cases executed and passed
Requirement Data Table
- Lists each requirement with detailed testing metrics:
- ID and name (clickable to navigate to requirement page in ALM tool)
- Number of linked test cases and executions
- Counts of published, executed, passed, and failed test cases
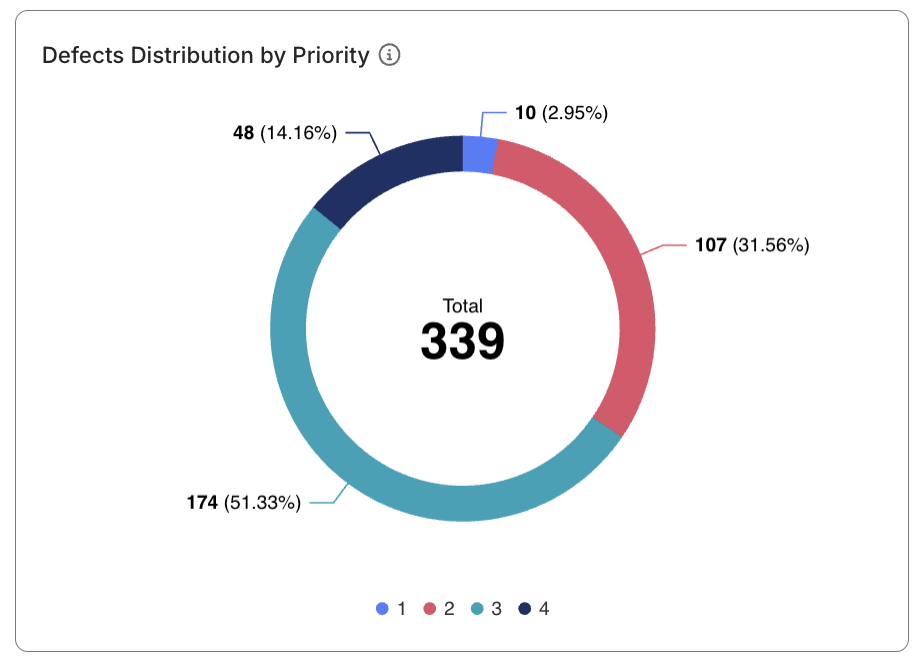
- Linked defect count
- Coverage status
- Default sorting: Coverage Status (ascending)
- Supports filtering by Coverage Status and sorting by key metrics (latest execution, ID, totals).
Learn more about coverage metrics at Coverage metrics