Automation Progress Analysis Report
This document lists features of the Automation Progress Analysis Report.
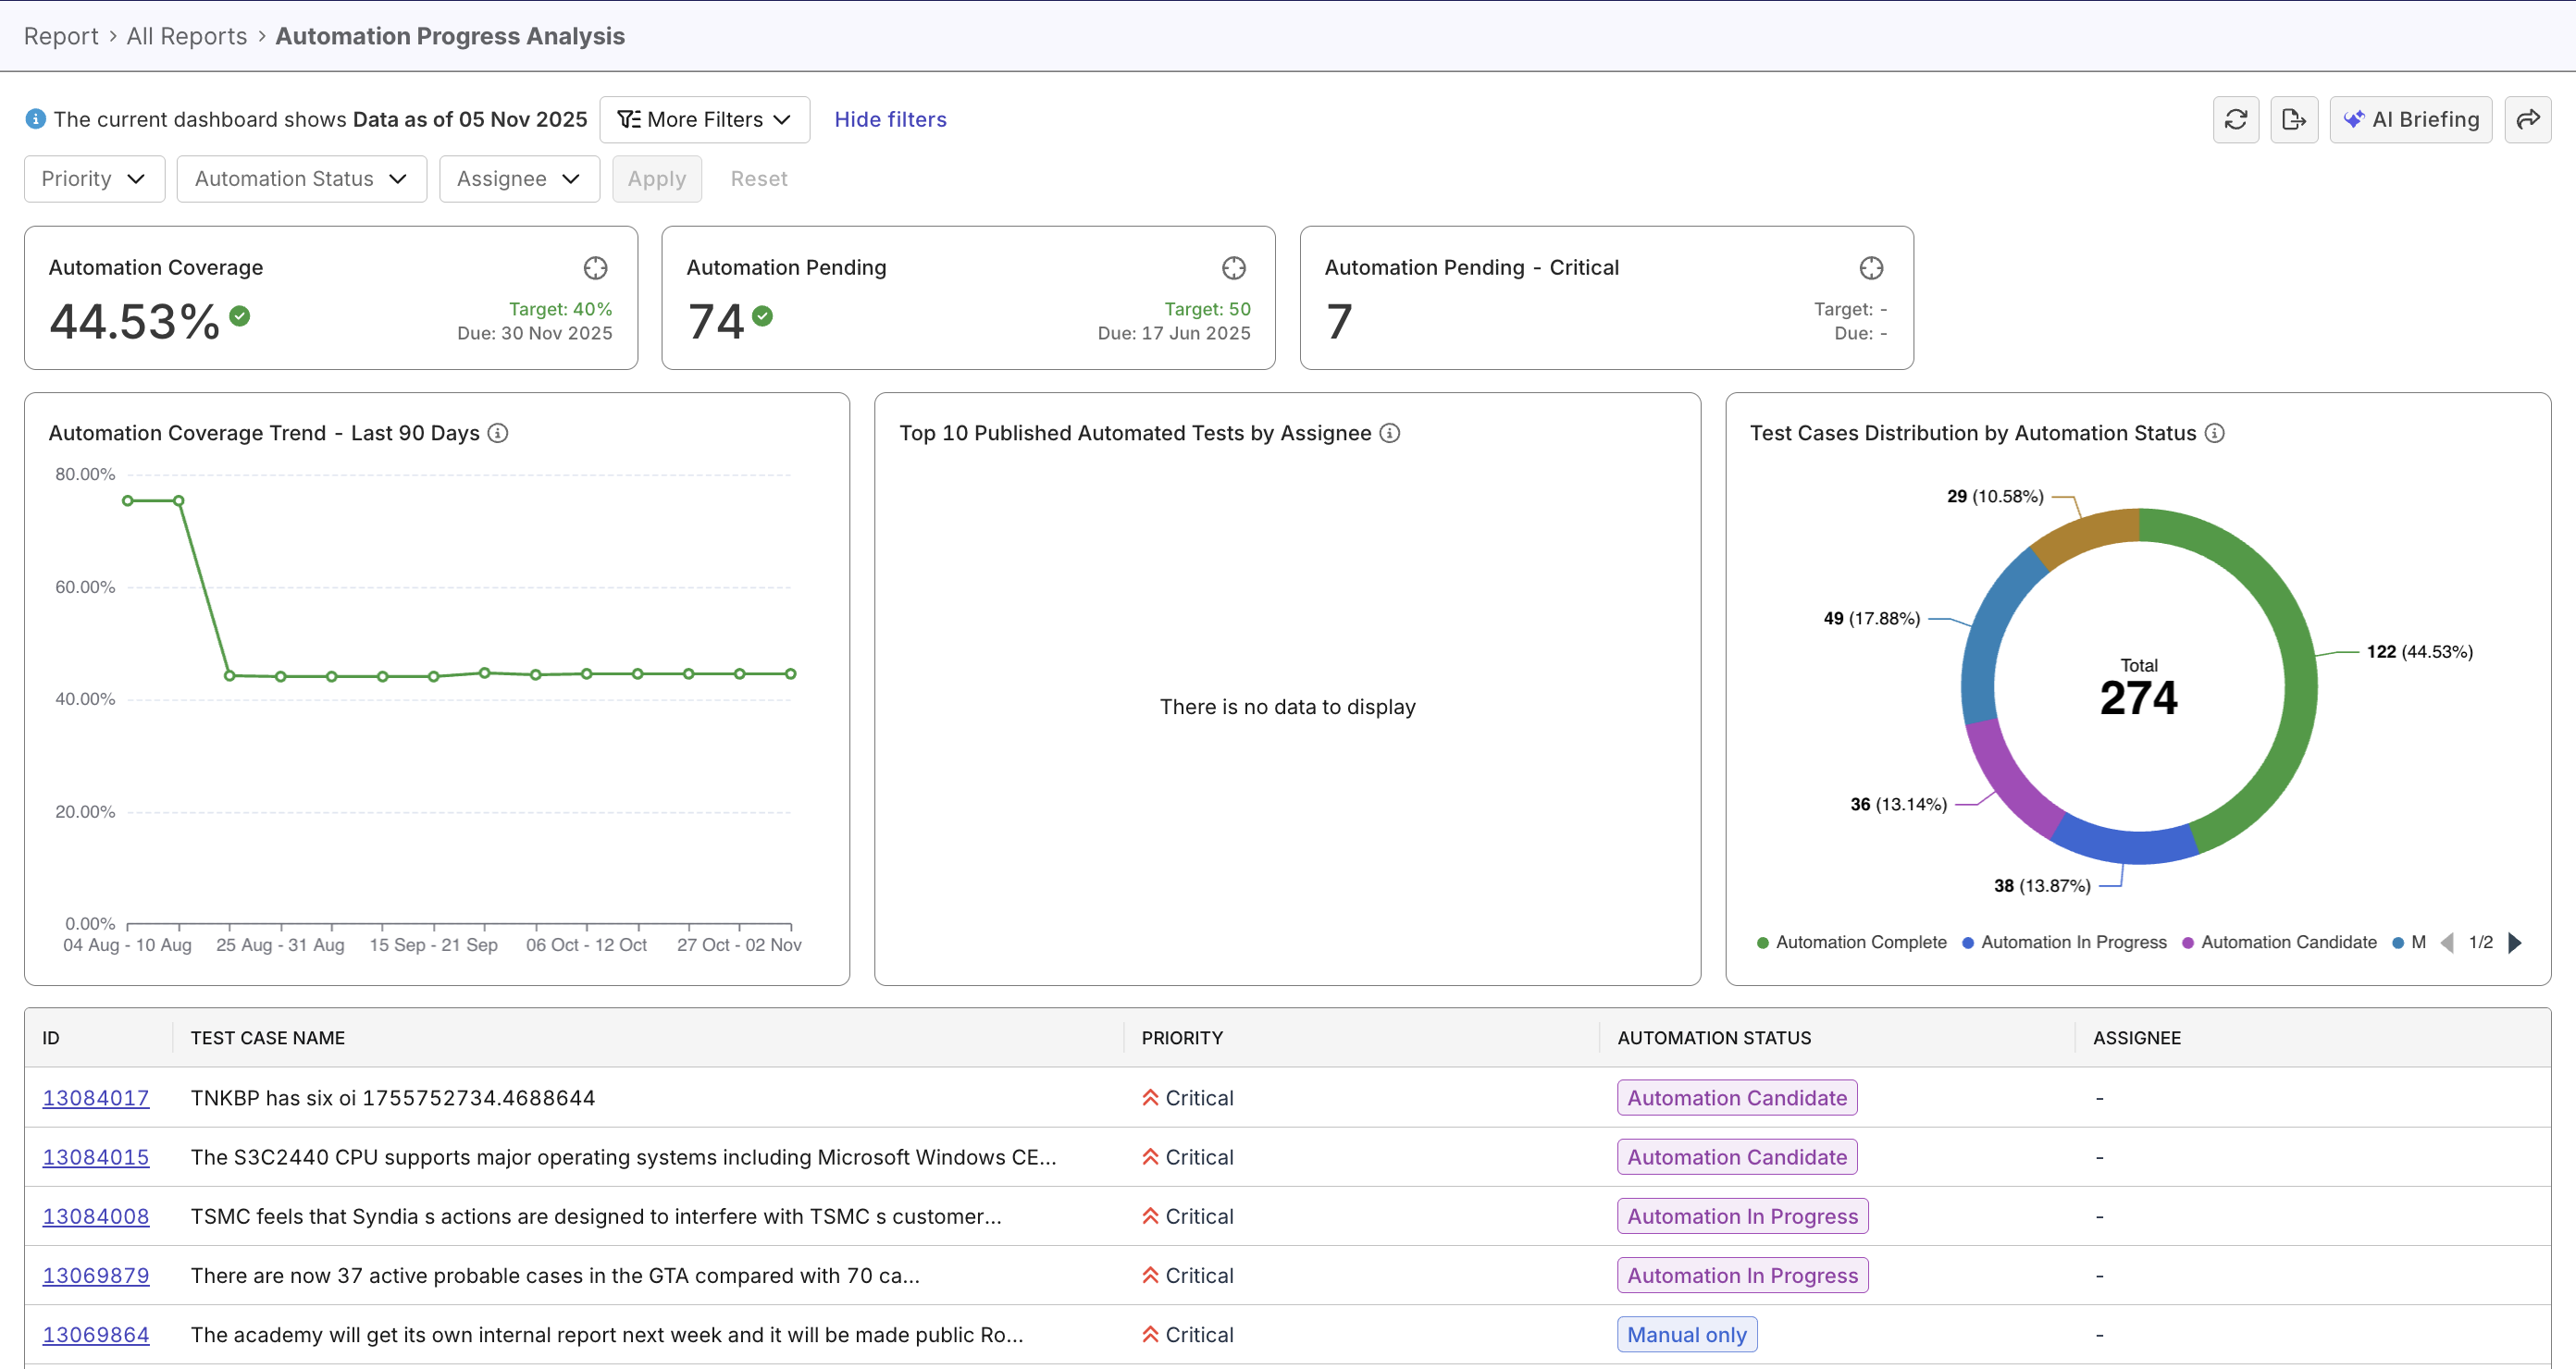
The Automation Progress Analysis Report provides an overview of your automation status across all test cases in Katalon True Platform. It consolidates manual and automated test data to help QA teams track progress, identify pending automation work, and evaluate automation trends over time.
Tutorial: Track automation progress
Report Features
The Automation Progress Analysis Report includes several key components that summarize automation performance and progress.
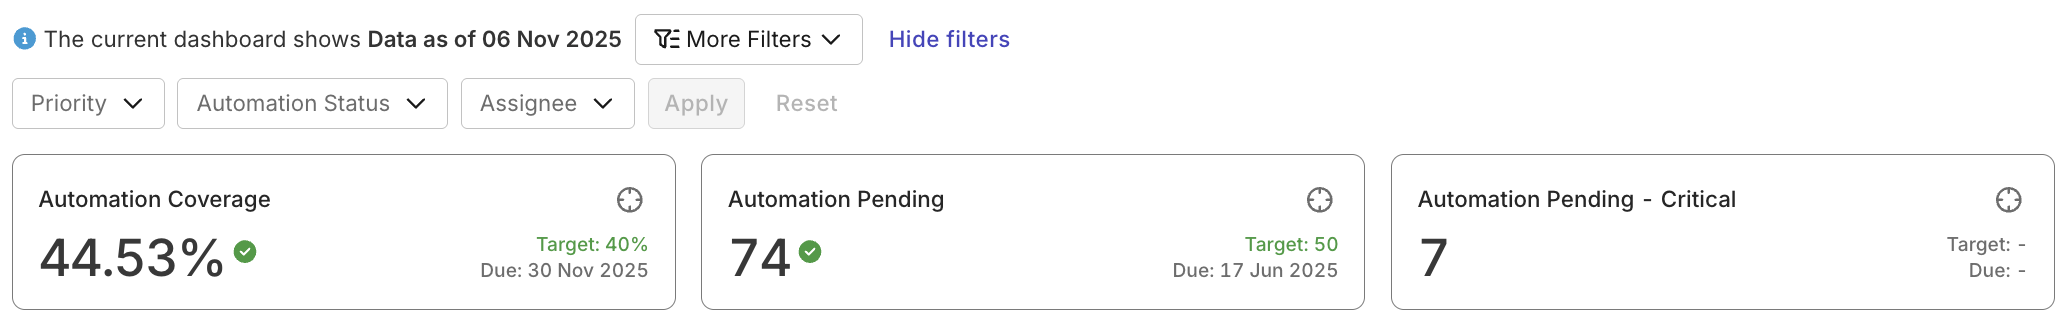
Automation targets
The Automation Coverage, Automation Pending, and Automation Pending - Critical widgets compare automation progresses against pre-set goals.
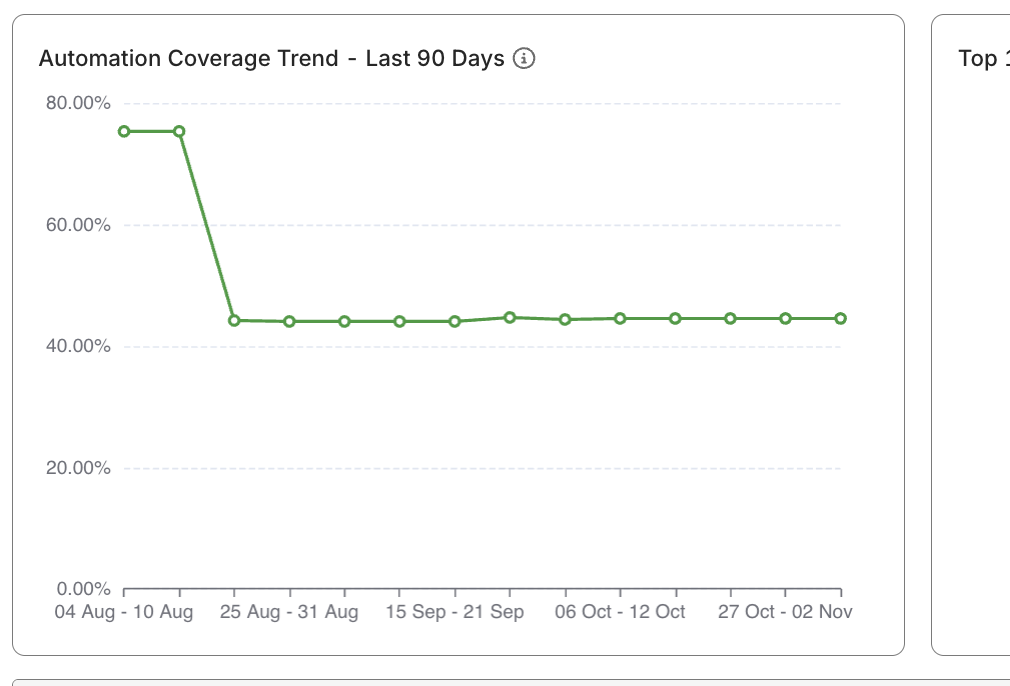
Automation Coverage Trend - Last 90 Days widget
This widget is a line chart that displays how the automation coverage percentage changes over time. It helps visualize progress trends and is unaffected by filters, ensuring a consistent long-term view.
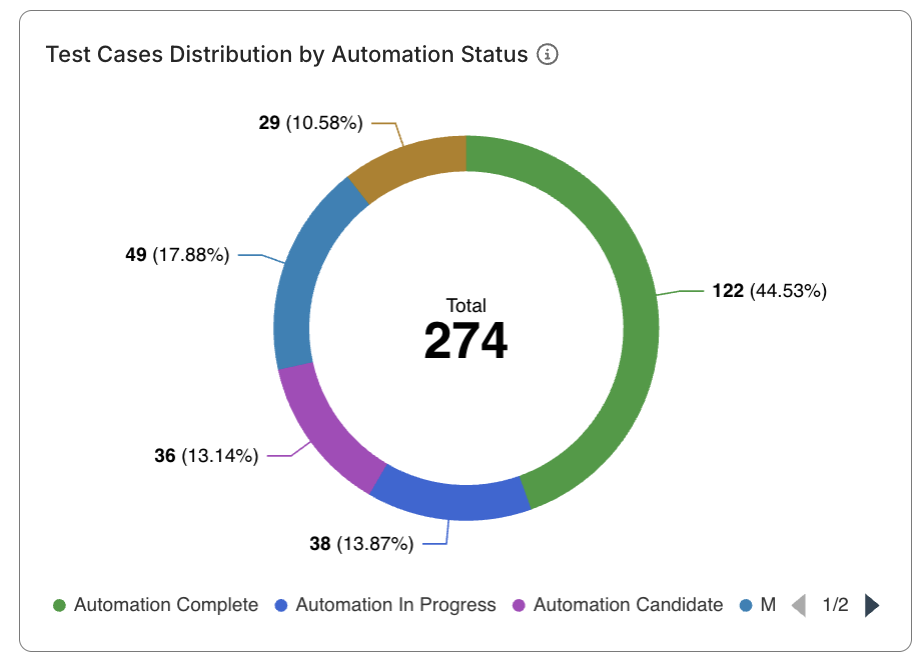
Test Cases Distribution by Automation Status widget
This widget is a pie chart that displays how manual test cases are distributed across different automation statuses (e.g., To Be Assessed, In Progress, Complete).
Top 10 Published Automated Tests by Assignee
This widget highlights the number of automated test cases (ATCs) completed by each assignee. It helps identify your top automation performers and resource distribution.
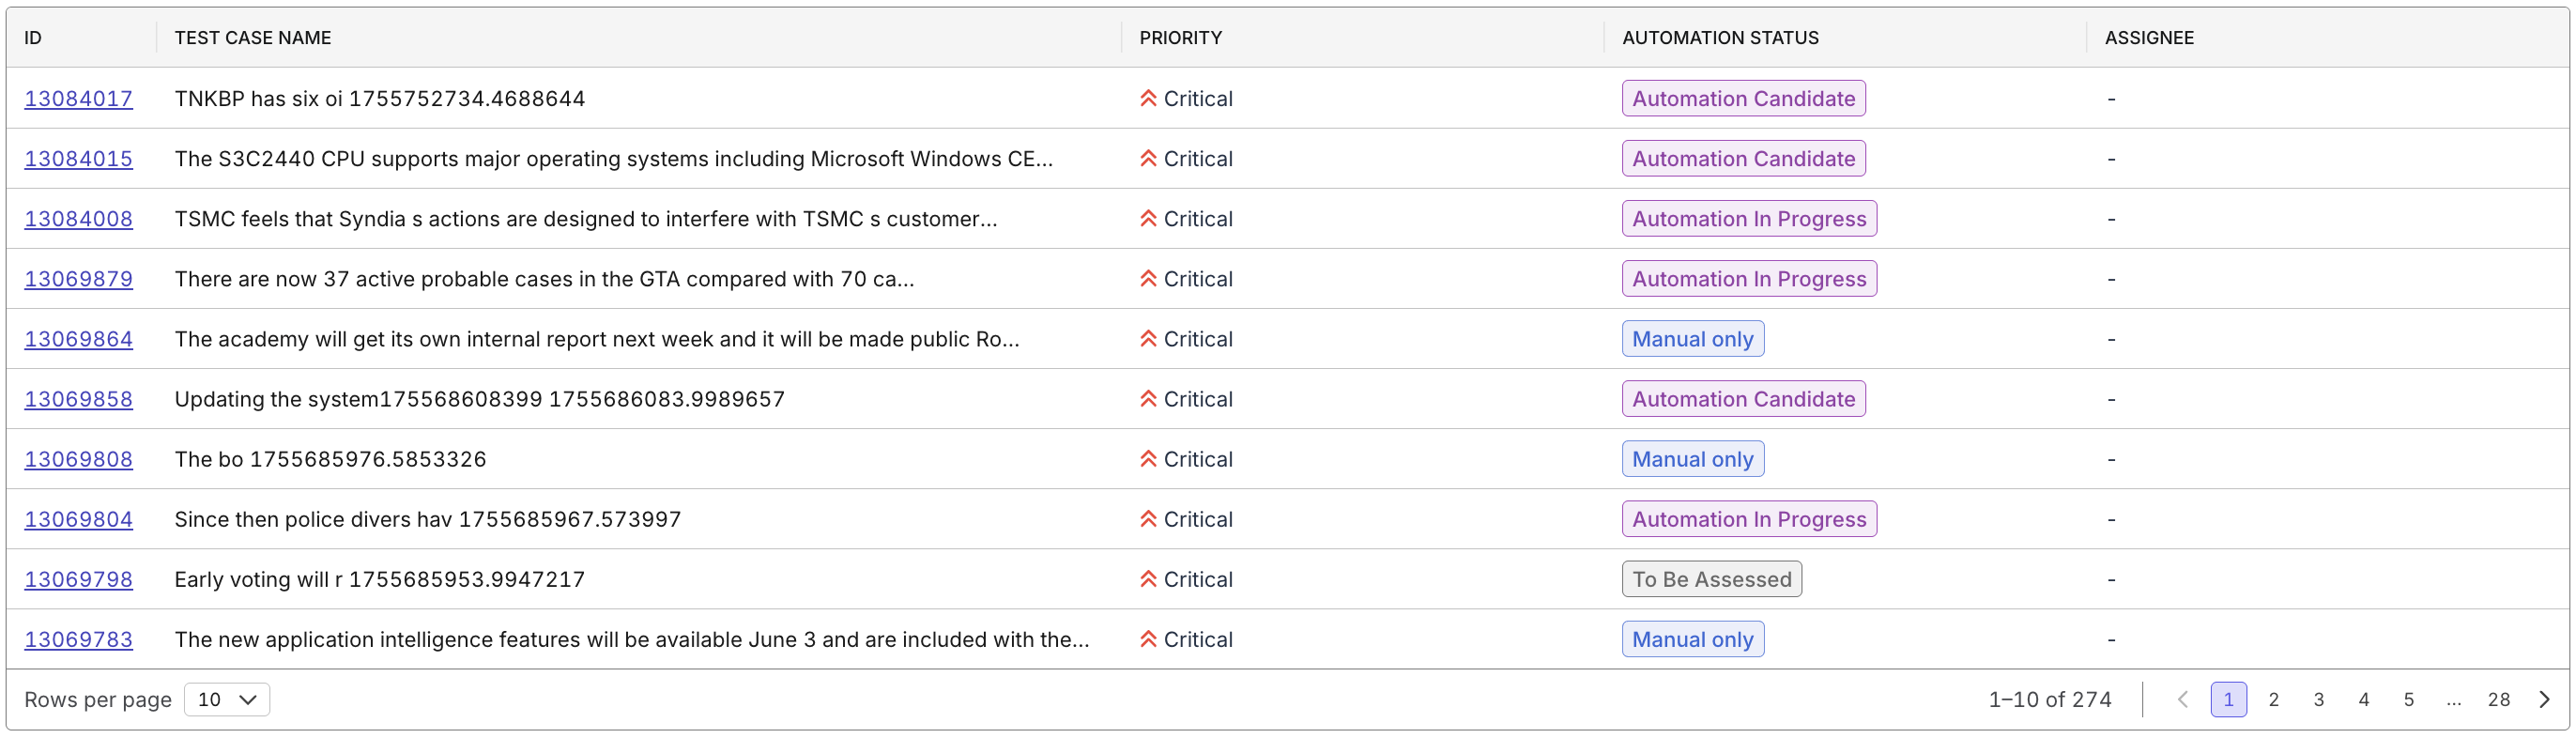
Manual Test Case Details (Data Table)
Lists all test cases with details such as priority, status, and assignee.
Use this table to drill down into specific automation tasks or bottlenecks.
Filtering Options
You can adjust the report’s scope using filters at the top of the page:
- Automation Status – Filter by automation stage (e.g., In Progress, Complete).
- Assignee – View progress by individual contributor.
- Priority – Analyze automation coverage by test case priority.