
Test Case Publishing Activity Analysis Report

This document explains how to use the Test Case Activity During Period report to analyze how test cases progress from creation to publication over time. It provides understanding of the pace and volume of test case publishing activities, identify process bottlenecks, and ensure test readiness before releases.

test cases publishing activity status analysis report

With this centralized report, you can instantly visualize test case statuses, track publishing trends, and monitor author productivity through a single interface.

Why Use This Report​

  • Monitor how many test cases have been published, reviewed, or are still in draft or in review states.
  • Identify the trend of publishing activities to evaluate productivity and process efficiency.
  • Filter and drill down by time range, sprint, test case type, or author.
  • Communicate progress effectively with stakeholders through data visualization and exportable summaries.

Explore the Report​

  1. Navigate to Reports > All Reports > Test Case Activity During Period by Status.
  2. Select the Date Range or Release/Sprint
  3. Adjust the Interval - Adjust intervals to Daily, Weekly, Monthly, Sprint, or Quarterly to view the activity trend at your desired granularity.
  4. Review the bar chart showing test case counts by status over time. Hover to see detailed tooltips with timestamps and count breakdowns.
  5. Review summaries and distribution chart, by status and type (manual vs. automated).
  6. Inspect the Data Table to see the breakdown of all test cases — sortable and filterable by status, type, author, and created date.
  7. Drilldown the Data Table Click the Pie Chart icon to view the status or type breakdown in a circular visual format, ideal for quick overviews or presentation snapshots.

Report Features​

note

This report excludes autonomous test cases generated by TrueTest, and INACTIVE test cases.
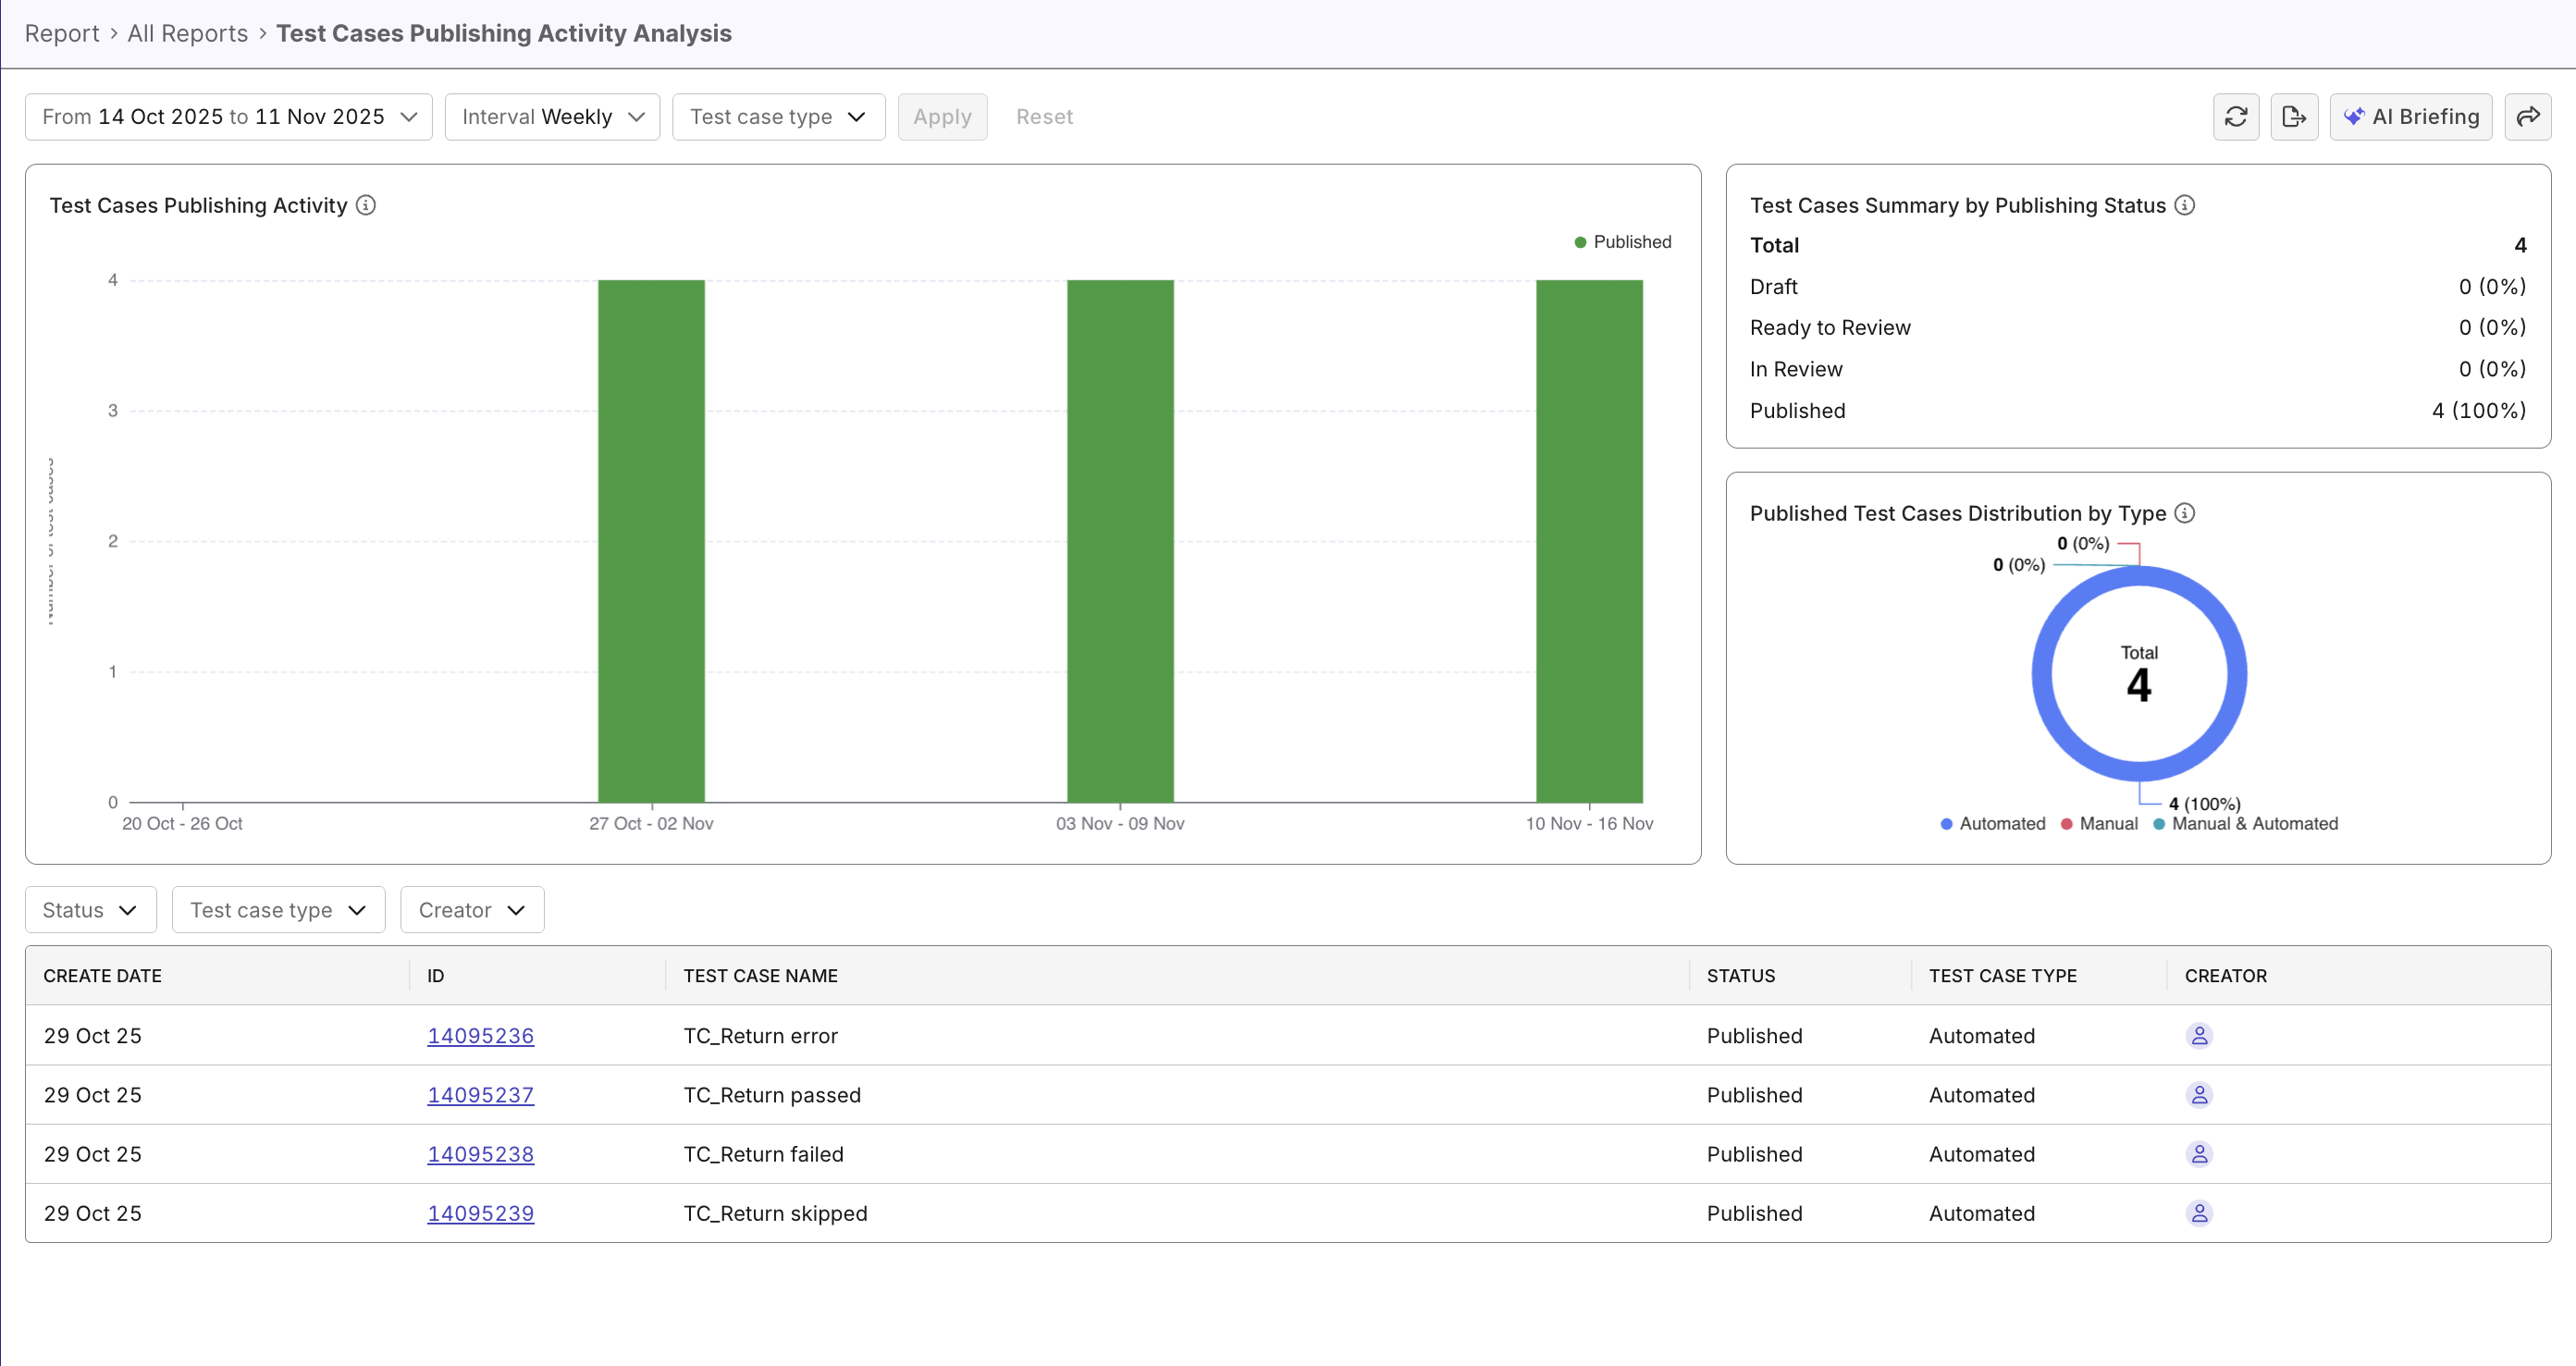
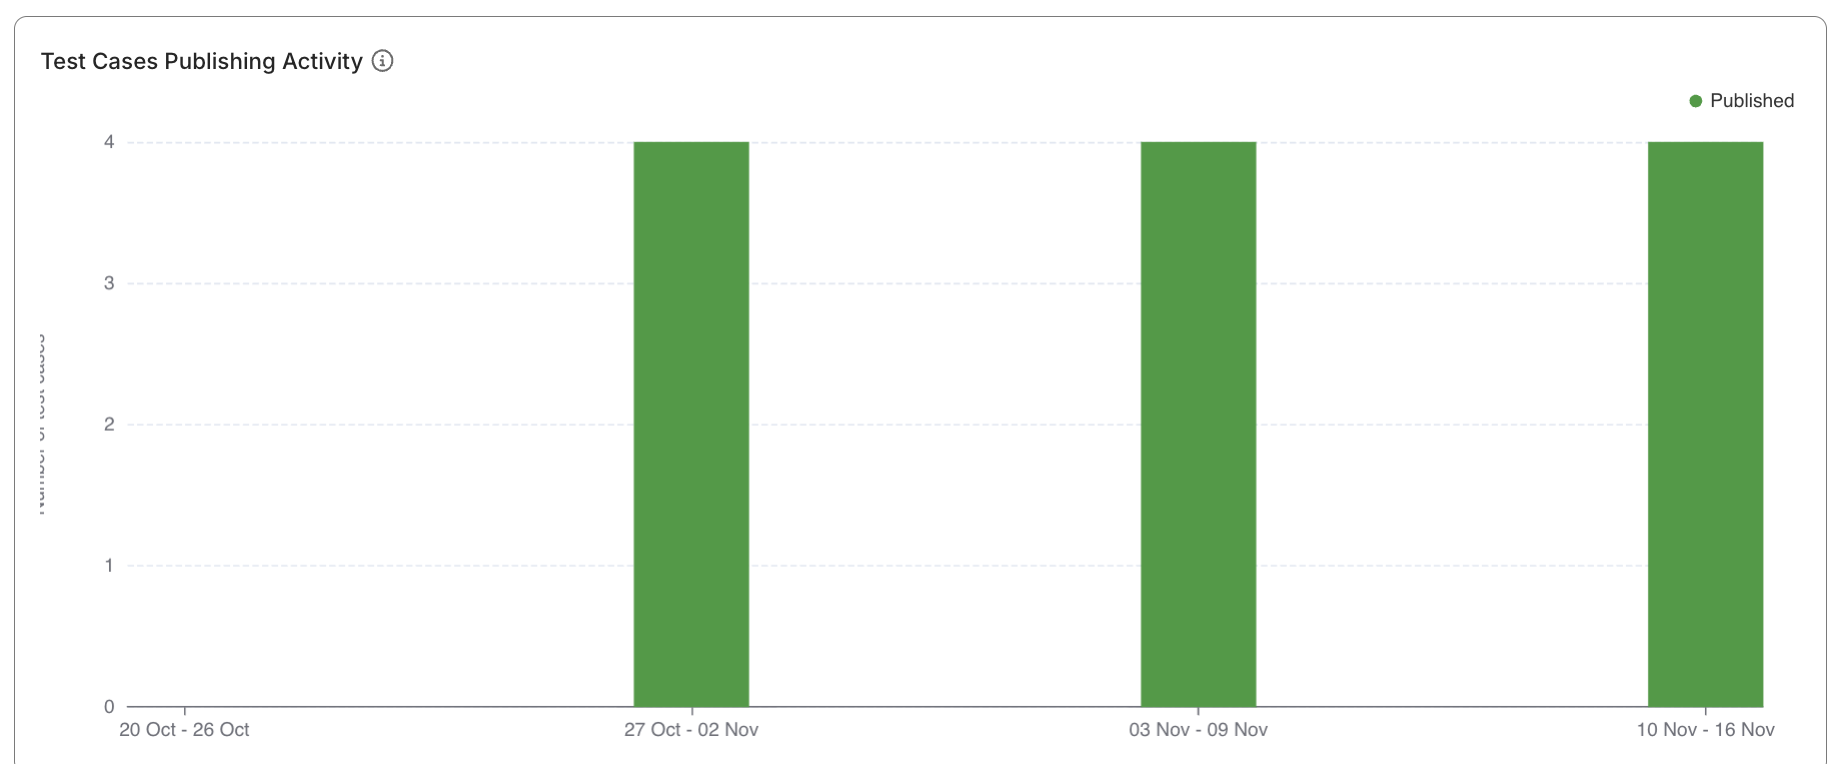
Global Filters​

  • Date Range / Sprint: Define the analysis period with presets or custom selections.
  • Interval Selector: Adjust the x-axis display to match your reporting purposes.
  • Test Case Type Filter: Focus analysis on manual, automated, or combined test cases.

Main Bar Chart​

  • Displays test case counts grouped by status (Draft, Ready to review, In Review, Published) over time.
  • Bar chart format enables easy trend recognition and comparison.
  • Hover interactions show detailed counts per period.
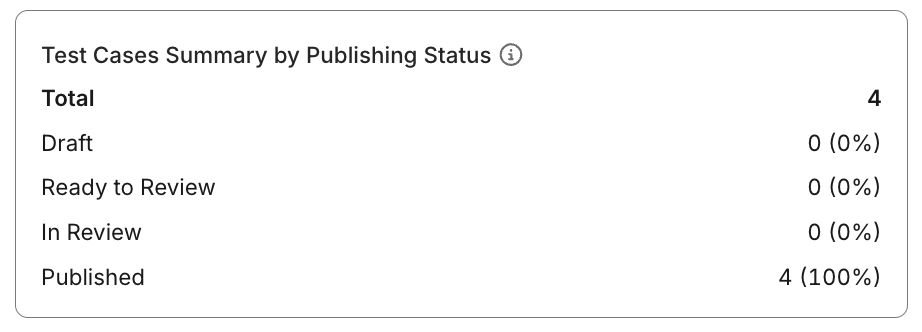
test cases publishing activity status analysis report bar chart

Summary Statistics​

  • By Status: Shows total number and percentage of test cases per status within the selected time range.
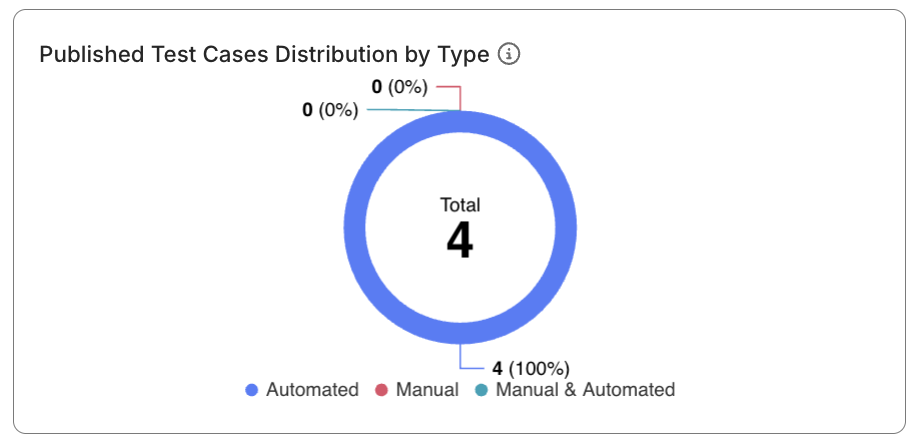
  • By Type: Compares manual, automated, and combined test cases to understand testing balance.
test cases publishing activity status analysis report summary

Pie Chart​

  • Alternative visualization showing proportional distribution of test cases.
  • Hovering reveals numeric values and percentages.
  • Clicking a slice filters the data table to corresponding records.
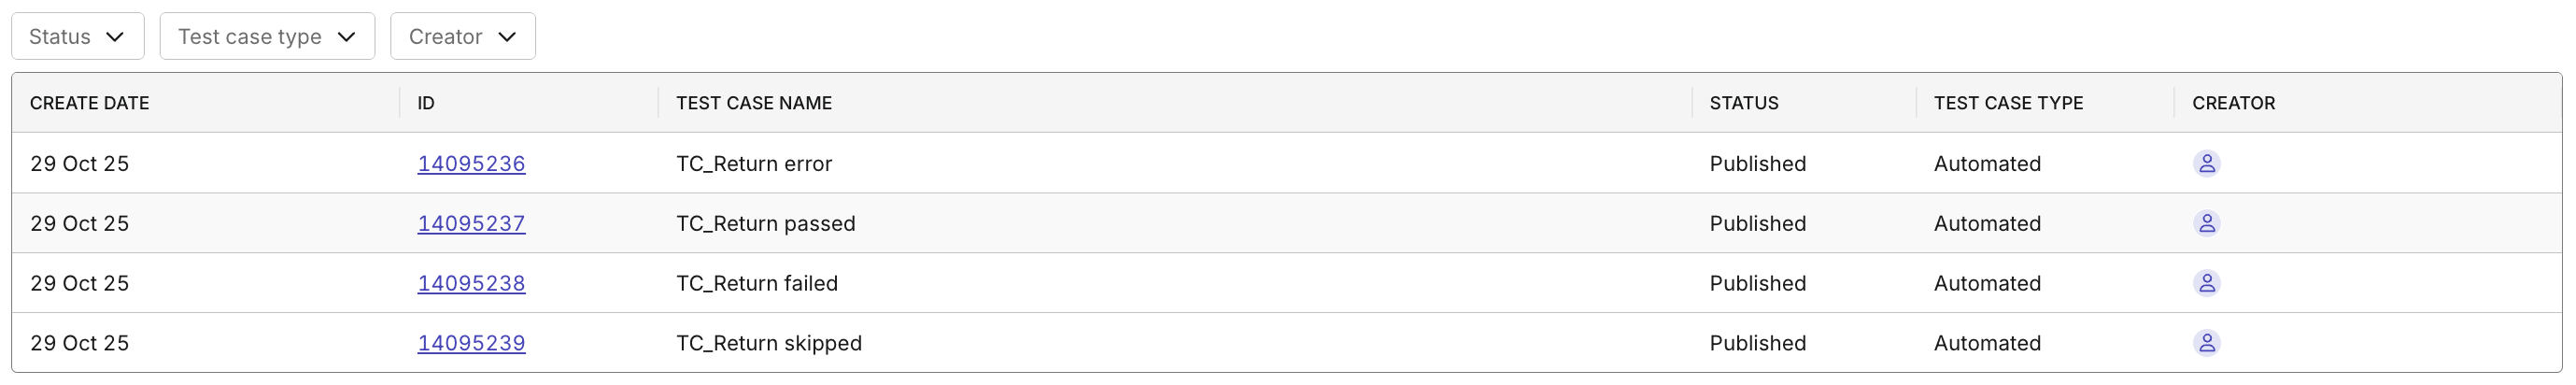
test cases publishing activity status analysis report distribution chart

Data Table​

  • Detailed list of test cases created or updated during the period.
  • Columns include:
    • Create Date (sortable)
    • Test Case ID (click to navigate directly to test case detail page)
    • Name
    • Status
    • Type
    • Creator
  • Filterable by status, type, and creator.
test cases publishing activity status analysis report drill down table
Was this page helpful?