Custom Dashboards
This document explains how to create custom dashboards in Katalon True Platform.
- You must have either the Project Admin or Test Lead role to create custom dashboards.
Overview
While pre-built templates provide core insights, Katalon True Platform's custom dashboards accommodate the need for monitoring more specialized areas as teams grow.
Custom dashboards can be designed to suit different purposes, such as:
- Sprint Review Dashboard: Curate widgets showing pass rates, execution trends, and failure categories filtered to current sprint for stakeholder review.
- Team Performance View: Combine execution volume, average duration, and status distribution widgets grouped by executor.
- Regression Suite Health: Monitor regression test stability with pass rate trends, new failing tests, and average suite duration.
Users with Katalon True Platform Enterprise Edition can also create cross-project dashboards to monitor multiple projects in one place. For instructions, see Create Cross-Project Dashboards.
Create custom dashboards
- Go to Project > Analytics tab > Dashboards.
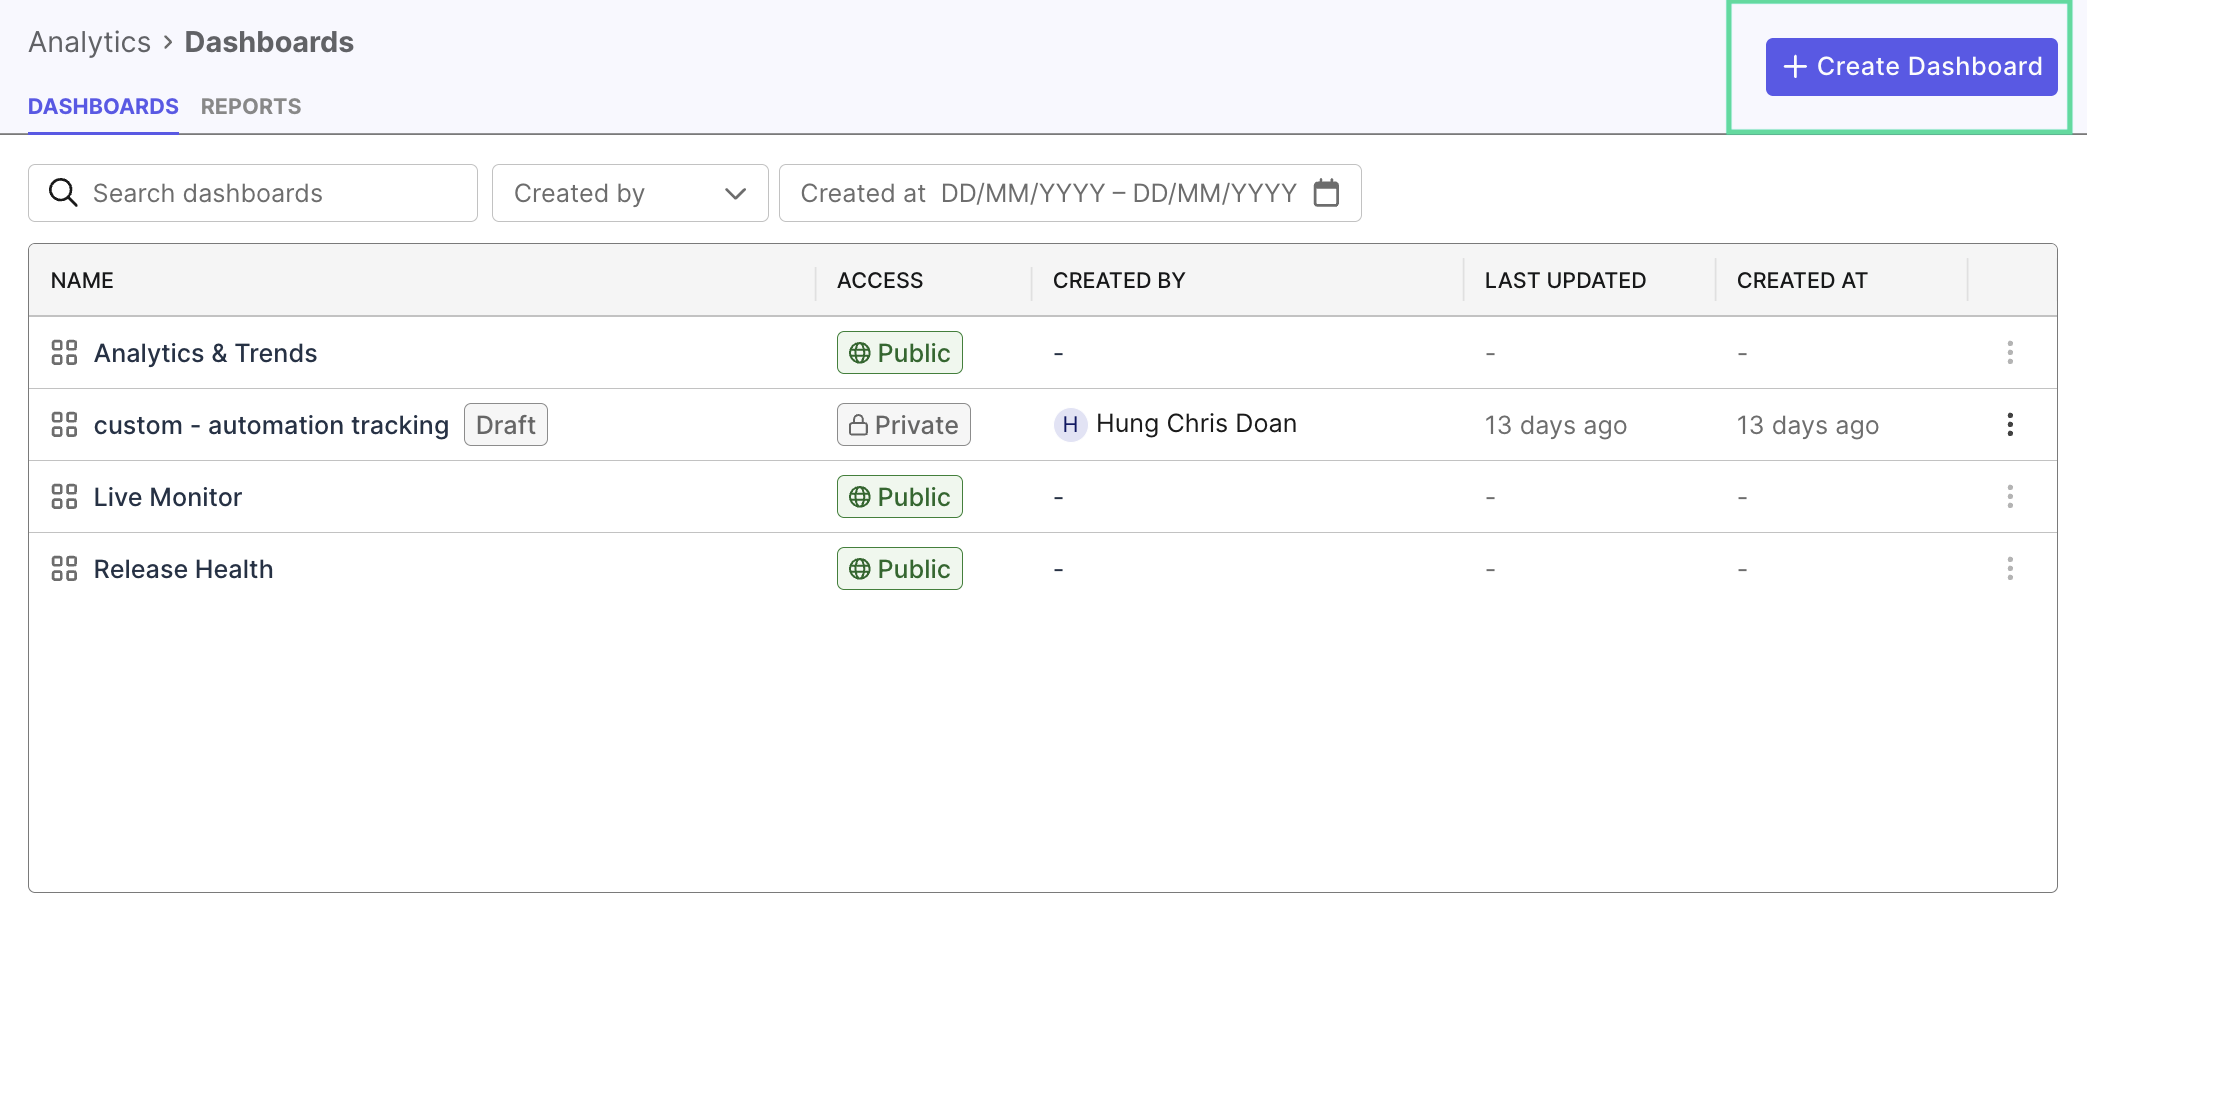
- Click on Create Dashboard. The screen displays the widgets that you can add or remove from the dashboard.
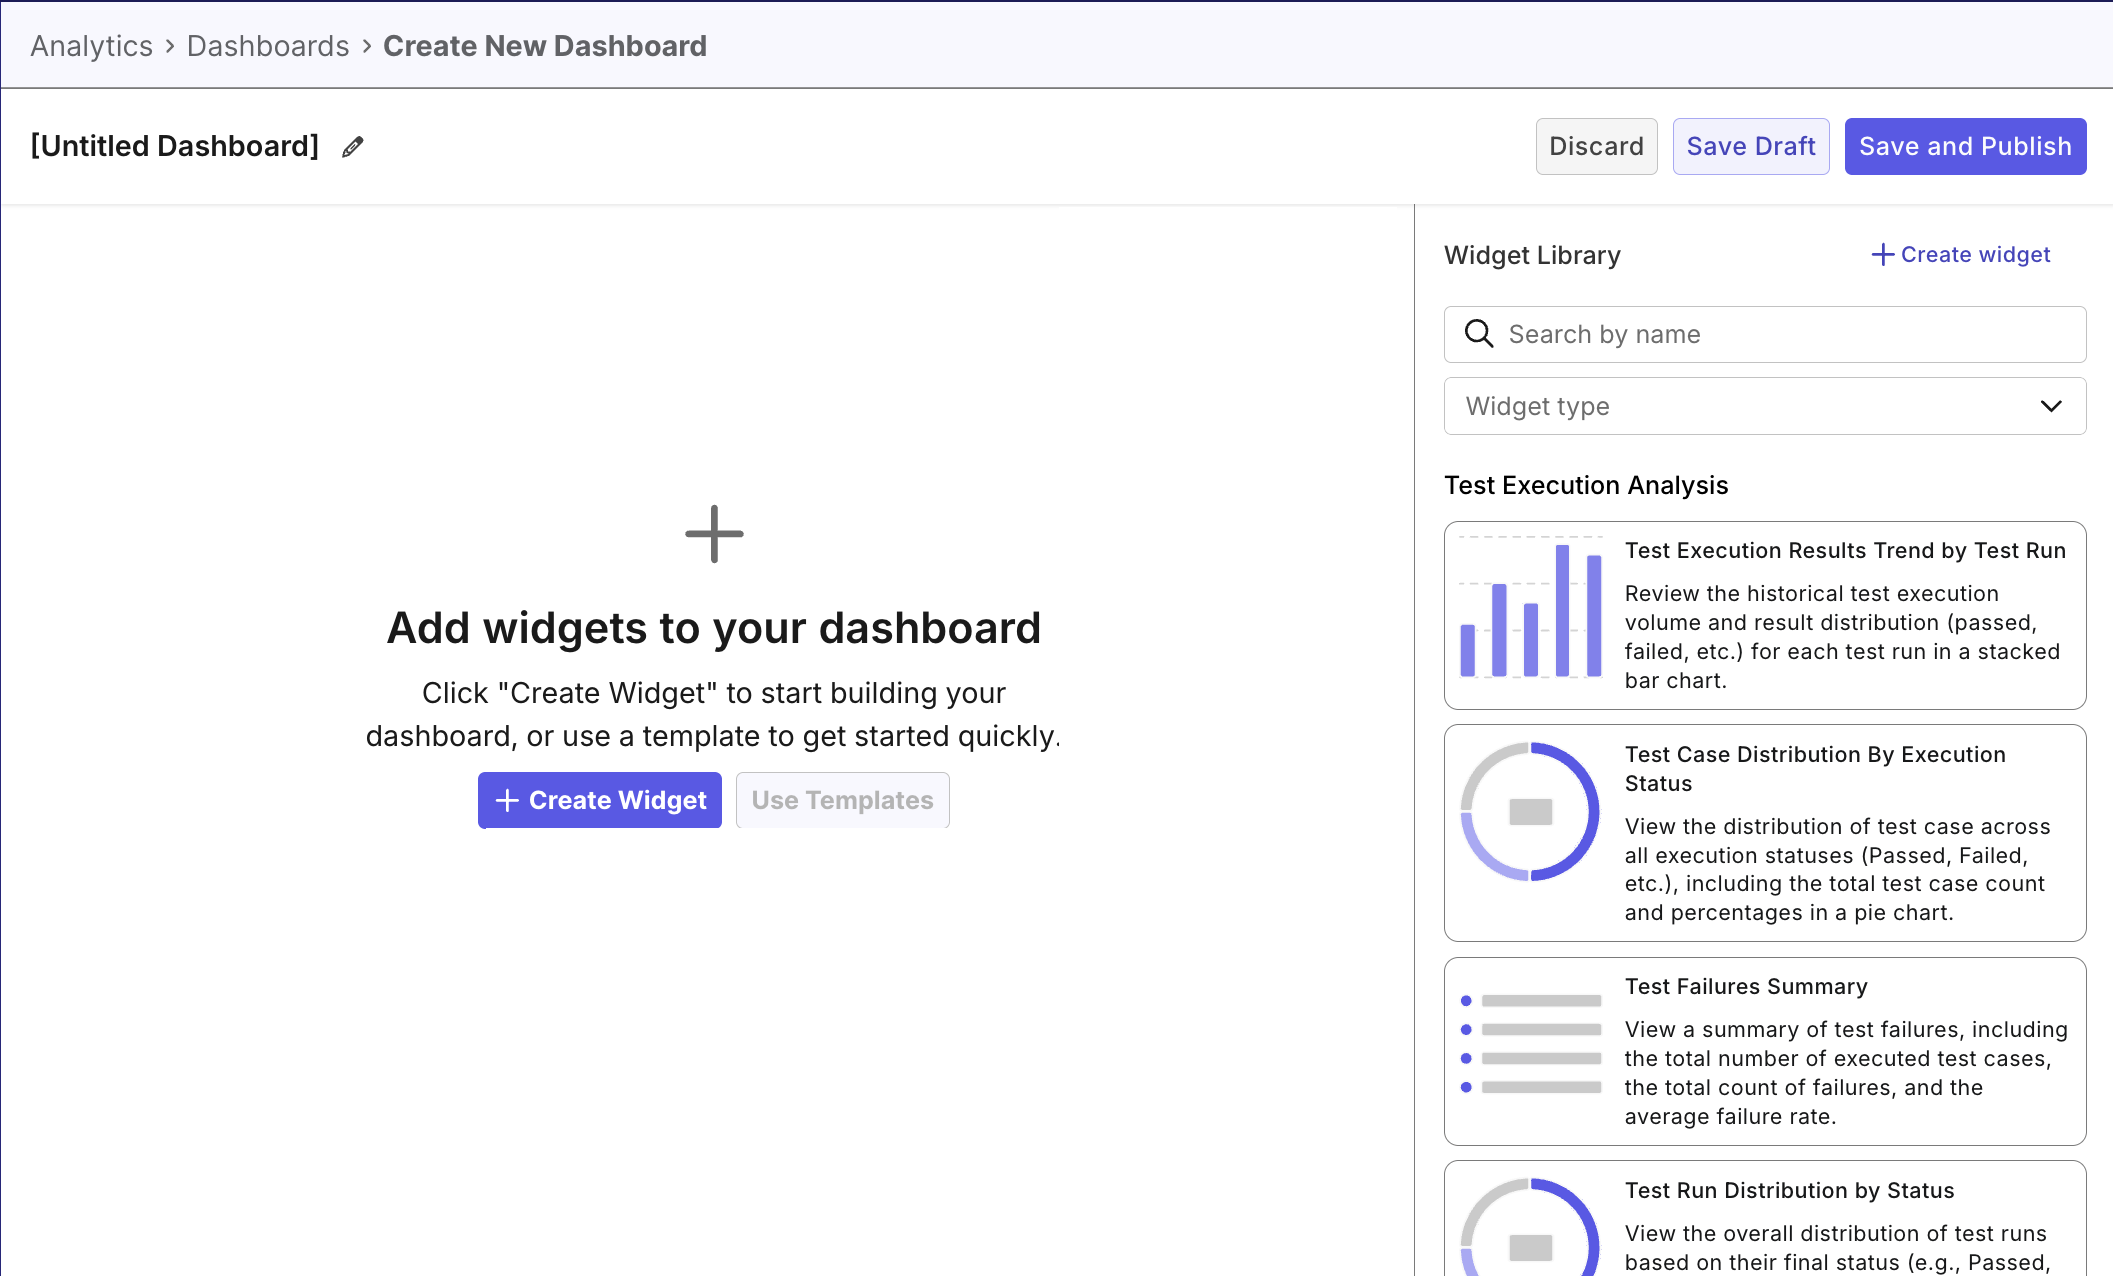
-
From the Widget Library, drag and drop widgets into the dashboard. You can also create custom widgets if existing widgets don't address your needs.
-
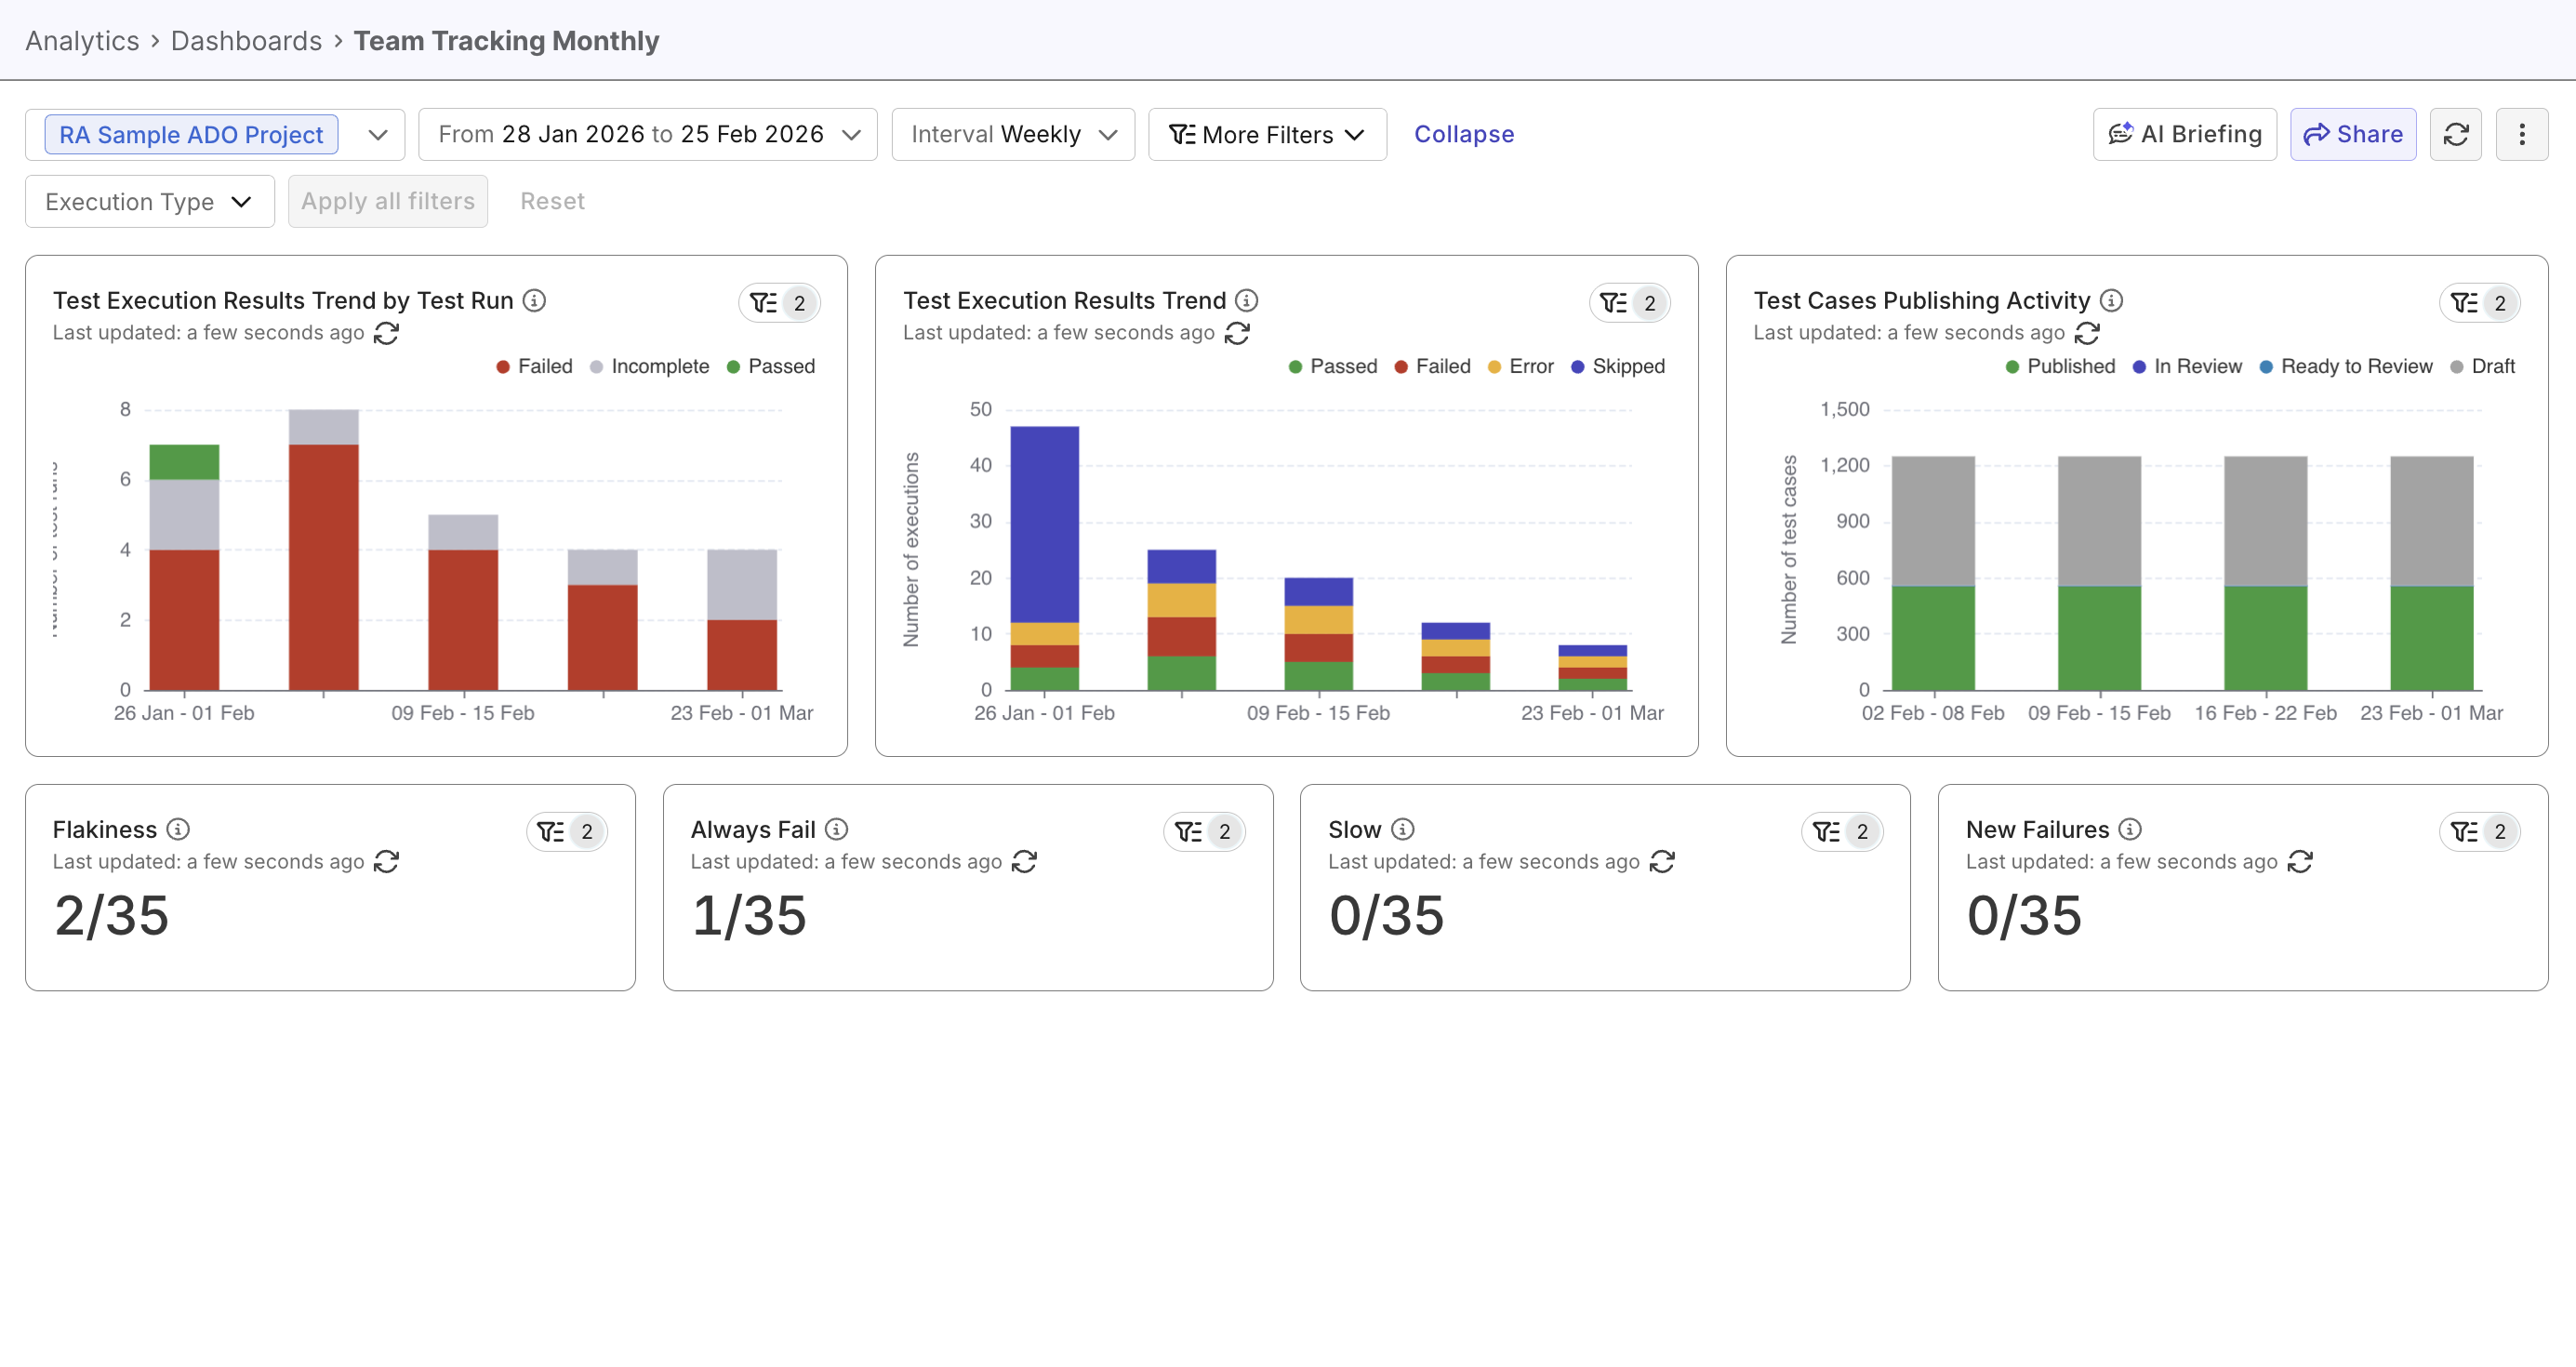
Select dashboard scope and filters.
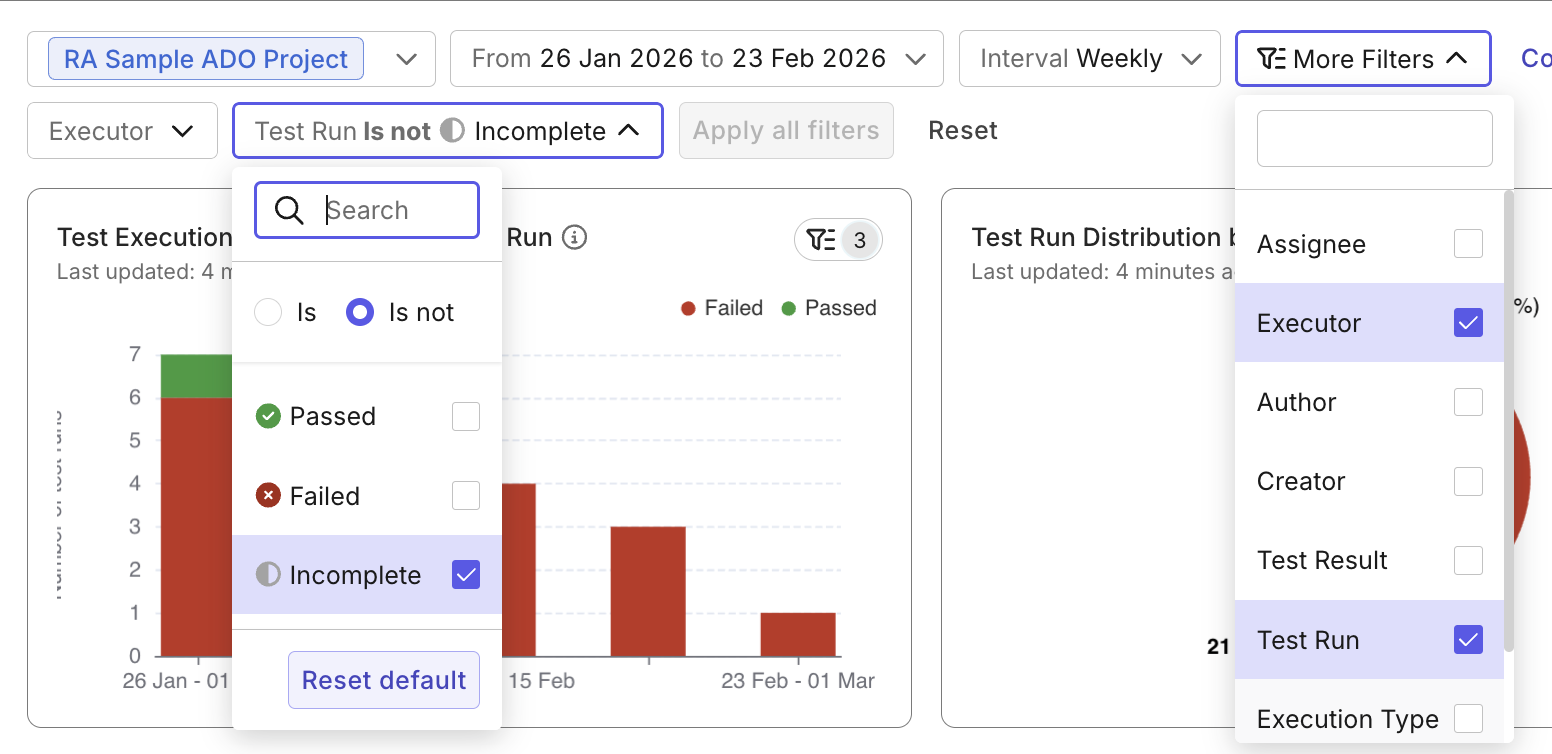
When a dashboard filter is applied, the final data shown in each widget is the result of filtering the original data through:
Widget FiltersDashboard FiltersSelected Scope(time range or release/sprint)
If these filters conflict, widgets may display incomplete or empty data. For example, a widget designed to display only data from "Executor A", may not show any data on a dashboard filtered by "Executor B".
- Click Save Draft to save the dashboard as a draft (private), or click Save and Publish to make the dashboard editable/viewable to people with access to the same project.
- Published custom dashboards can be edited by different users and cannot be made private again.
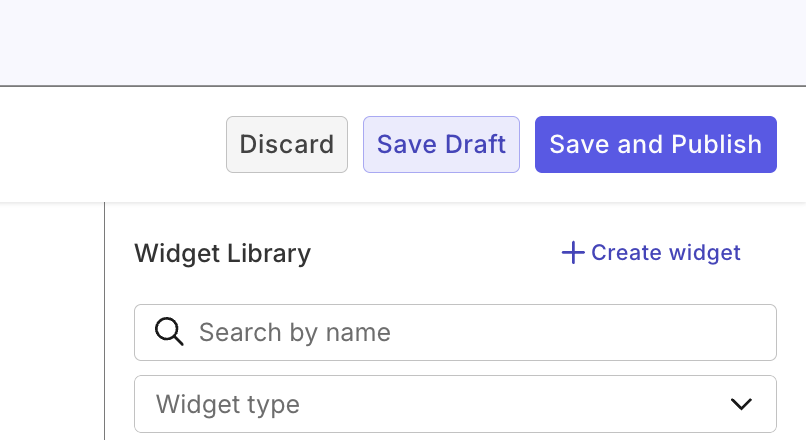
Click Discard if you don't wish to save.
Best practices
Follow these tips to ensure correct data display.
Planning your dashboard
- Pick one scope type (e.g. by release X, by date range X-Y, ...) and one analytical intention (e.g. KPI tracking, performance tracking, defects tracking...) per dashboard, to ensure consistent data interpretation and avoid inconsistent metrics.
- Give your dashboard a clear name that reflects its intention and refer to it as you add widgets, to avoid scope-breaching.
Choosing filters
- Create new widgets if existing ones don't share the same analytical perspective with your dashboard.
- Keep widget filters neutral for reusability.
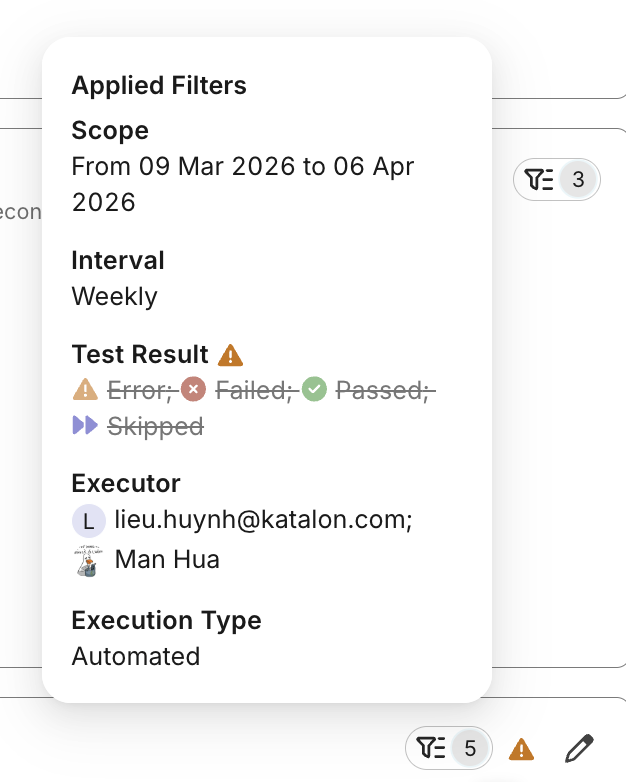
- Double-check for filtering conflicts by hovering on the Applied Filters icon. Filters that are not applied due to conflicts or overrides, are in strike-through: