Custom Widgets
This document explains how to create custom widgets in Katalon True Platform analytics.
- You must have either the Project Admin or Test Lead role to create custom widgets. Created widgets can then be viewed by those with access to the project.
- Custom widgets can be edited by different users, with the Project Admin or Test Lead role.
You can create your own custom widgets to address specific data needs for your projects:
- Track custom KPIs
- Analyze specific data subsets
- Visualize trends unique to your workflows
- Custom charts are project-scoped and currently support the Test Execution Results dataset only. Additional datasets and chart types will be supported in future releases.
Steps to create custom widgets
Check out our interactive guide, to create a widget that tracks execution status for the past 30 days:
-
You can access custom widgets in either:
- Analytics > Analytics & Trends Dashboard
- Analytics > Dashboards > Create Dashboard
-
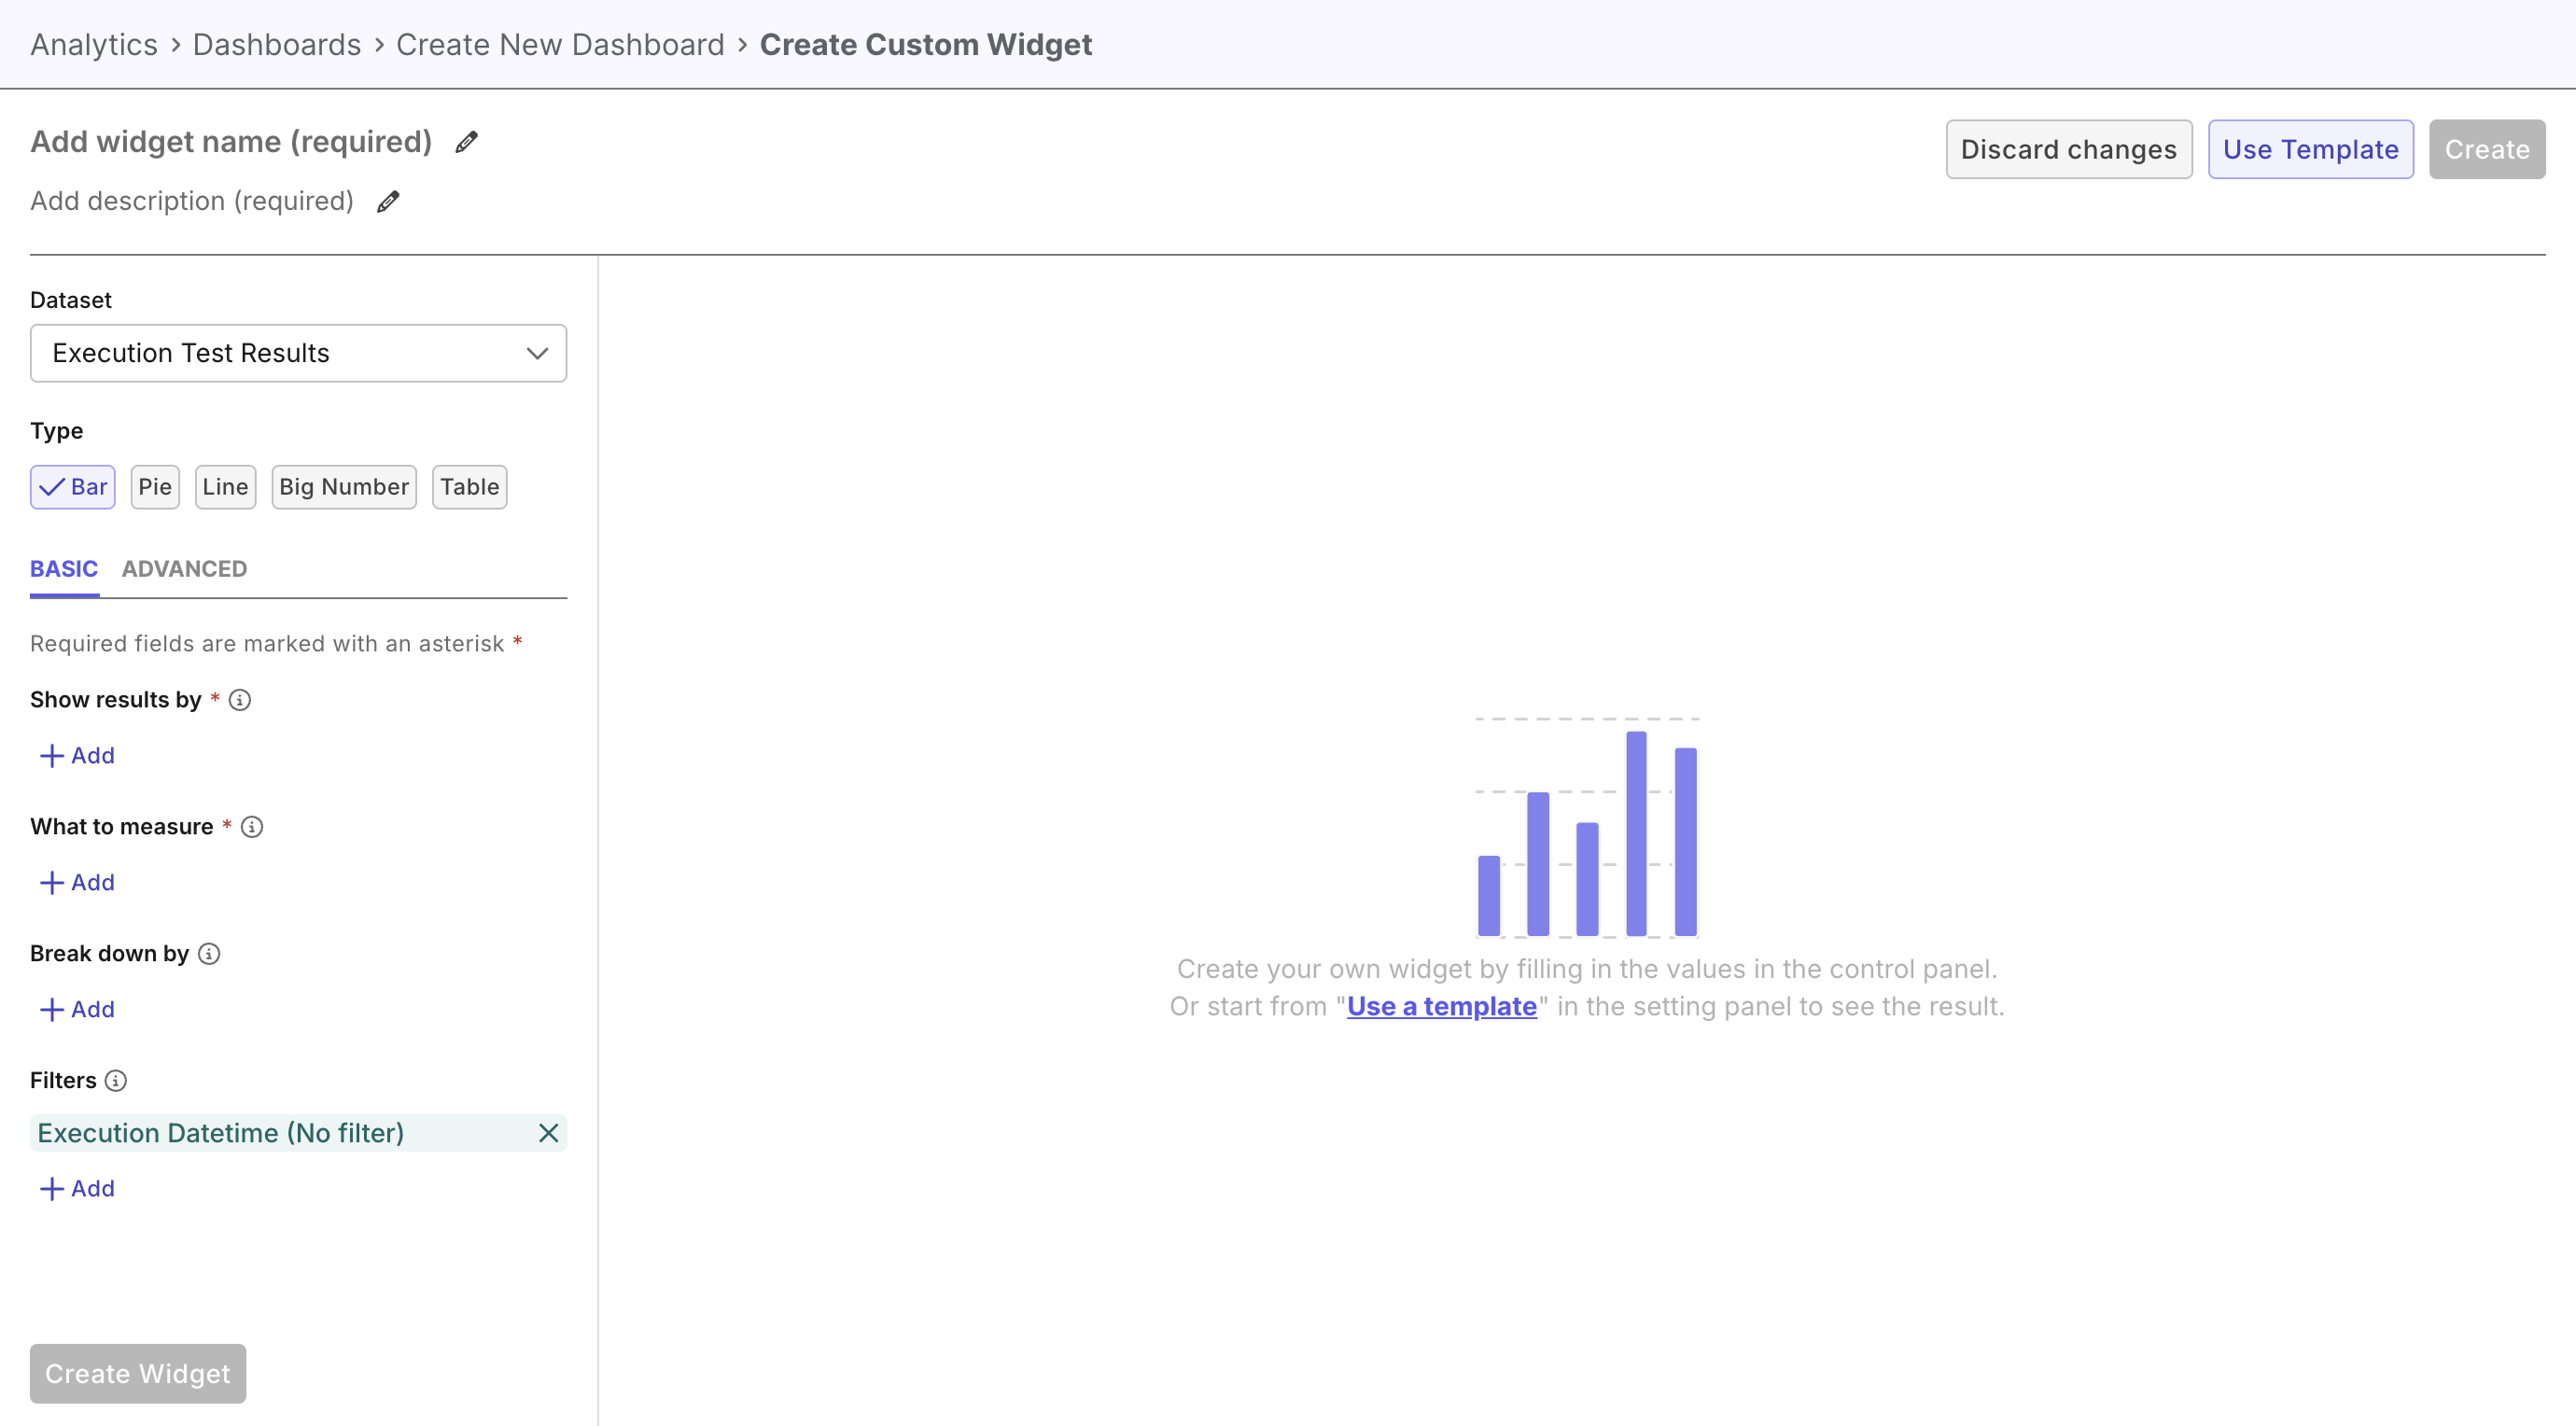
Once you're in either dashboard, click Create Custom Widget.
-
Use the chart builder to choose chart types and configure metrics. For this widget, configurations are:
- Dataset: Execution Test Results
- Chart type: Bar
- Show results by: Execution DateTime
- Break down by: Day
- What to measure: COUNT (Test Run Id)
- Group by: Execution Status
- Filters: Execution DateTime > Past 30 Days
- Advanced > X Axis > Time format: %d/%m/%Y
Preview your chart live before saving.
Choose a custom widget template to make widgets quicker.
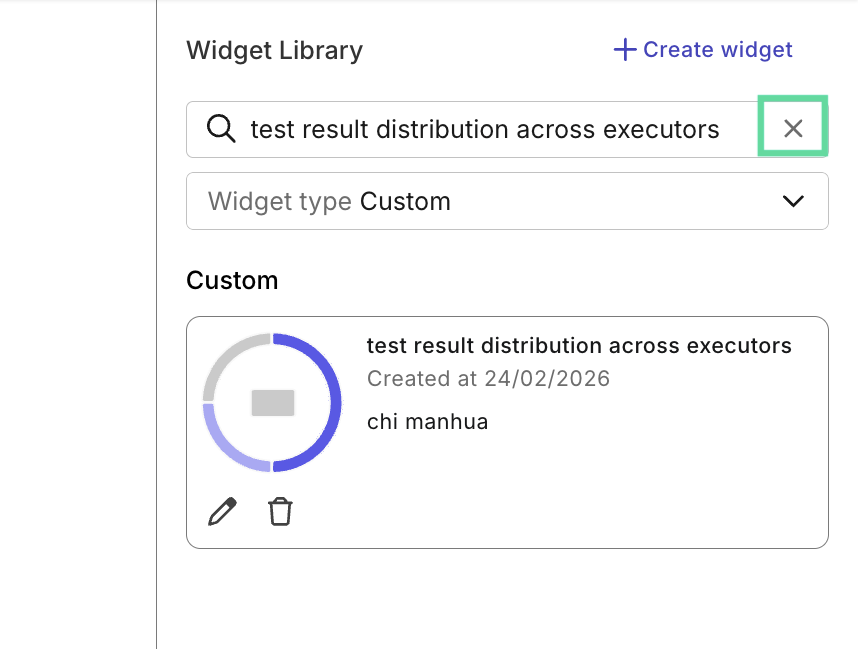
- Save your custom widget to the Widget Library under the Custom category. The library will be auto-filtered by the created widget's name - if you want to see other widgets, remove text in the widget search bar.
- Once saved, drag and drop the chart into your dashboard. Once added to the dashboard, the widget auto-adjusts to the dashboard’s selected time scope and interval.
- When widgets are added to a dashboard, the dashboard's filters override the widget's. Learn more about custom dashboards and filters at Create & Manage Dashboards.
Example custom widgets
- Team Performance Dashboard: Bar chart showing each member's execution count and average pass rate.
- Sprint Velocity Tracking: Line chart displaying daily test runs, filtered to your current sprint.
- Cross-Browser Coverage: Pie chart showing test case distribution across browsers and OS combinations.
- Detailed Execution List: Table with raw data, showing test case name, status, executor, duration, and datetime, filtered by recent runs.
- Test Suite Summary: Table with aggregated data, displaying execution counts, pass rates, and average duration, filtered by test suite.
Custom widget templates
Custom templates are a helpful starting point for exploration and brainstorming while creating widgets.
You can build a widget from scratch, or select Use Template to choose from our sample widget templates:
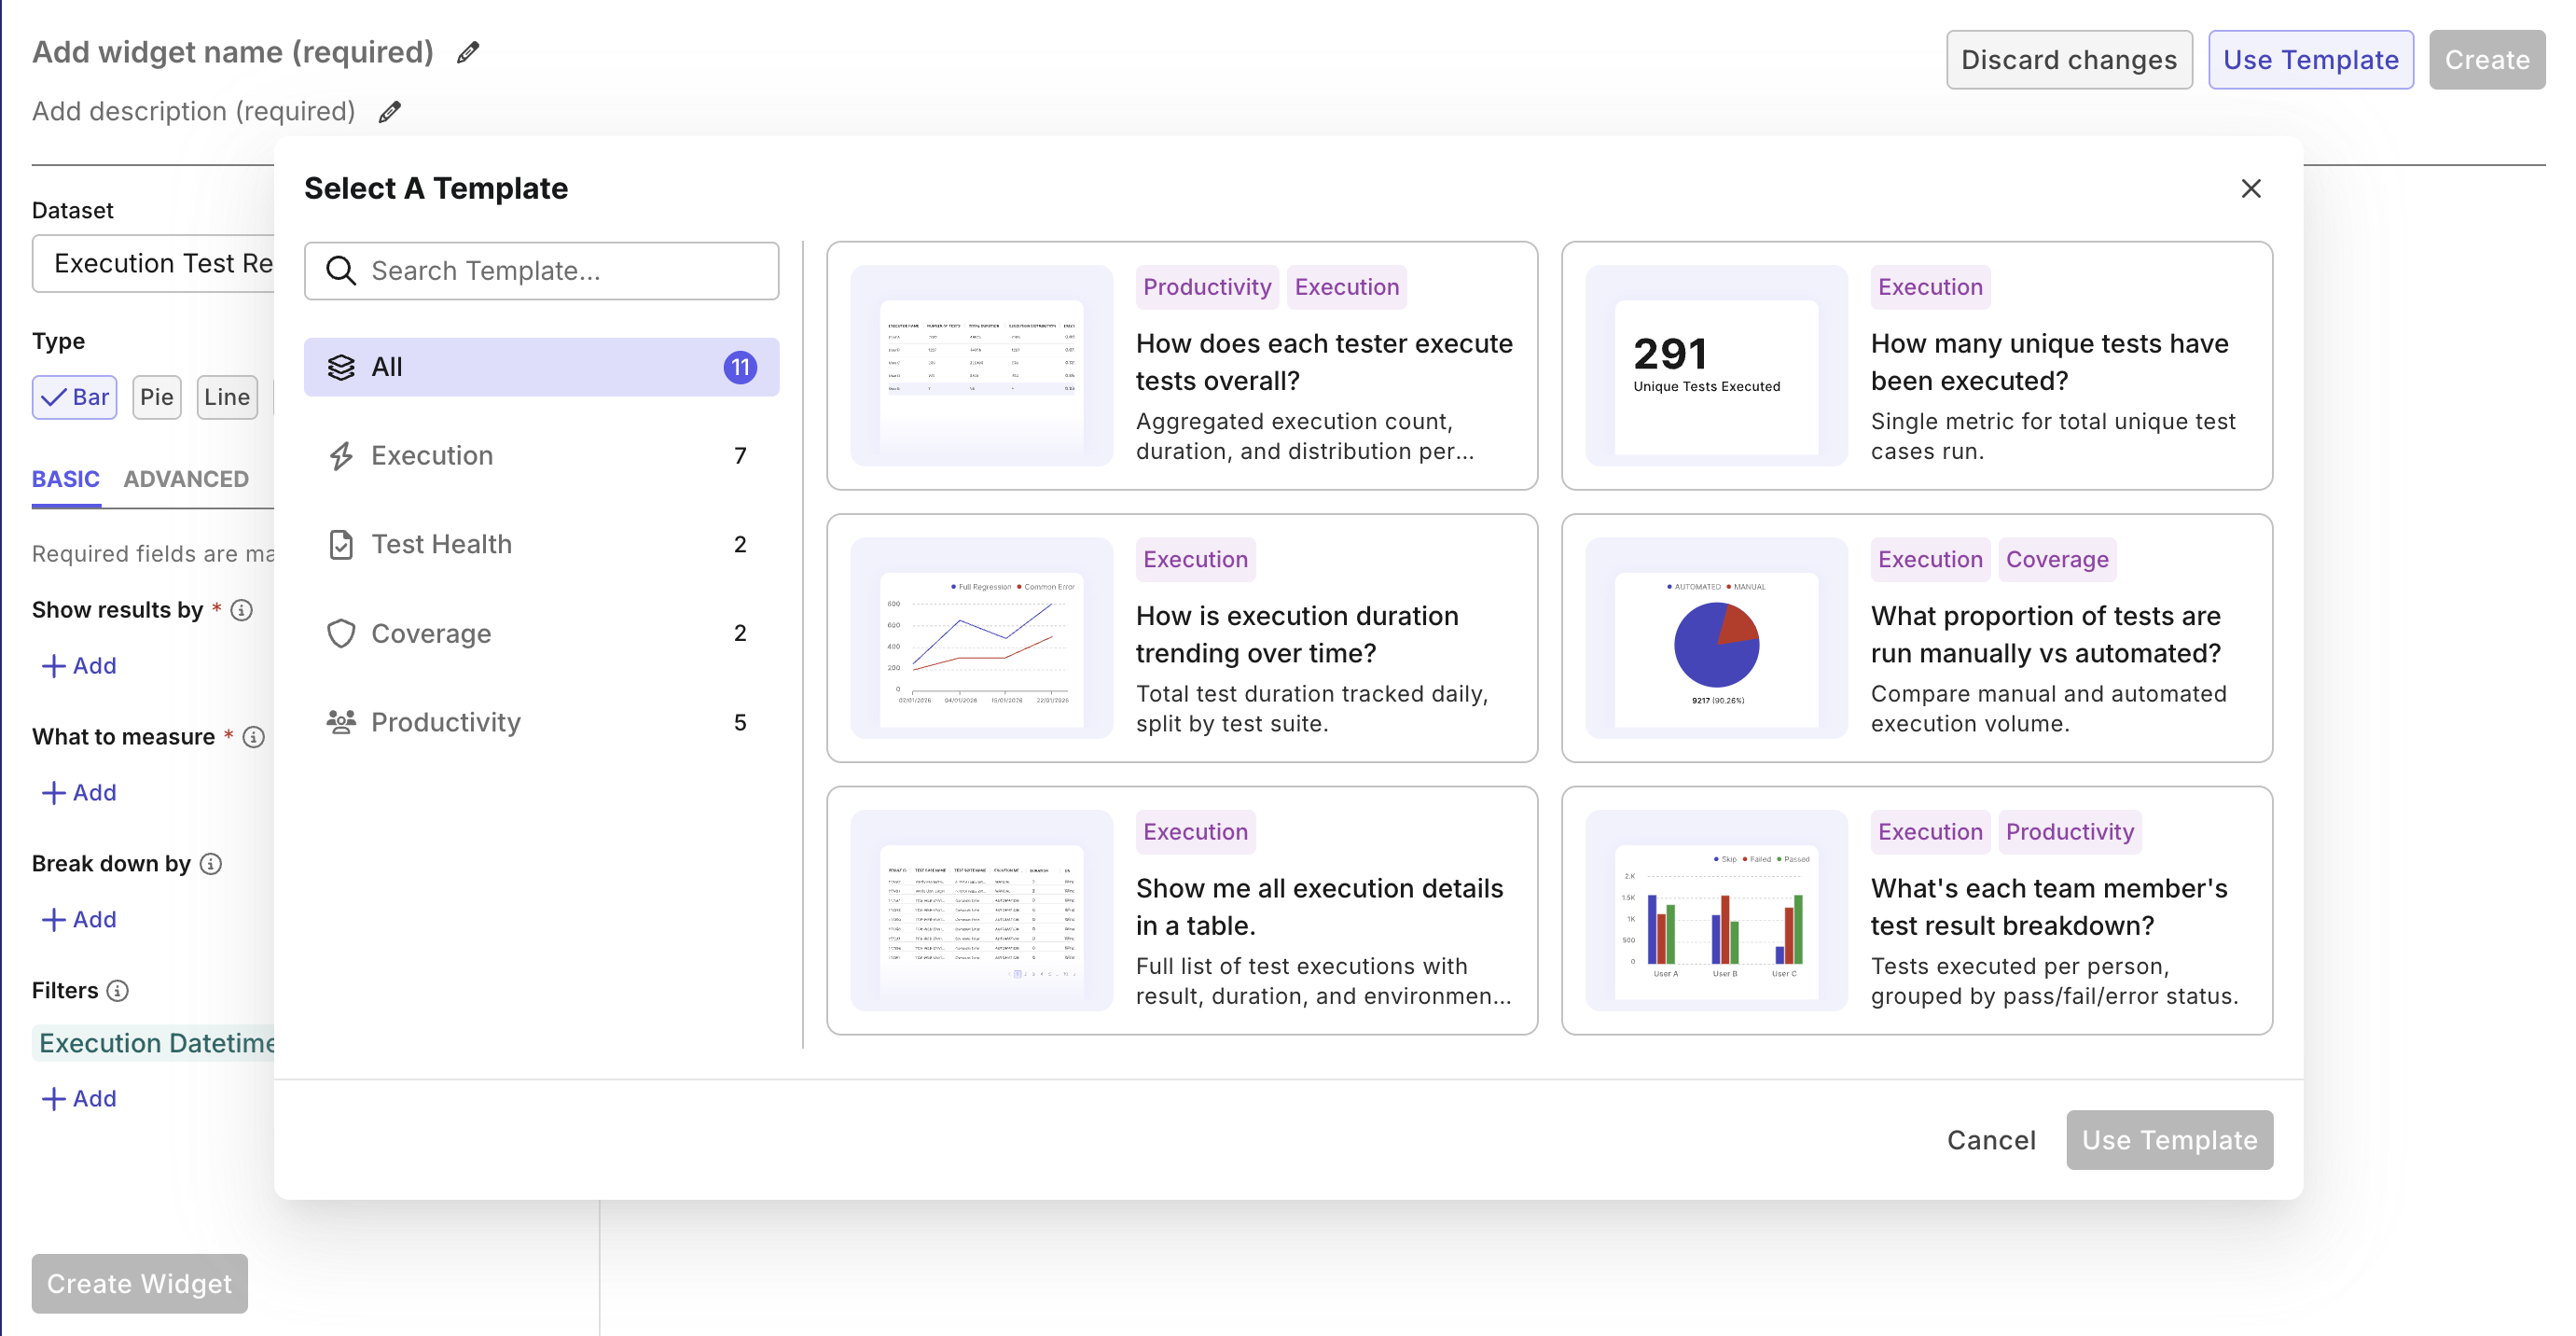
- Click Use Template. A library pops open with pre-set templates.
- Select a template.
- Click Use Template. Pre-configured fields will be applied for the template. You’ll then see a preview just like manual creating, for adjustments.