Effective debugging best practices in Katalon Studio
This document explains best practices for effective debugging sessions, in Katalon Studio.
Scenario
The primary scenario addressed by these debugging features is the high volume of repetitive editing and re-running required during test case development and maintenance. When a complex automated test fails, manually executing the entire script after every minor code change is highly inefficient.
The Katalon Studio debugging utilities are designed for:
-
Root Cause Analysis: Quickly pausing execution to inspect variables, breakpoints, and the state of the application at the exact point of failure.
-
Efficient Test Execution: Skipping unnecessary setup steps or previously successful steps to resume execution directly from a specific point.
Purpose and strategic value
The strategic value of Katalon Studio's debugging tools is centered on drastically improving the efficiency and speed of the test maintenance lifecycle.
| Feature | Purpose | Strategic Value |
|---|---|---|
| Debug Mode | To pause execution at pre-defined breakpoints. | Allows precise inspection of variables and object states to quickly identify the root cause of an error. |
| Run from here / Debug from here | To resume or start execution from an arbitrary line of code. | Saves significant time by eliminating the need to re-execute lengthy preceding steps, accelerating the fix verification process. |
| Enable/Disable Steps | To temporarily ignore or skip specific test steps. | Useful for isolating problematic sections of code or testing changes without altering the original script structure. |
Key Takeaways
-
Efficiency is Key: The core purpose of these tools is to save precious time by avoiding tedious, repetitive full test re-runs.
-
Debug Perspective: The standard Debug mode opens a dedicated perspective (similar to Eclipse) offering views for Variables, Breakpoints, and Expressions.
-
Advanced Features Requirement: Features like Run from here and Debug from here require an active Katalon Studio license.
-
Browser Session Persistence: Advanced execution methods require the test to start a browser and keep the session active and not terminated after the execution finishes.
Requirements
To fully utilize all debugging functionalities, ensure the following are in place:
Licensing requirement
- An active Katalon Studio license is mandatory for using the Debug: Run from here and Debug from here features.
Project configuration
-
For using session-based debugging (Run from here or Debug from here), you must configure the project to keep the browser running.
-
Navigate to Project > Settings > Execution.
-
Uncheck the option(s) to Terminate browser/application after a test case/suite finishes under Post-Execution Options.
-
Test case readiness
-
The test case must be open and accessible in both the Manual and Script views.
-
For session-based debugging, you must manually ensure that a browser instance (Chrome, Firefox, or Edge Chromium) has been previously launched by Katalon Studio and is still running.
Best practices steps
Standard debug mode using breakpoints
This is the recommended approach for deep code investigation in the Script view.
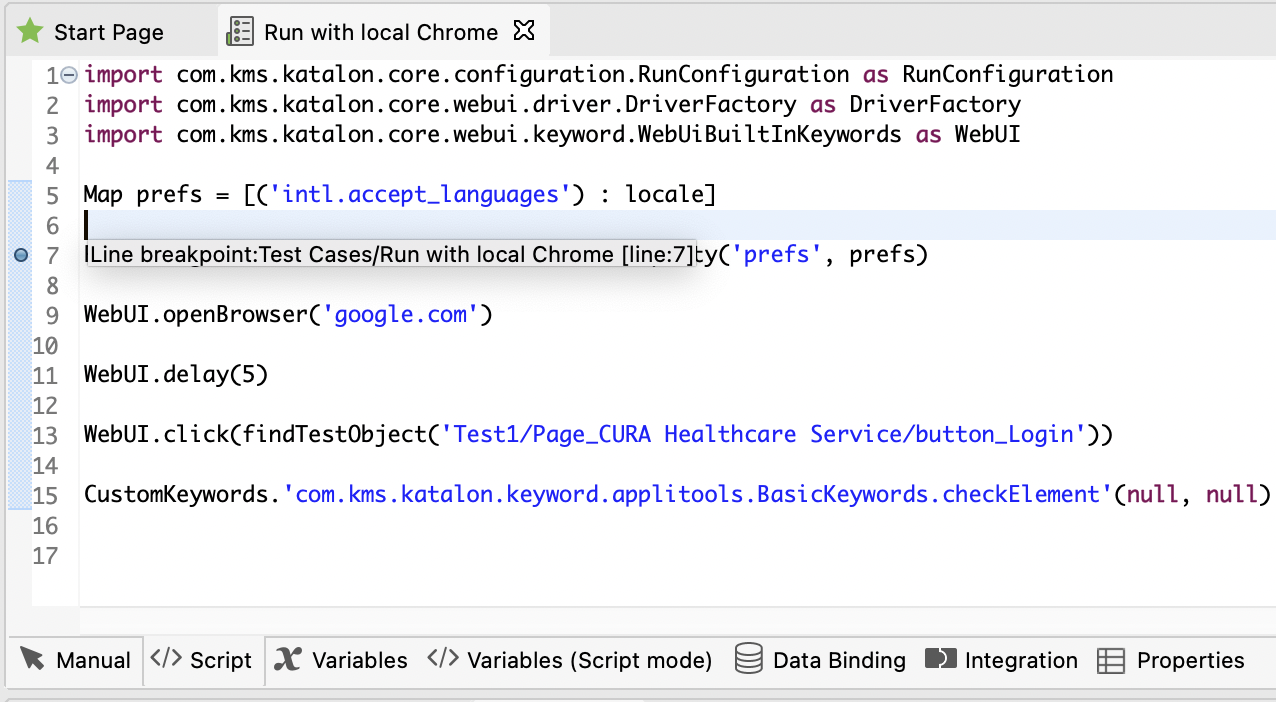
- Set Breakpoint: Open the test case, switch to the Script view, and double-click the leftmost side of the script editor on the line where you want execution to pause. A blue dot indicates a successful breakpoint.
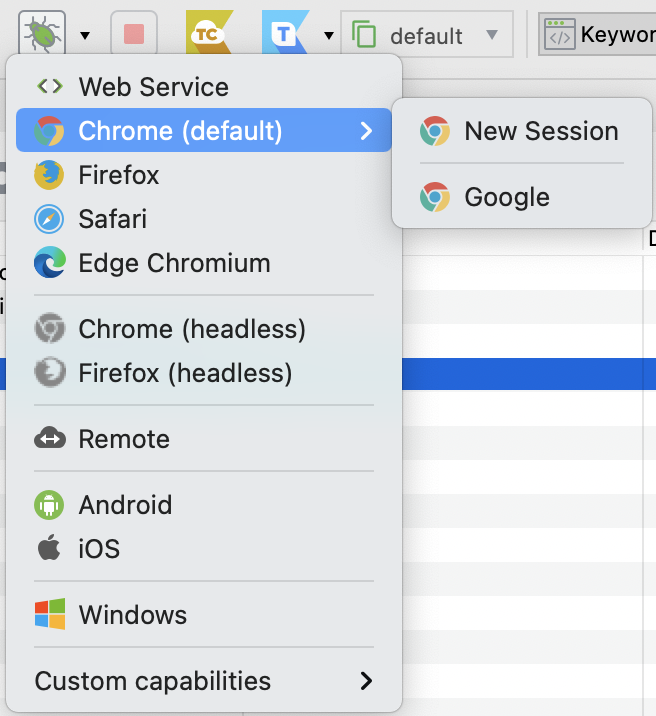
- Start Debug: From the main toolbar, select your target browser and click the Debug icon.
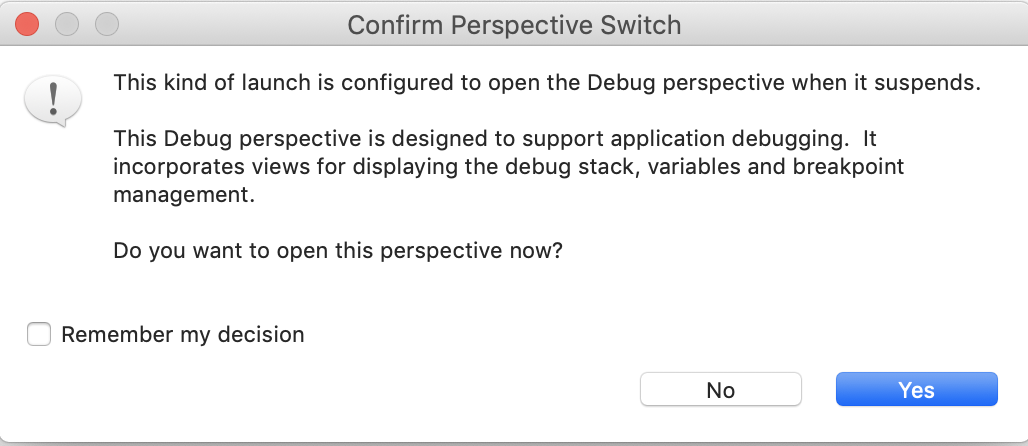
- Confirm Perspective: When prompted to display the Debug perspective, select Yes.
-
Navigate Execution: Once paused at the breakpoint, use the Debug toolbar commands to control the flow:
-
Resume: Continues execution until the next breakpoint.
-
Step Into: Enters the function or keyword being called.
-
Step Over: Executes the current line and moves to the next, skipping function entry.
-
Terminate: Stops the debugging session immediately.
-

- Inspect Data: Use the Variables View to track the values of local and global variables, and the Expressions View to evaluate custom data queries.
Debug from here (advanced start point)
This is the fastest method to jump directly to a specific point in a running test session.
-
Ensure Persistence: Verify the Project Settings are configured to prevent browser termination.
-
Launch Session: Run the test case at least once, or use the Open Browser step, to ensure a live browser session is available.
-
Set Breakpoint: Switch to the Script view and set a breakpoint where you want the execution to pause.
-
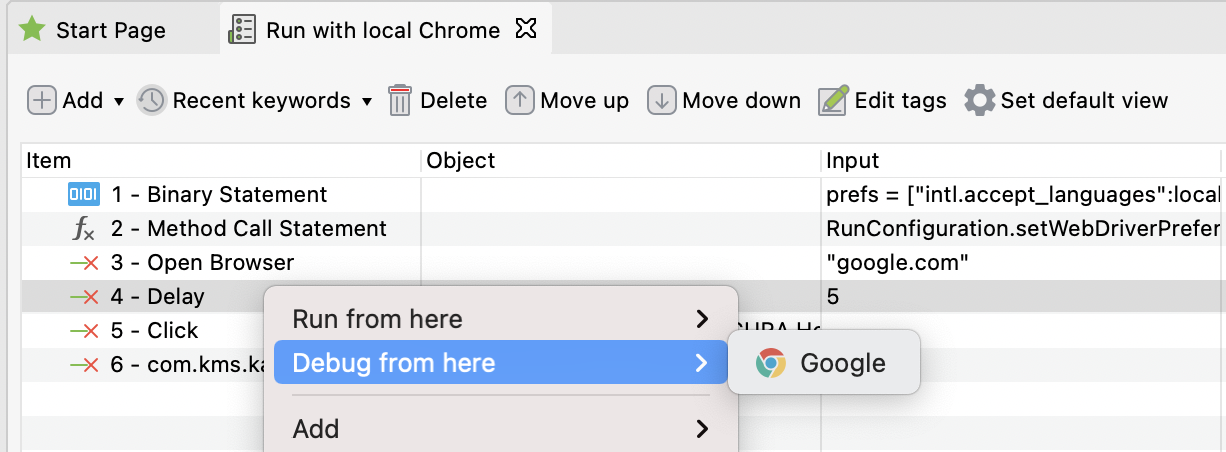
Initiate Debug: Switch to the Manual view, right-click on the step before the intended pause point, and select Debug from here.
-
Select Instance: Choose the currently running browser instance to start execution from that step.
Conclusion
By adopting these focused debugging methodologies—particularly leveraging Debug from here to resume existing sessions—your team can significantly reduce the iteration time associated with fixing errors. This structured approach moves beyond simply re-running tests and enables efficient, surgical investigation into the root cause, leading directly to higher quality and more stable automation test cases.
See all best practice documents at Katalon products best practices.