View network and performance data
- This feature is currently available on Windows and macOS only.
Test Execution - Cloud provides built-in tools to help you analyze how your application behaves during automated test runs. You can view:
- App Profiling: Resource usage and performance data for mobile apps.
- Network Logs: API calls and browser network traffic during tests.
To access these logs, you must first enable them using desired capabilities in Katalon Studio.
App profiling
App profiling captures a real-time snapshot of your mobile app performance during test execution. It includes CPU, memory, battery, network, disk I/O usage, as well as frame rate and startup time.
To enable the App profiling data, you need to set the enableAppProfiling desired capability in Katalon Studio.
- Go to Project Settings > Desired Capabilities and select Cloud Execution.
- Add a
katalon:optionsproperty, set Type asDictionary, then click the....

- In the Dictionary Property Builder dialog, add the boolean property
enableAppProfiling=true. Click OK to save the settings.
View app profiling
After the test completes:
- Log in to Test Execution - Cloud Web App and go to Execution.
- Select your test run.
- Click the App Profiling tab for performance metrics.
| Metric | Description |
|---|---|
| CPU Performance/CPU Usage | Shows how quickly the CPU can retrieve and interpret instructions. It shows the average CPU utilization by computations of the app. This functionality detects CPU leaks and over-usage which lead to overheating, battery drains, crashes, and performance issues. |
| Memory Performance/Memory Usage | Determines the amount of physical memory allocated to the app’s process. It allows you to track and analyze your memory footprint so you can identify potential leaks and inefficient resource usage. |
| UI Responsiveness | Allows you to quickly assess the app’s health by tracking how long it takes for an app to respond to action and monitoring the delay of the app’s UI responsiveness. Currently, this metric is only available for Android devices. |
| Disk Usage | Provides insights into how much disk space is being used by both the system and the application during a session. |
| Network Usage | Provides insights into how your app uses network resources, helping you optimize data transfer and ensure efficient performance. |
| Temperature | Allows you to monitor battery temperature during app usage, identify features causing excessive heat generation and reduce the risk of device overheating. |
| Battery Consumed | Monitors how your app impacts battery drain, allows you to identify features that are energy hogs, and optimize them. |
| Frames per second (FPS) | Real-time measurement of rendering performance throughout the session. |
| Frame Issues | Visualizes rendering performance of:
|
Network logs
A network log provides detailed browser performance data, including real-time record of all API calls, network requests, and responses exchanged between the application under test (web, mobile, API) and its backend services during an automated test run. It includes request/response headers, bodies, status codes, and timings in the HAR format.
To enable the Network data, you need to set the enableNetwork desired capability in Katalon Studio.
- Go to Project Settings > Desired Capabilities and select Cloud Execution.
- Add a
katalon:optionsproperty, set Type asDictionary, then click the....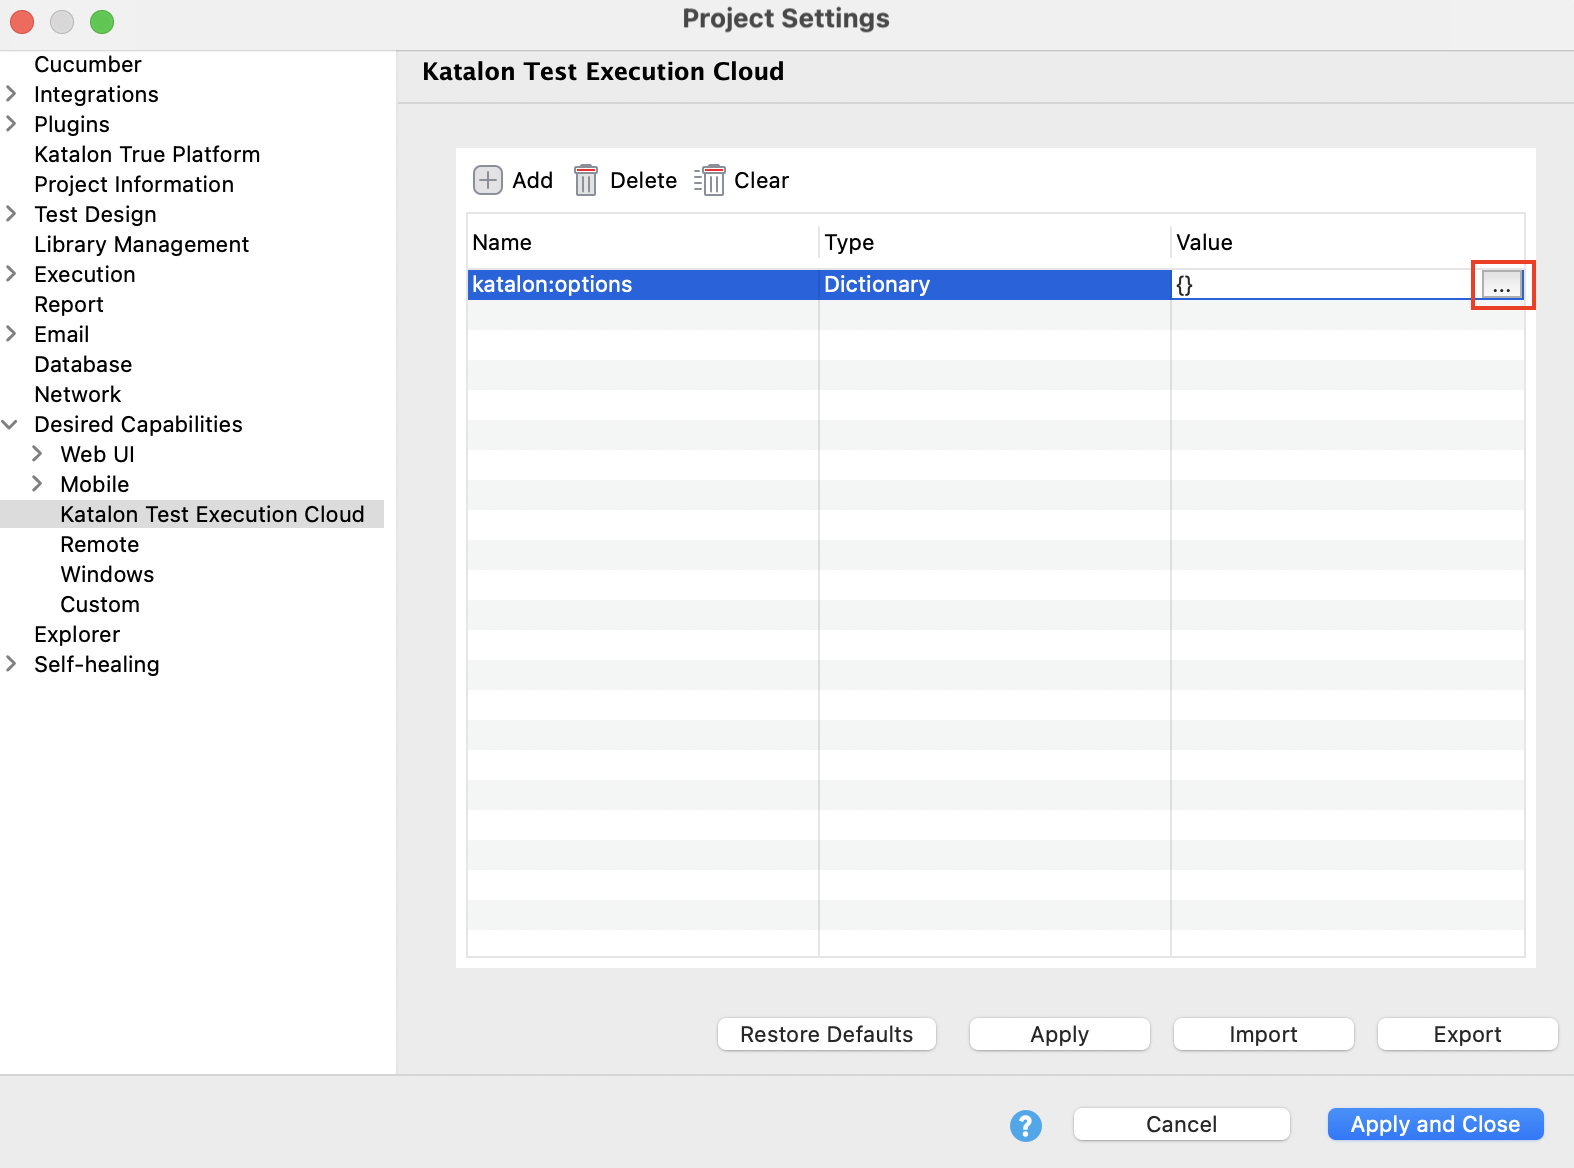
- In the Dictionary Property Builder dialog, add the boolean property
enableNetwork=true. Then click OK.
View network log
You can access network logs from the Test Execution - Cloud Execution monitoring view.
After the test completes, log in to Test Execution - Cloud Web App and go to Execution. Select your test run and click the Network tab to explore captured requests and responses.
- Use quick filter buttons to narrow down the list by request type: JS, CSS, IMG, MEDIA, DOC.
- Toggle the Errors Only switch to view failed requests, making it easier to detect problems.
- Click Download HAR to export the entire network traffic in HAR format. This is useful for debugging in external tools like Chrome DevTools or HAR viewers.
Troubleshooting
When enabling enableNetwork: true, traffic is sent through a proxy to capture it. This proxy might be blocked by high-security services that use SSL/Certificate Pinning, such as Firebase Cloud Messaging (FCM), Google Sign-In, or many banking APIs.
Your app may fail to retrieve an FCM token, crash on login, or have other secure connections fail.
Solution: If your test relies on these services, you must run it without this capability or set it to enableNetwork: false.