View test artifacts of Test Execution - Cloud execution via Studio
This document explains how to retrieve test artifacts generated during Test Execution - Cloud test executions in Katalon Studio. Test artifacts — such as device logs, Appium logs, media files, and performance data — help you debug failures and analyze test behavior.
To access these artifacts, you first need to locate the executionSessionId for your test session, then authenticate with Katalon API to download the files you need.
-
Get the
executionSessionId:-
For Desktop Browser or Mobile Browser tests, you can find the
executionSessionIdin the Console Log after executing the test.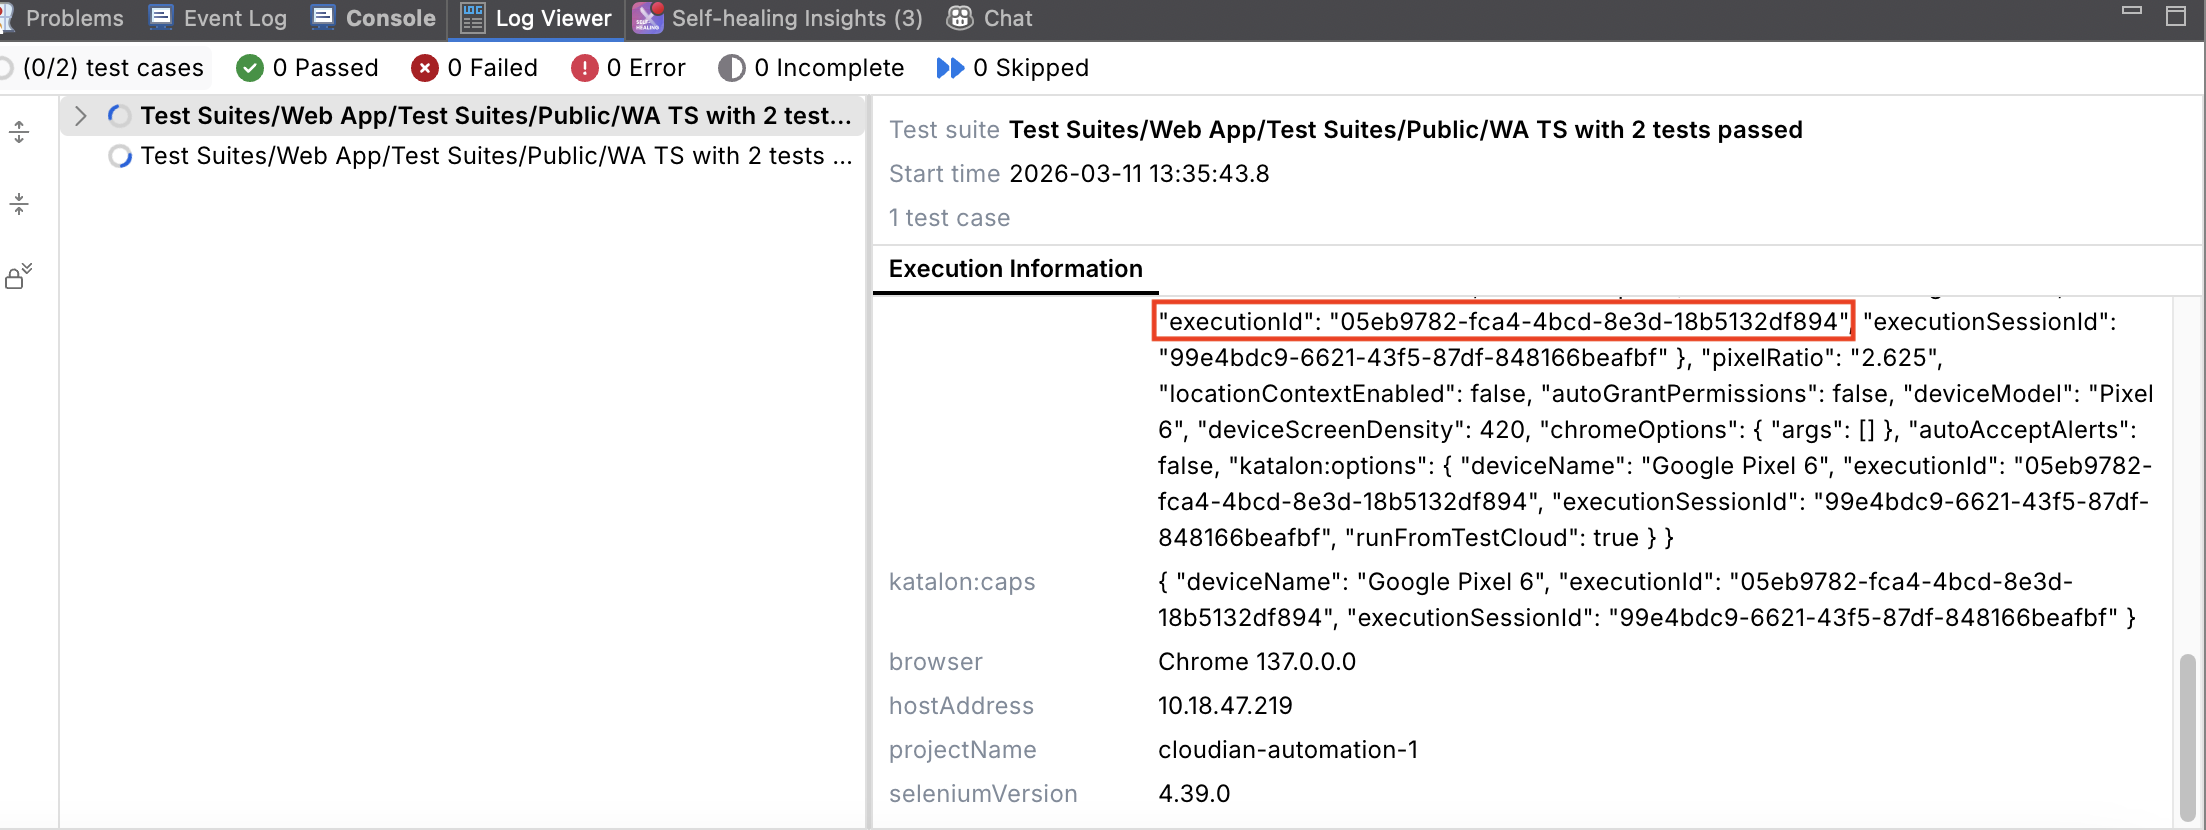
-
For Mobile Native App tests, add the following script to the end of the test case to extract the
executionSessionId. After the test execution, you can find theexecutionSessionIdin the Console Log.import com.kms.katalon.core.mobile.keyword.internal.MobileDriverFactory
import org.openqa.selenium.Capabilities
import io.appium.java_client.AppiumDriver
AppiumDriver<?> driver = MobileDriverFactory.getDriver()
Capabilities actualCapabilities = driver.getCapabilities()
KeywordUtil.logInfo("Execution Session ID: " + actualCapabilities.getCapability("kt:requestId"))
-
-
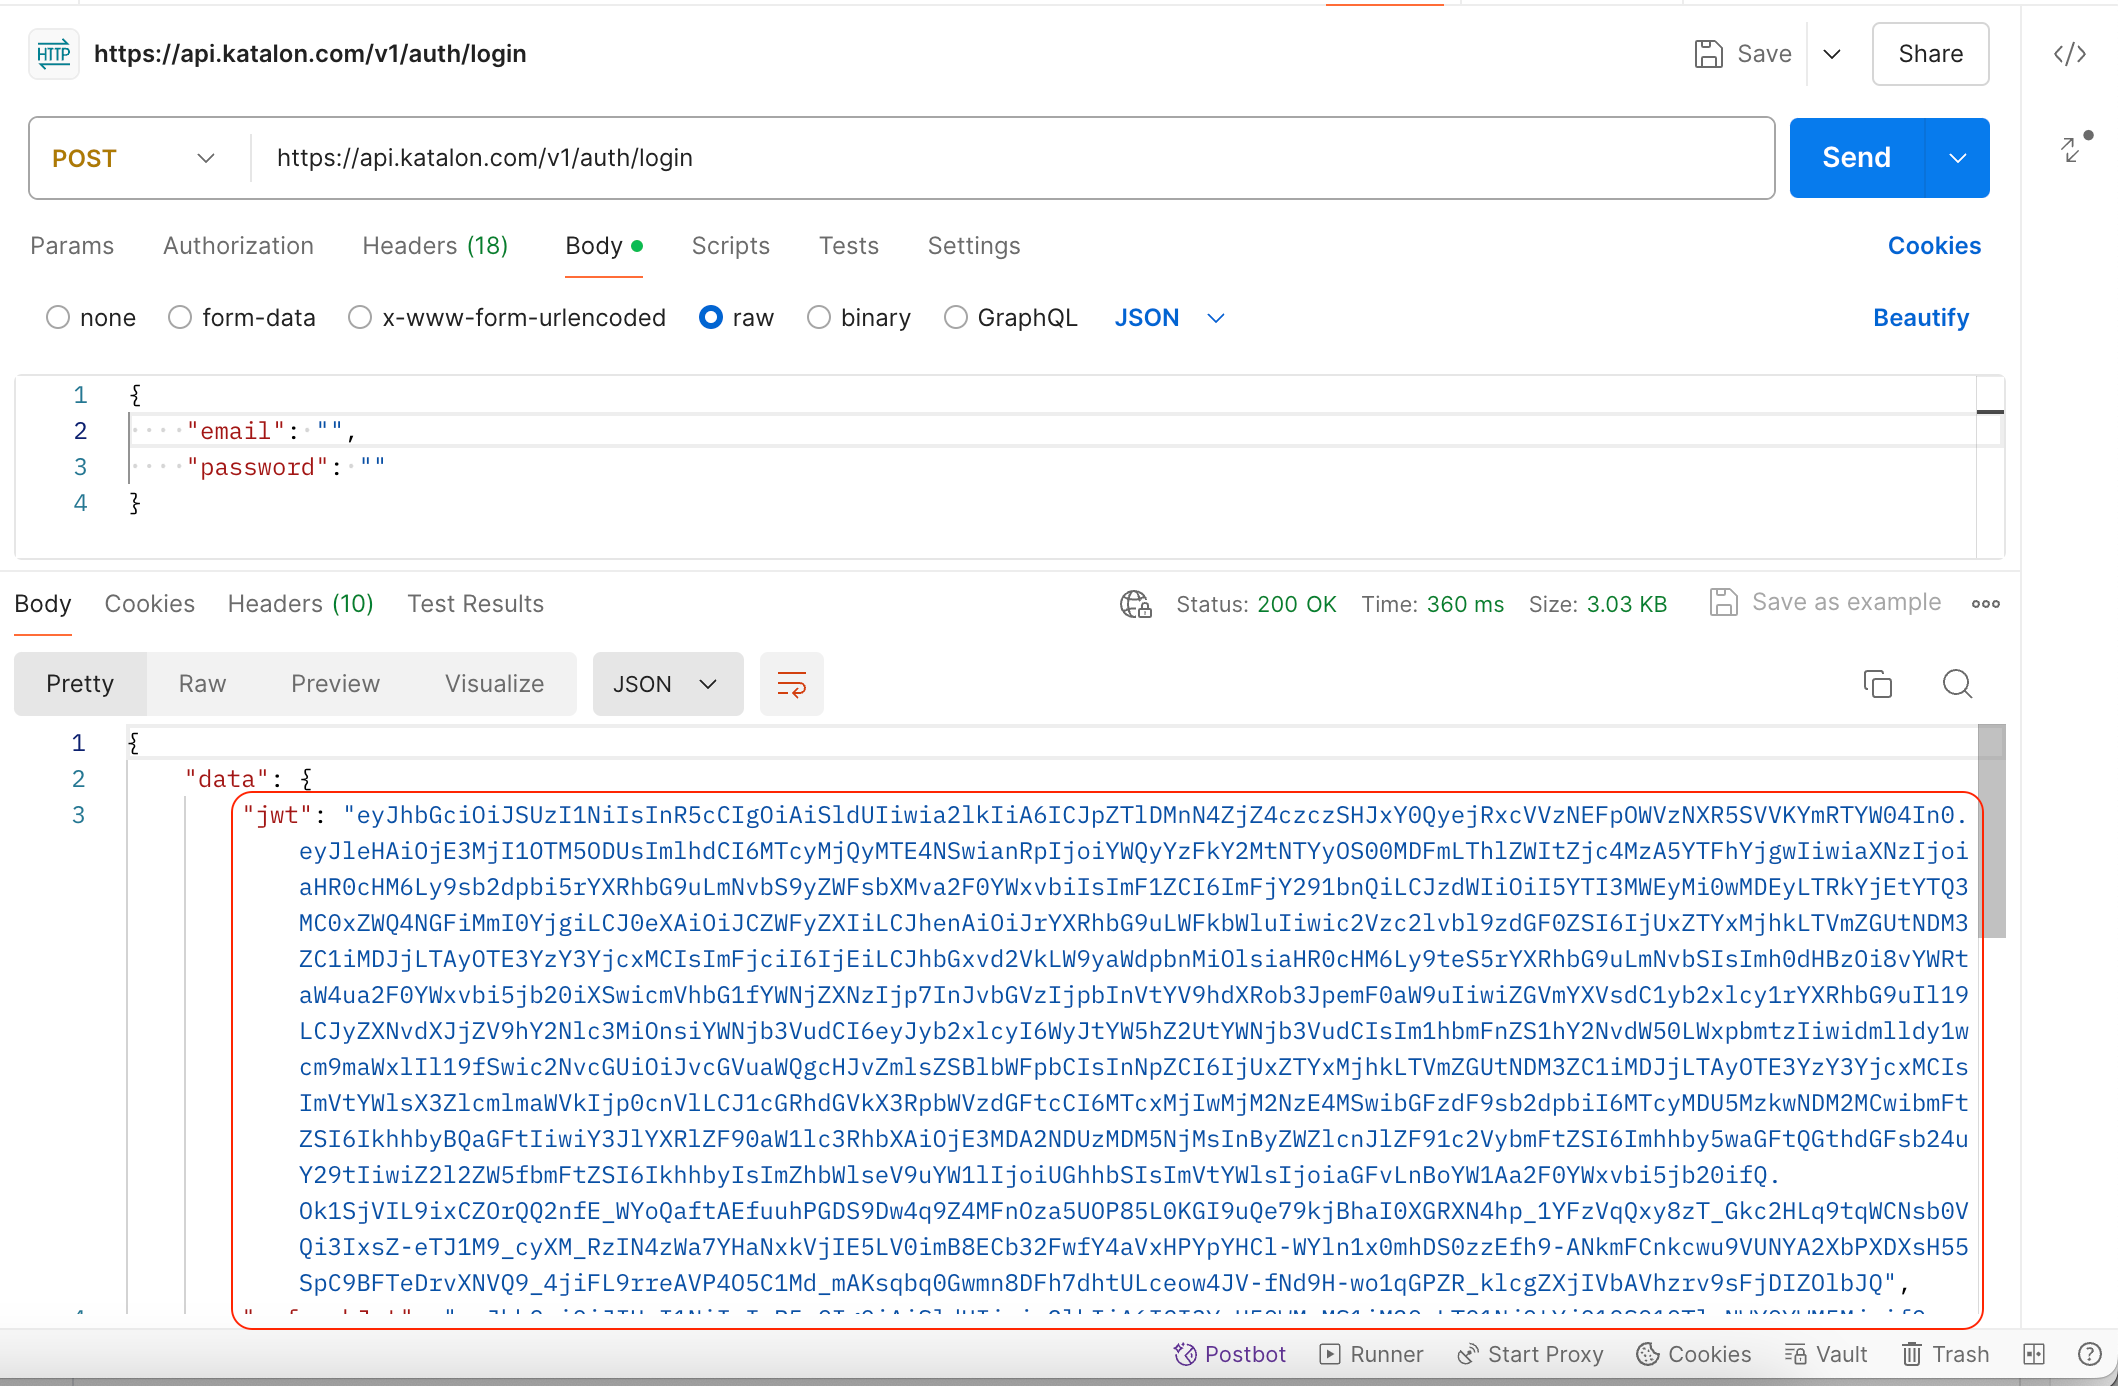
Authenticate to the Katalon API
curl --location 'https://api.katalon.com/v1/auth/login' \
--header 'Content-Type: application/json' \
--data '{
    "email": "<your-email>",
    "password": "<your-password>"
}'
This returns an authorization token that you use to get the test artifacts.
Get session outputs
-
Retrieve the test output ID for the given
executionSessionId.https://testcloud.katalon.com/ees/sessions/{sessionId}/outputs?action=DOWNLOAD- HTTP Method: GET
- Authentication: Bearer Token
sessionId: The uniqueexecutionSessionIdfrom Step 1.
For example, this request returns the output list and highlights the
outputId.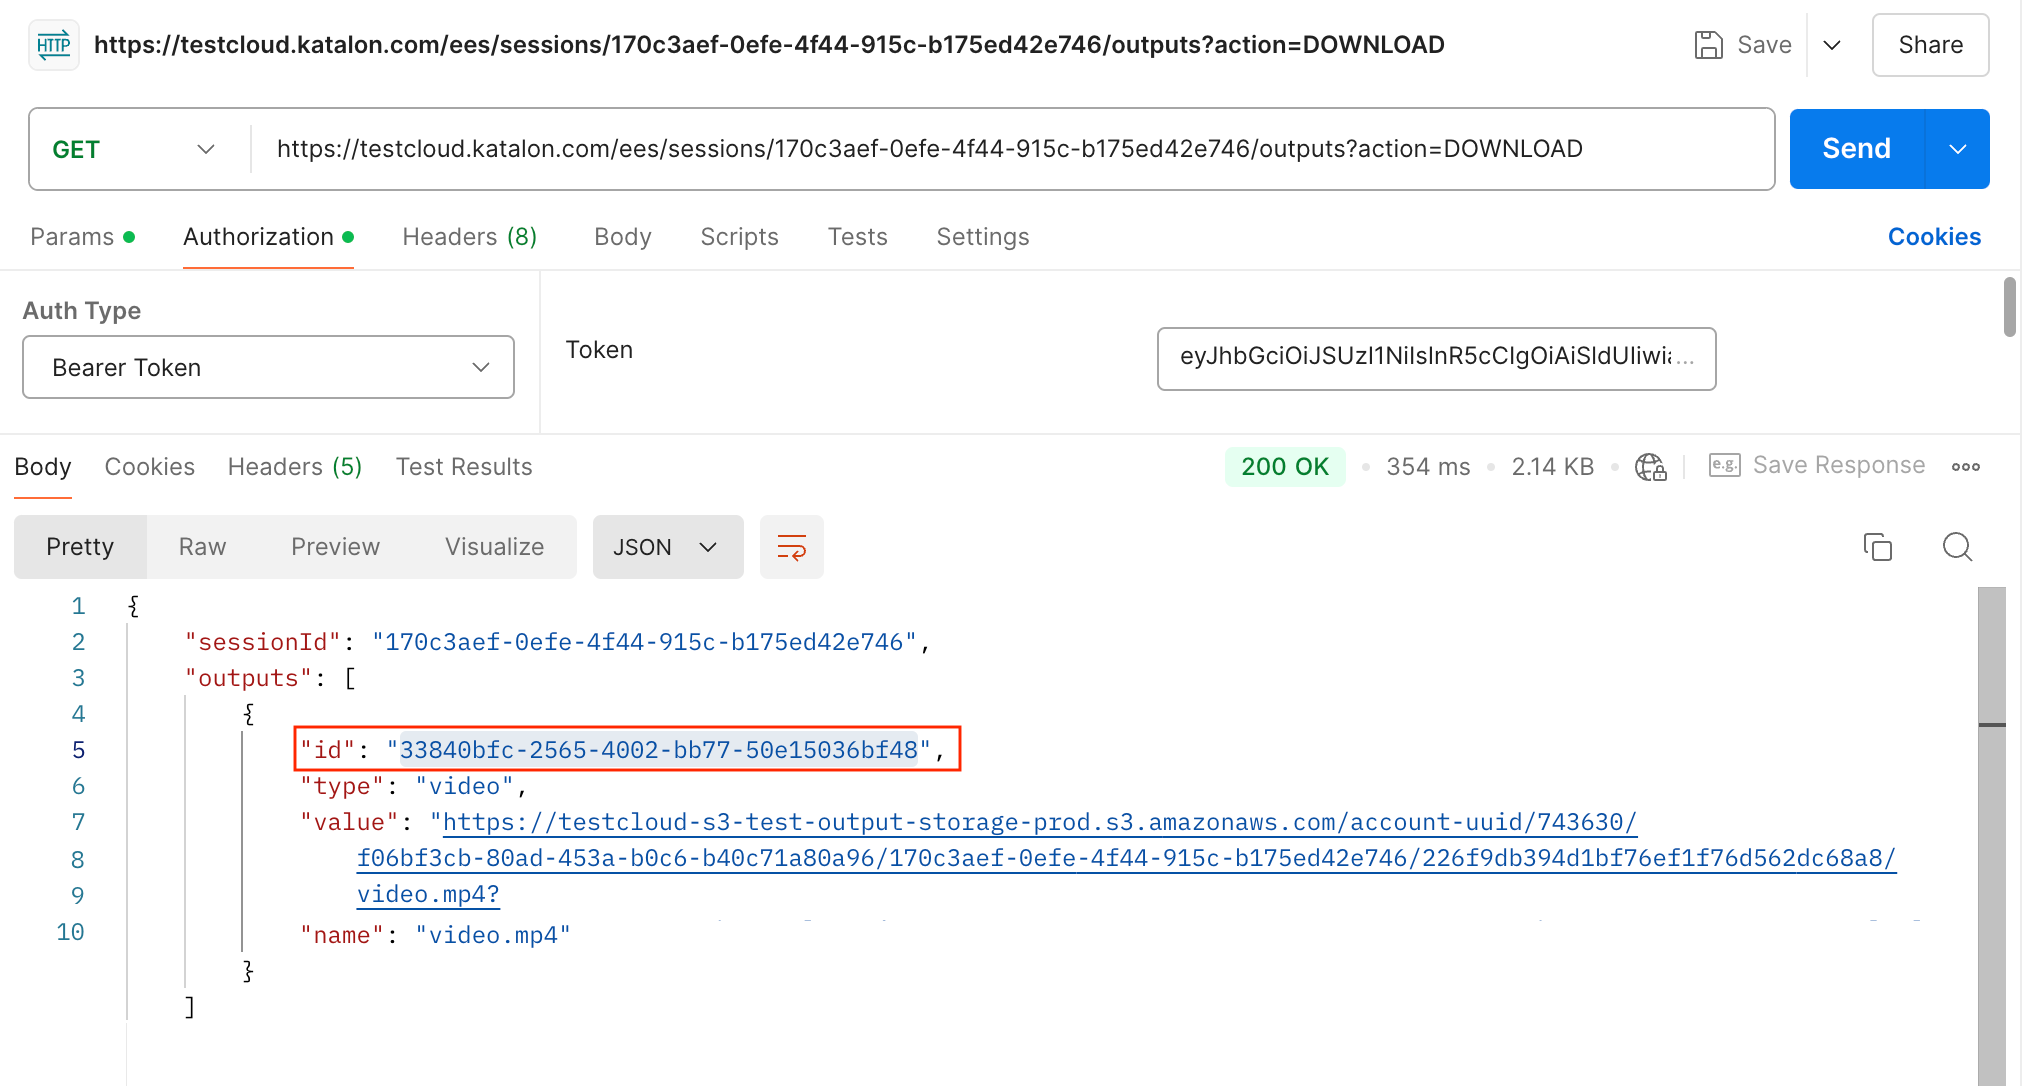
Download a specific test artifact
-
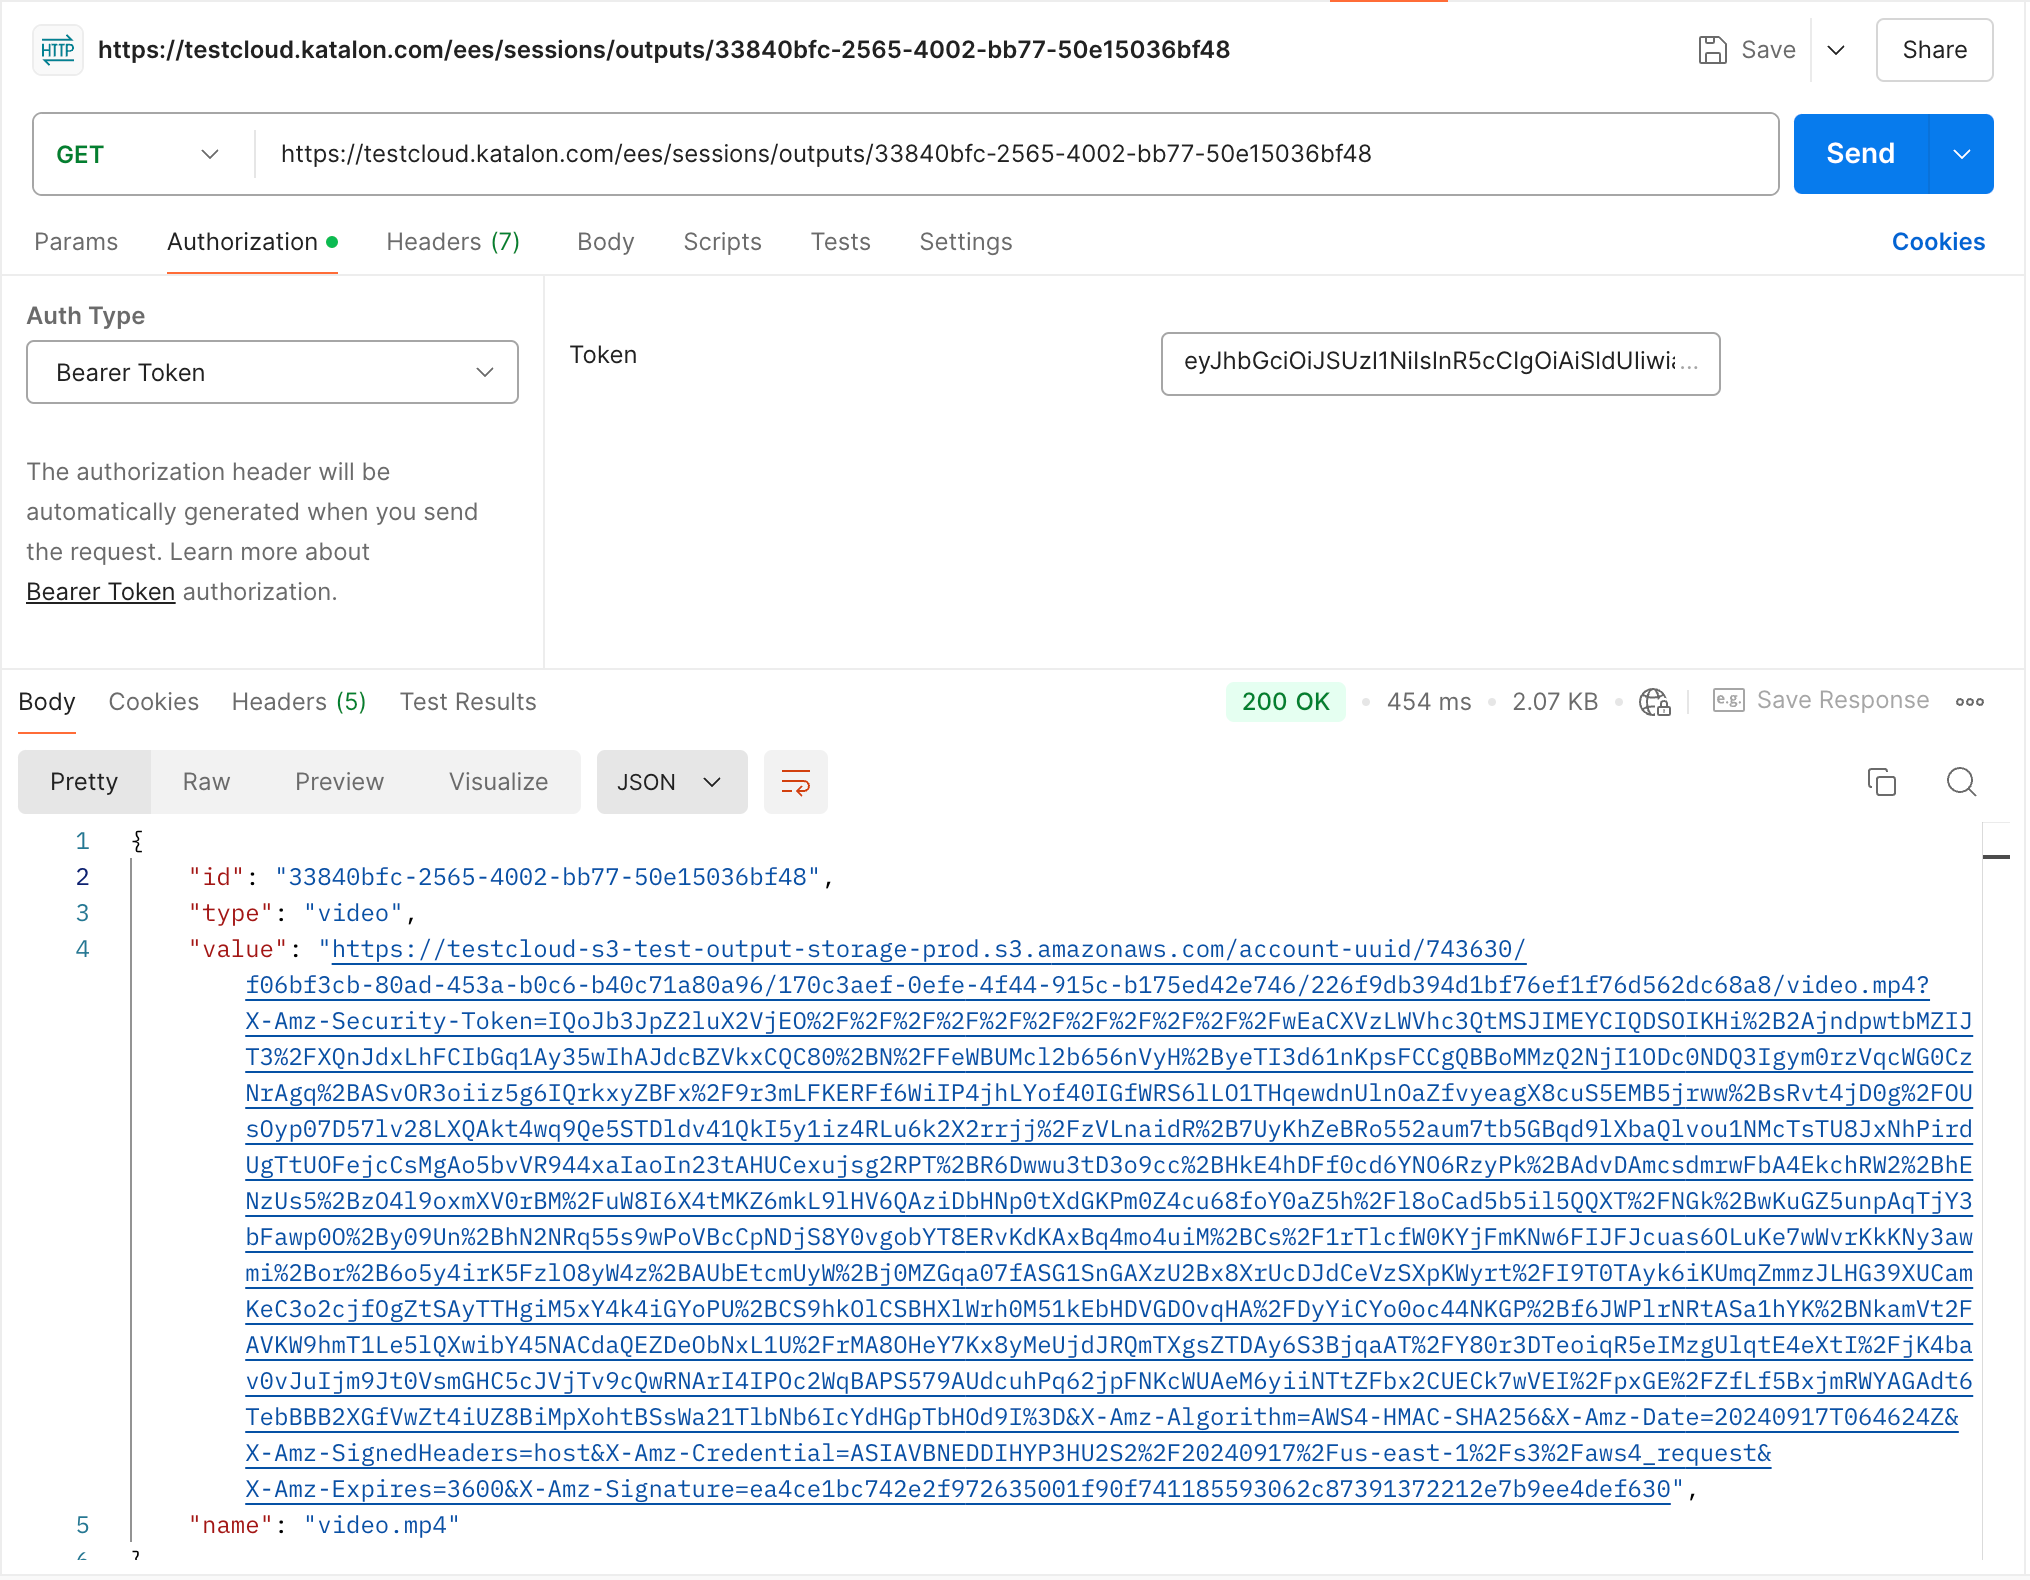
Download the artifact you need, such as a device log, Appium log, or media file.
https://testcloud.katalon.com/ees/sessions/outputs/{outputId}- HTTP Method: GET
- Authentication: Bearer Token
outputId: The unique ID of the output file from the previous response.
Example:
https://testcloud.katalon.com/ees/sessions/outputs/3ca98950-f6a7-4621-b054-141d214d12b4
You receive a response that includes a link to download the file.
Application performance analytics (Profile)
Test Execution - Cloud provides the profiling capability for tracking performance metrics such as CPU usage, memory consumption, and network activity of a mobile app under test. Test Execution - Cloud outputs a raw data file that you can analyze directly or visualize using your preferred tools to gain detailed insights.
In Katalon Studio, go to Project Settings > Desired Capabilities > Cloud Execution and add the Boolean type profiling:true property in katalon:options.
After your test execution, you can use the API call above to retrieve the data file.