Katalon Studio Tracer
This document explains how you can use Katalon Studio Tracer (beta) to visually debug failures and flaky behavior across Katalon Studio (KS) and Katalon Runtime Engine.
Starting Katalon Studio version 11.0.0, Katalon Studio Tracer is available as a beta feature. In the beta phase, it is for evaluation purposes only and not recommended for production use.
Tracer is an execution tracing capability that records everything that happens during a WebUI test run and packages it into trace files that you can later view and troubleshoot. This allows you to understand exactly what the browser was doing at each step—eliminating guesswork when diagnosing failures.
For each test step, Tracer captures:
-
The before/after DOM snapshots for each moment. This is especially useful for debugging flaky locators and dynamic web apps.
-
Network requests correlated with each action. This helps with understanding issues related to backend failures, slow APIs, or missing data.
-
Console logs & JavaScript errors, for troubleshooting.
-
Storage and browser state. This helps diagnose issues related to authentication, caching,…
Use Tracer in Katalon Studio
- Google Chrome browser (Tracer currently supports Chrome only)
- (Optional) Project integrated with Katalon True Platform to upload and view trace files online
- Enable Tracer
In Katalon Studio (KSE), you can enable Tracer in Project Settings > Execution > Tracer.
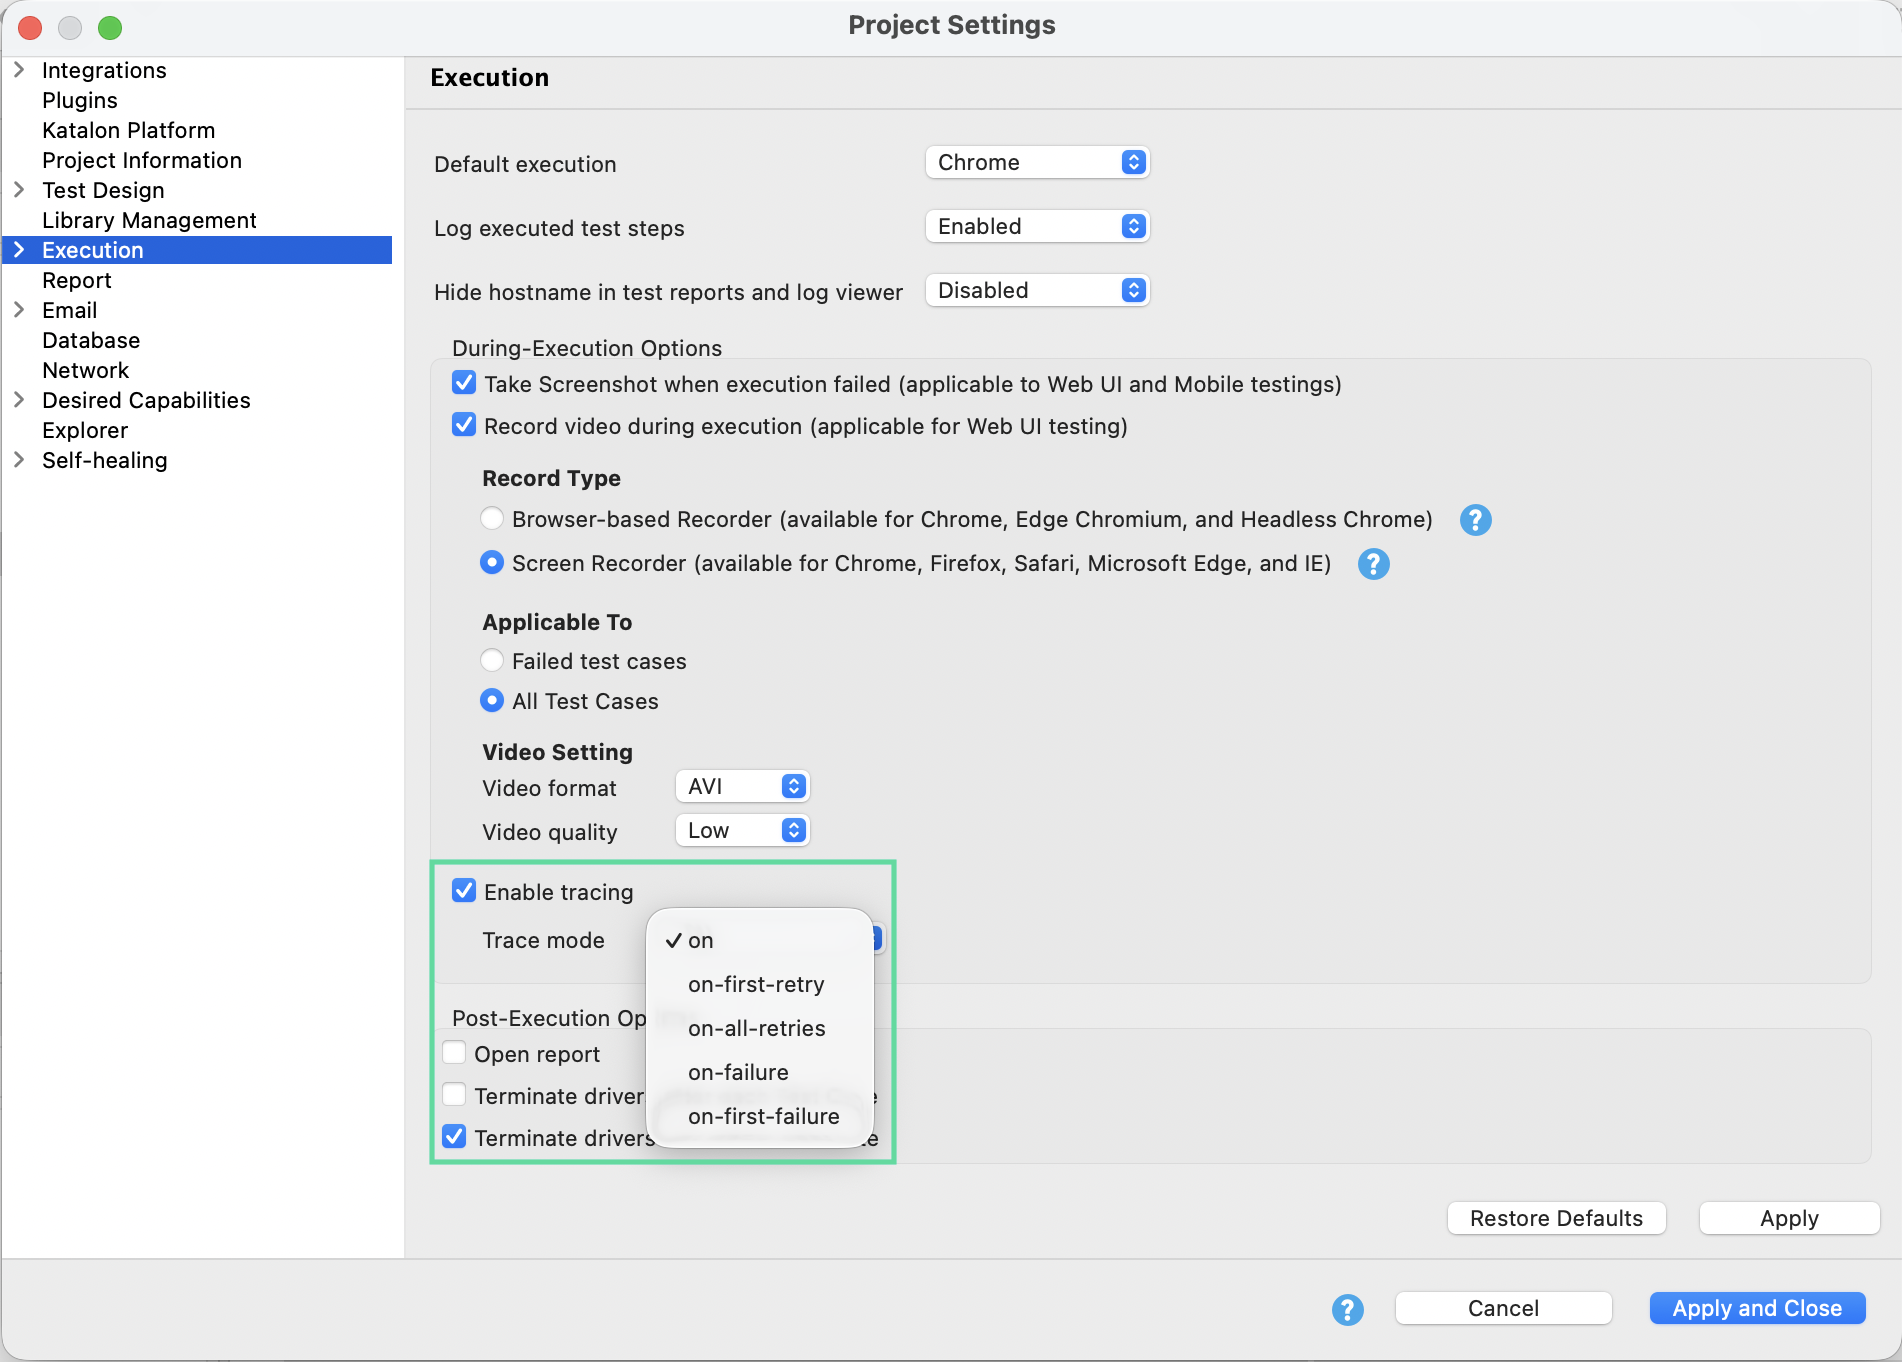
-
Configure Tracer modes and Captured data types. These are modes you can choose from:
-
on(always record) – Record a trace for every test case -
on-first-retry– Record a trace only for the first retry of a failed test -
on-all-retries– Record traces for all retry attempts -
on-first-failure– If the test fails, record a trace for the fail and skip recording for subsequent retries. Delete traces if the test passes. -
on-failure– If the test fails, record traces for both the fail and retries. Delete traces if the test passes.
-
-
Execute a WebUI test suite/test suite collection, and open the report-containing folder to find Tracer files for each test case (
<project>/Reports/traces/ktracer_files). Trace files are automatically uploaded to TestOps if integration is available.
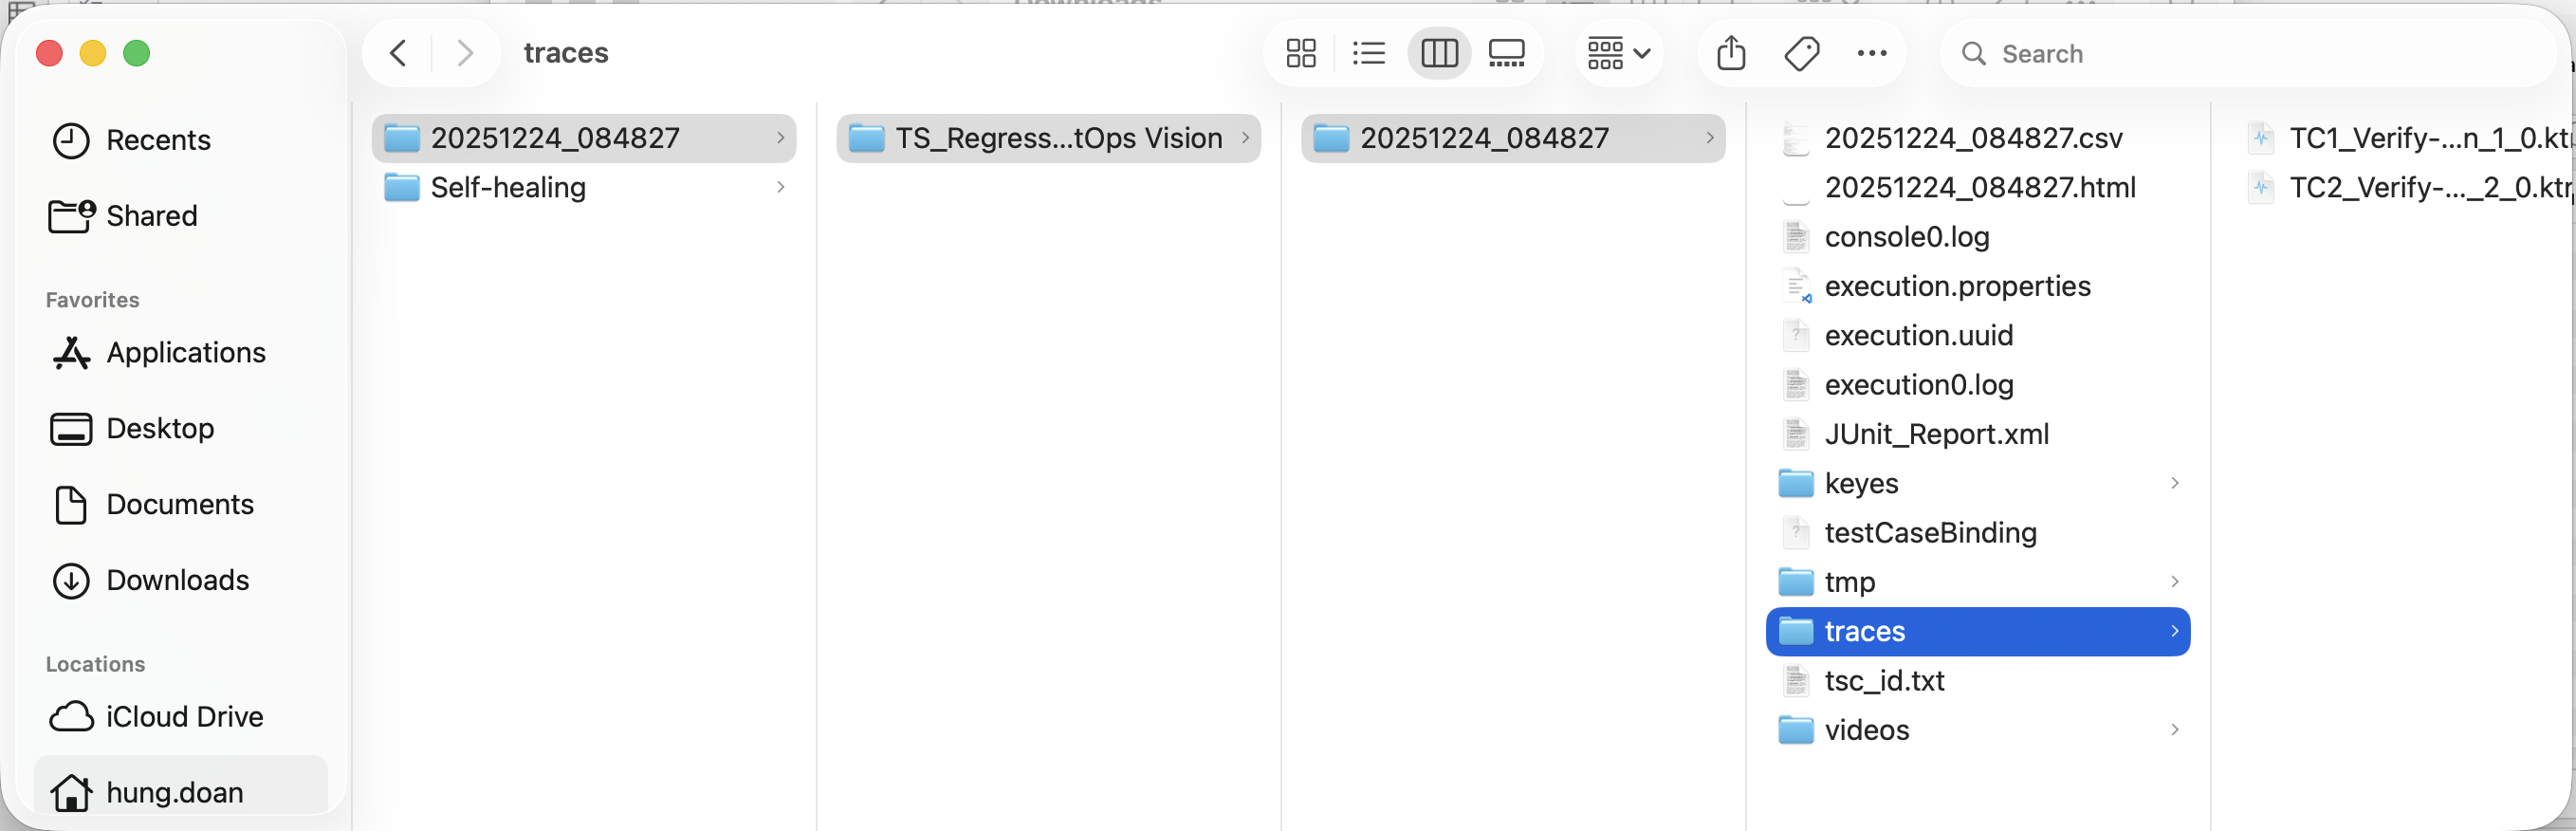
-
View tracer files:
- Upload the file to Katalon Tracer index page for online viewing on the browser.
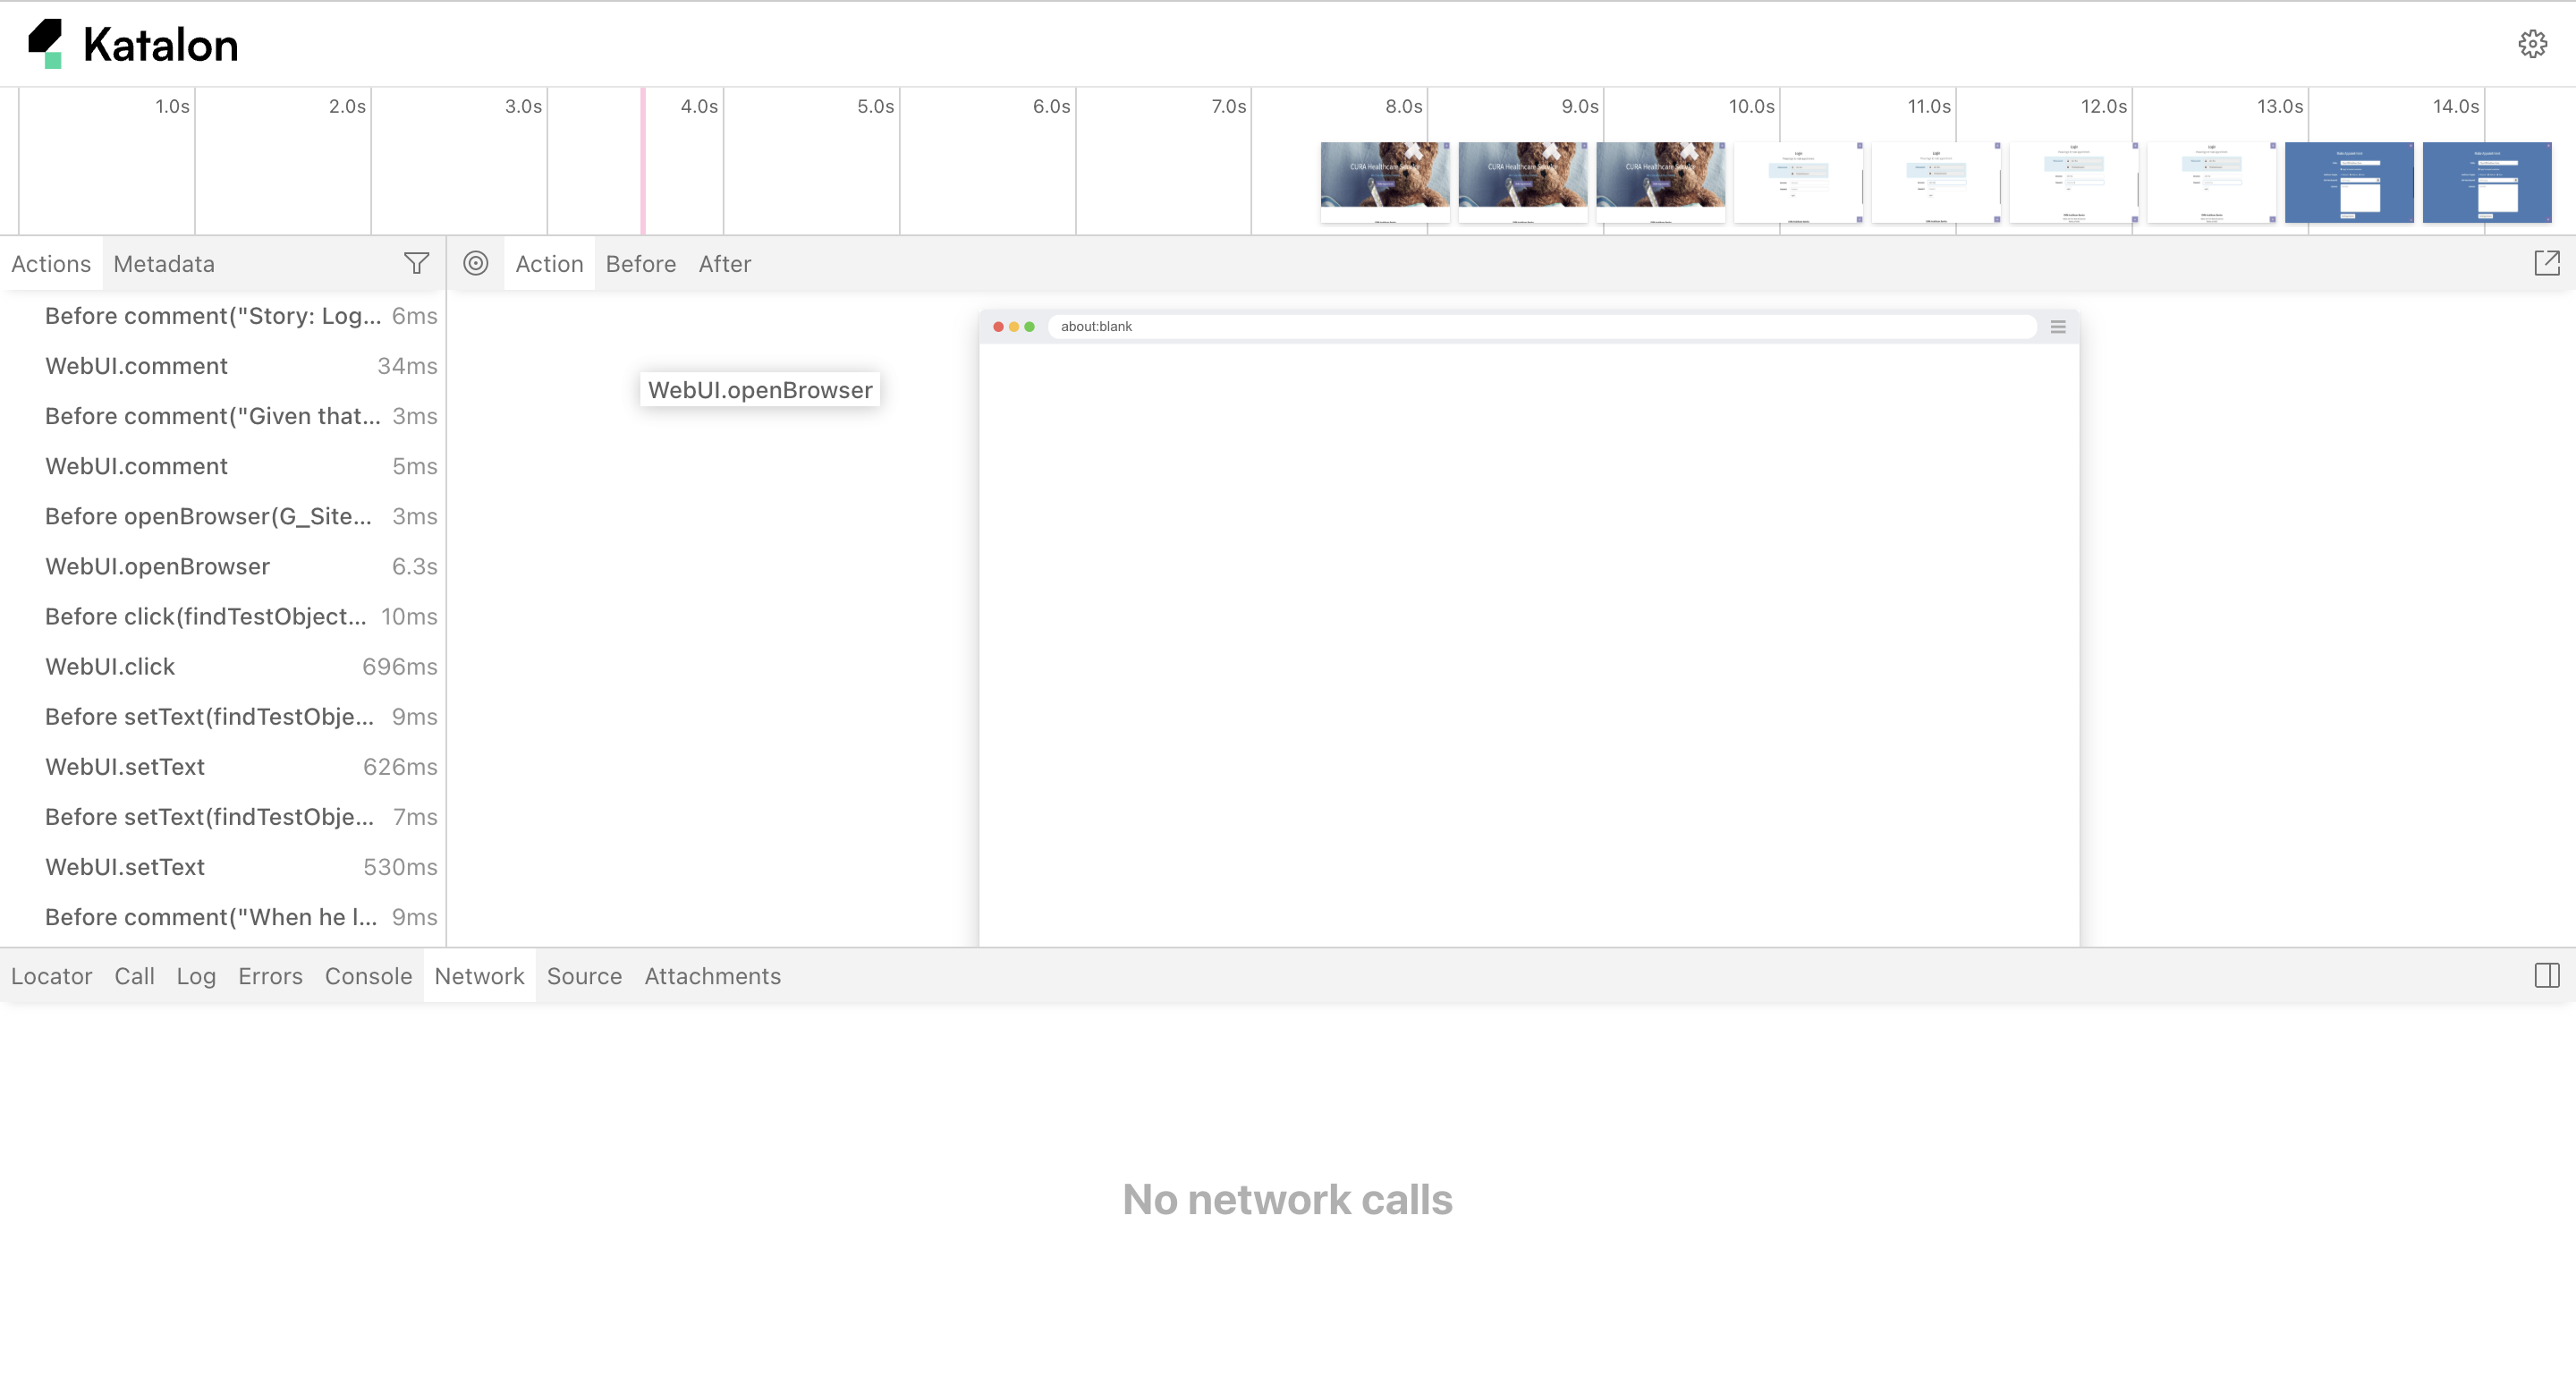
View Tracer
Use our interactive guide to see what data Tracer captures:
| Tab | Information |
|---|---|
| Actions | Shows what locator was used for each action, execution time, and visual changes in DOM snapshots. You can navigate back and forward to inspect actions with Before/After tabs. |
| Screenshots | Records a screencast rendered as a film strip (when screenshots option is on). Hover to see magnified images of each action and state. Double-click actions to focus on specific time ranges. |
| Snapshots | Captures complete DOM snapshots for each action (when snapshots option is on). Shows three snapshot types: Before (when action is called), Action (at moment of input/click), and After (after action completes). |
| Source | Displays and highlights the line of source code corresponding to the selected action in the sidebar. |
| Call | Shows detailed information about the action including execution time, locator used, strict mode status, and keyboard keys used. |
| Log | Provides a full test log showing Katalon Studio background operations like scrolling, waiting for elements, and performing actions. |
| Errors | Displays error messages for failed tests with a red timeline indicator showing where errors occurred, linked to the source code line. |
| Console | Shows console logs from both the browser and test file, with icons distinguishing the source. Can be filtered by selected actions. |
| Network | Displays all network requests made during tests. Sortable by request type, status, method, duration, and size, with detailed request/response information. |
| Metadata | Shows test information including browser, viewport size, test duration, and other test metadata. |
| Attachments | Allows exploring test attachments, particularly useful for visual regression testing with image diff comparisons using a slider tool. |
Use Tracer in Katalon Runtime Engine
- An active Katalon Runtime Engine license.
- Google Chrome browser (Tracer currently supports Chrome only)
- (Optional) Project integrated with Katalon True Platform to upload and view trace files online
In Katalon Runtime Engine, Tracer behavior is controlled using the command‑line parameter -trace.mode. Use -trace.mode=<value> to specify when Tracer should record execution traces. For example:
katalon
    -executeTests
    -testSuitePath="Test Suites/TS1"
    -trace.mode=on
You can replace <value> with the following:
off– Disable tracing (default)on– Record a trace for every test caseon-first-retry– Record a trace only for the first retry of a failed teston-all-retries– Record traces for all retry attemptson-failure– If the test fails, record a trace for the failed run, and skip recording for subsequent retries. Delete traces if the test passes.on-first-failure– If the test fails, record traces for both the fail run and retries. Delete traces if the test passes.
You should then find the reports on your local machine or on TestOps. View them on the web at Katalon Tracer index page.
Known Limitations
The initial beta version of Tracer has the following limitations. These capabilities will be expanded in future releases:
- DOM snapshots in the Tracer file fail to load correctly, so users cannot view page state snapshots for each step even when this data capture option is enabled.
- In
on-failureoron-first-failuremodes, blank Tracer files are still created for skipped tests, generating unnecessary trace artifacts with no useful data. - For incomplete test cases (for example, those calling
System.exit(0)), no Tracer file is created, so aborted or incomplete executions are not traceable. - Test cases that are called by the current test case are not traced.
- When using
on-first-retrymode with more than one retry, the Tracer icon only appears on the retry entries, not on the main run in the Katalon Studio report view, making it harder for users to discover that a trace is available for that test. - Help text for
katalon -help traceis missing, so users cannot see the documented list of Tracer CLI parameters and their usage when configuring Tracer from the command line. - When using
callTestCase, the Tracer file only captures the “before” steps and omits the main actions from the called test, resulting in incomplete execution traces.
The followings are temporarily unavailable/not supported:
- Attachments (videos, custom logs, artifacts)
- Browser information and error details
- Snapshots
- Firefox, Edge, Safari browsers (currently Chrome only)
- Executing Tracer in Debug Mode
- Built-in trace viewer (video/play button in Katalon Studio)