Requirement coverage reports
Overview
The Requirement Coverage report allows you to monitor the coverage of test cases and test runs in each corresponding requirement in your project.
Insights
Project management with Jira/Cucumber integration could not be effective if it does not allow you to centralize all Jira and BDD requirements in one single place for reports and analytics.
The larger a project is, the more requirements you and your team have to ensure all defects and product components are covered within the project. It also means a strong need for a heatmap incorporating all requirements while showing their statuses visibly in one central location.
In Katalon TestOps, the Requirement Coverage report serves that purpose.
With one glance at the dashboard, you and your team can see a comprehensive report of your production progress, quickly spotting the requirements that need a close-up attention.
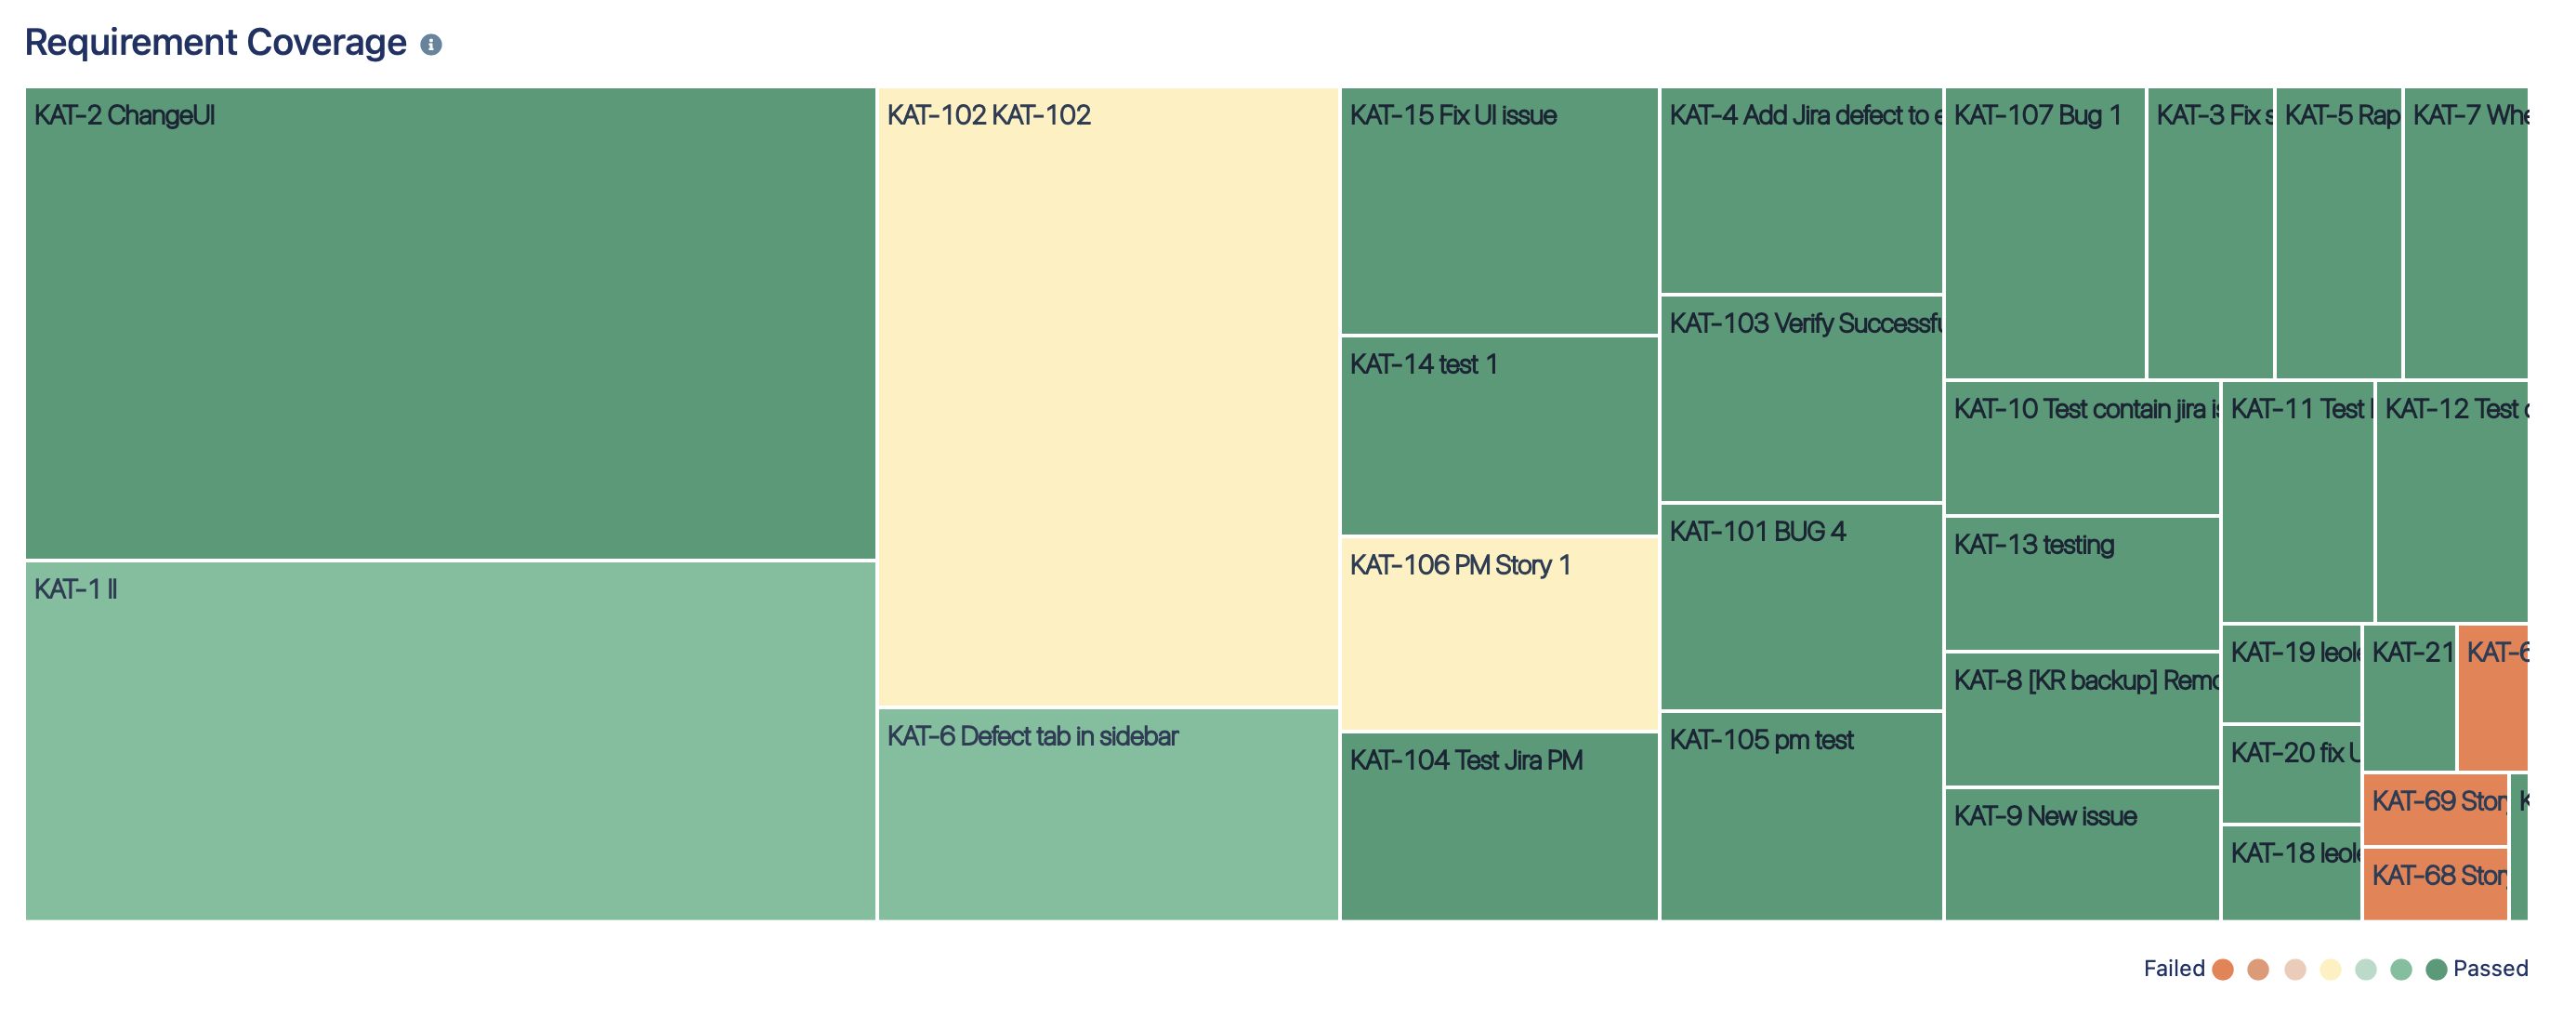
For example, if the report is represented as follows:
- One green rectangle represents the coverage of "Requirement 1".
- One orange rectangle represents the coverage of "Requirement 2".
- The size of the green rectangle is bigger than the orange one.
The analytics offer the following information:
- There is more coverage of test cases and test runs on "Requirement 1" than "Requirement 2".
- The quality of test cases on "Requirement 1" is better than that of "Requirement 2".
- The green color means that tests are passed, while the orange color represents failed tests. If a green rectangle is bigger than the orange one, it is a good sign. By contrast, if the orange rectangle is bigger, it signifies that there is a lot of bugs and the product is not working as expected.