Test Activities Reports
The Test Activities report assists in verifying product functionality and ensuring your software performs as designed. Effective testing prevents defects, reduces costs, and improves application performance. Katalon TestOps centralizes these metrics into a comprehensive dashboard that supports faster troubleshooting and data-driven decision-making throughout your product lifecycle.
You can customize the report by filtering test runs using daily, weekly, or monthly intervals to analyze results within your desired timeframe. This flexibility helps you identify quality patterns and track testing progress aligned with your project requirements.
The default period is 7 days (from Monday to Sunday of the most recent week, compared to the current date).
Test activities insights
Total test runs
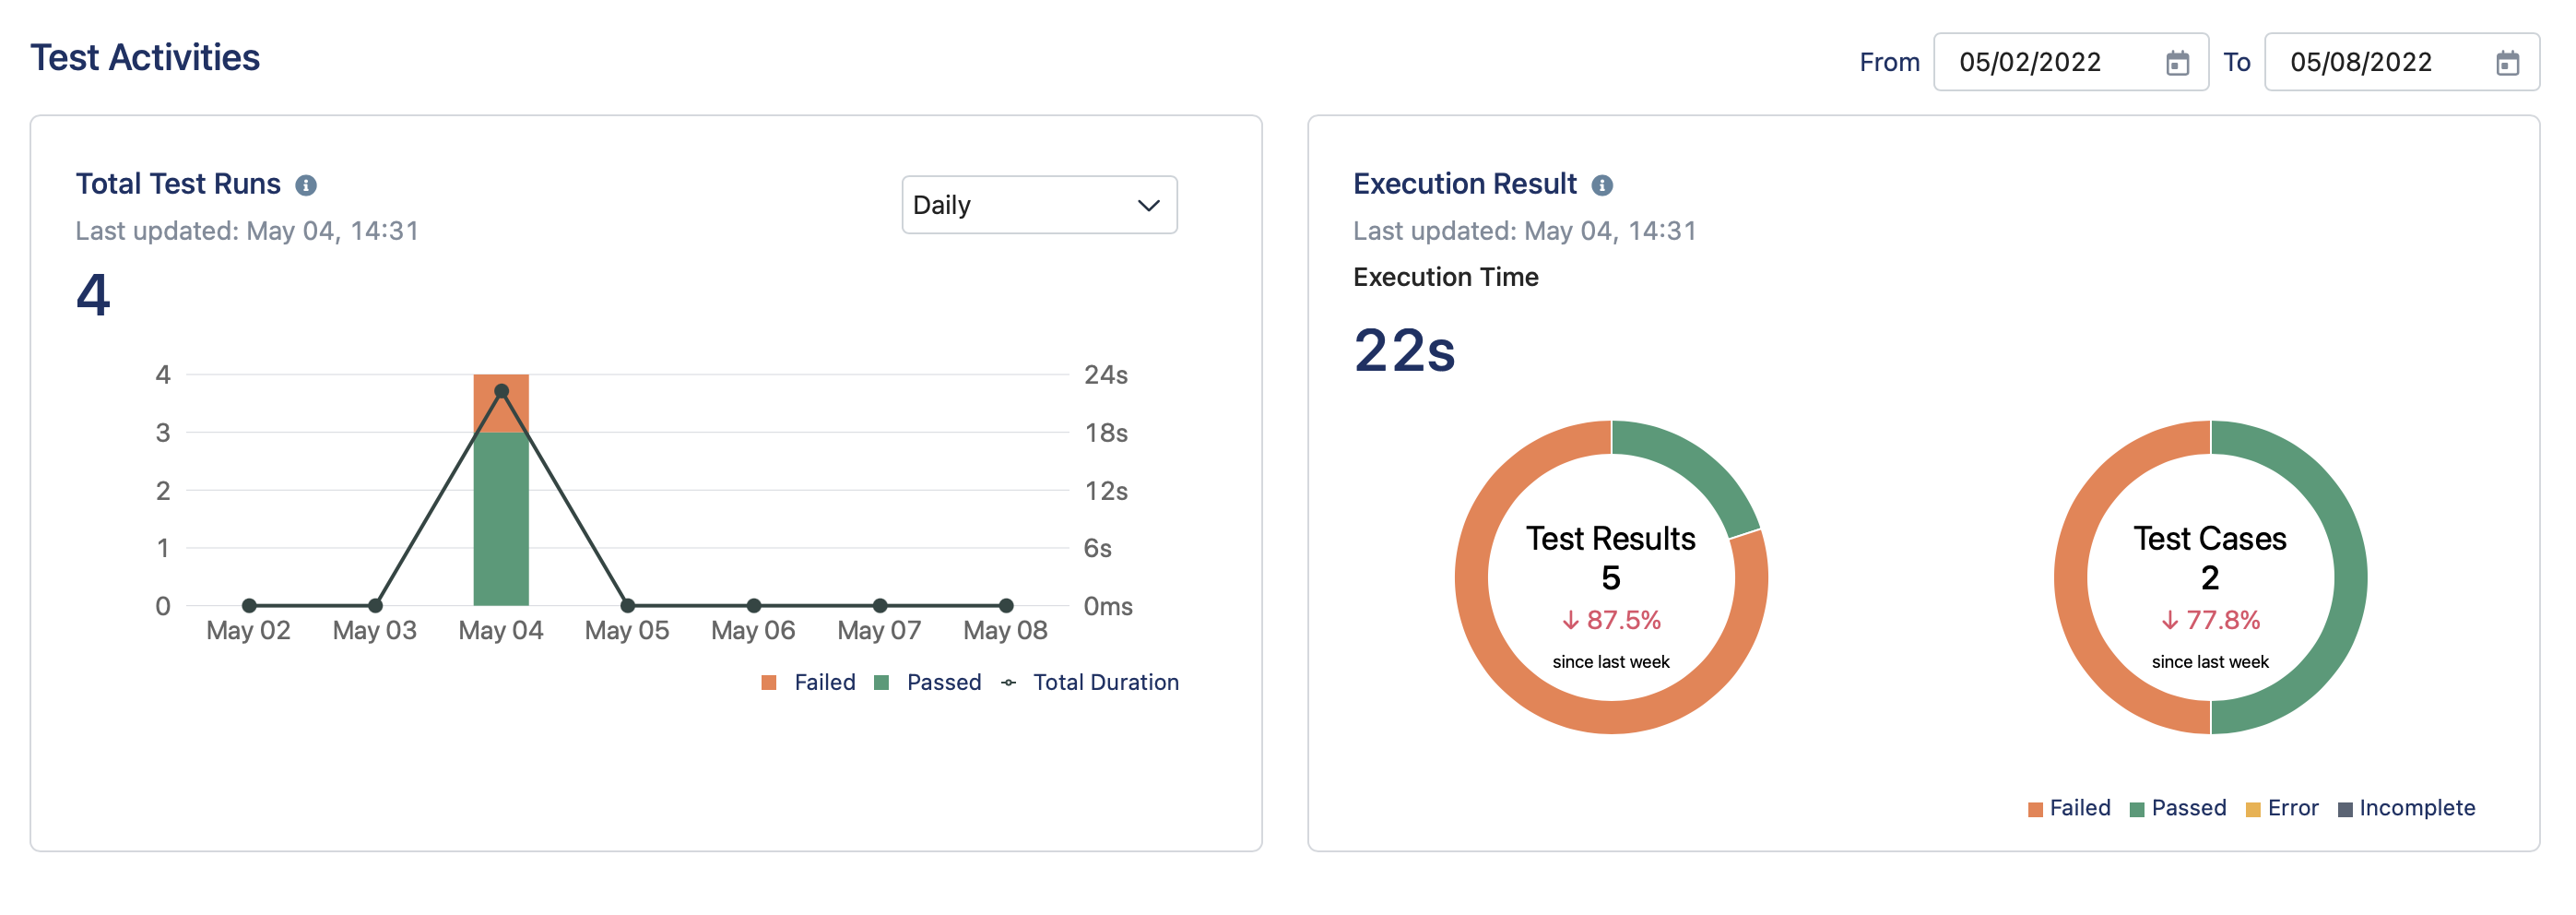
The Total Test Runs chart provides a daily/weekly/monthly testing statistic by highlighting the number of tests with passed and failed status + the total testing duration in the Project. Incomplete test runs are excluded in this chart.
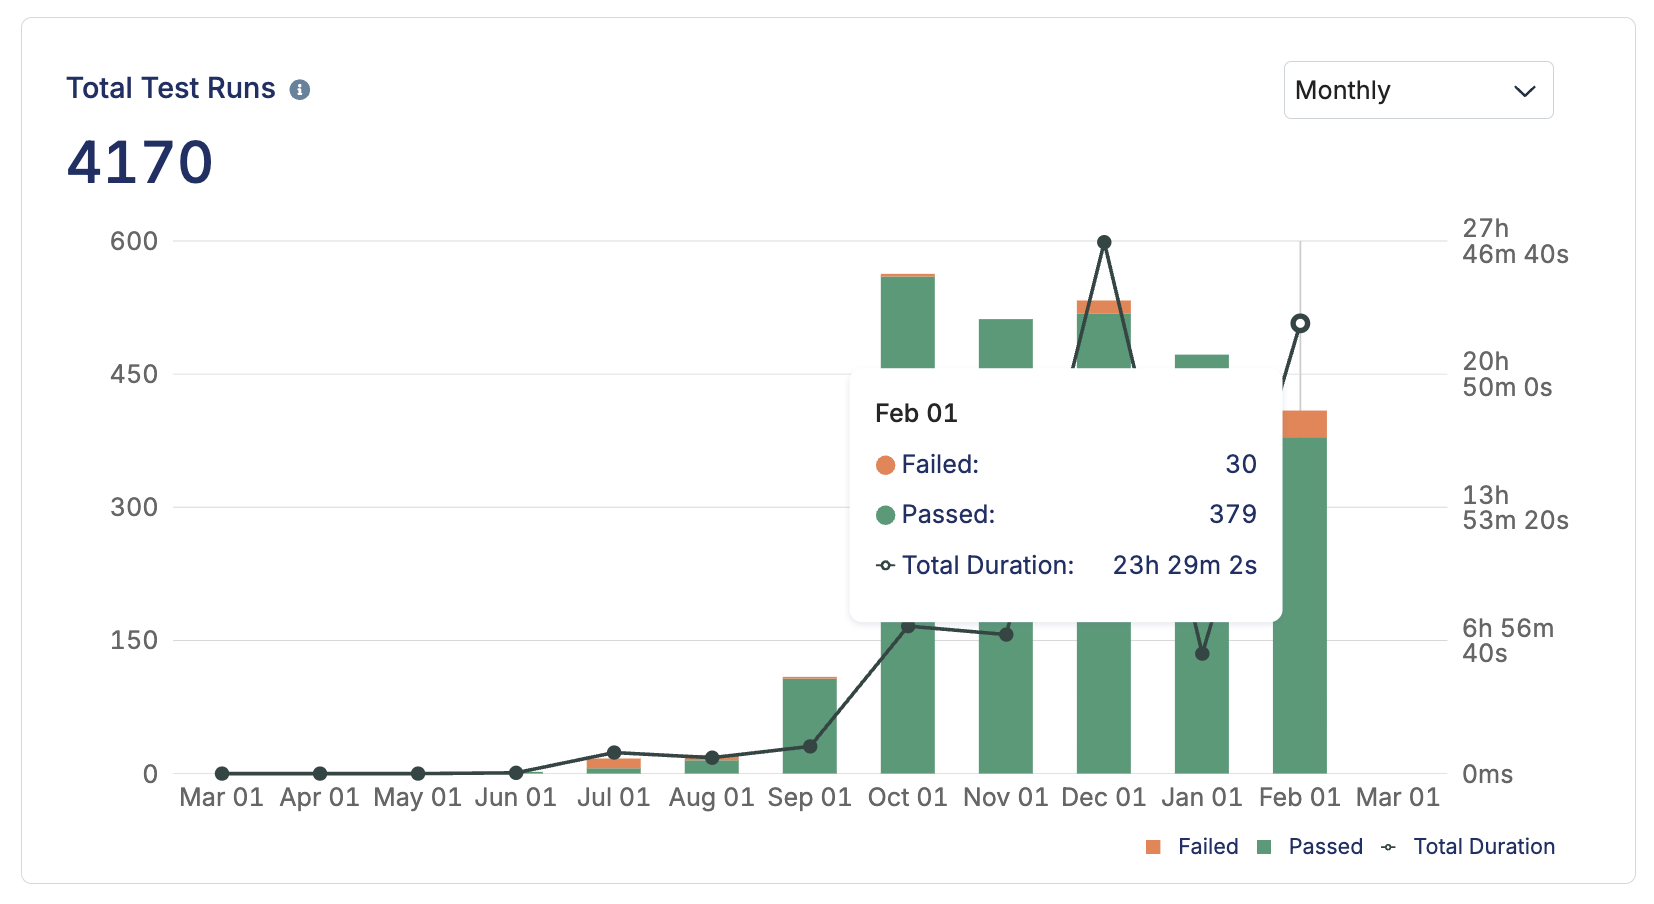
This chart provides key testing metrics to help you monitor test performance over time. You can analyze test frequency across daily, weekly, or monthly intervals, view pass/fail distribution for all test runs, and monitor the total runtime of tests per day. Data shown is based on the latest execution test results.
The dashboard enables you to compare test execution times between different periods, helping you identify performance anomalies. For example, if yesterday's 5 test runs completed in 2 minutes, but today's 3 test runs required 5 minutes, this indicates a potential performance regression that requires investigation.
You can use these metrics to identify execution time trends, detect quality issues through pass/fail patterns, and optimize your testing pipeline by addressing performance bottlenecks.
Execution result
Gain a complete overview of test results with the Execution Result chart, where test cases and results are highlighted with the following 4 options: passed, failed, error, or incomplete, together with their execution time.
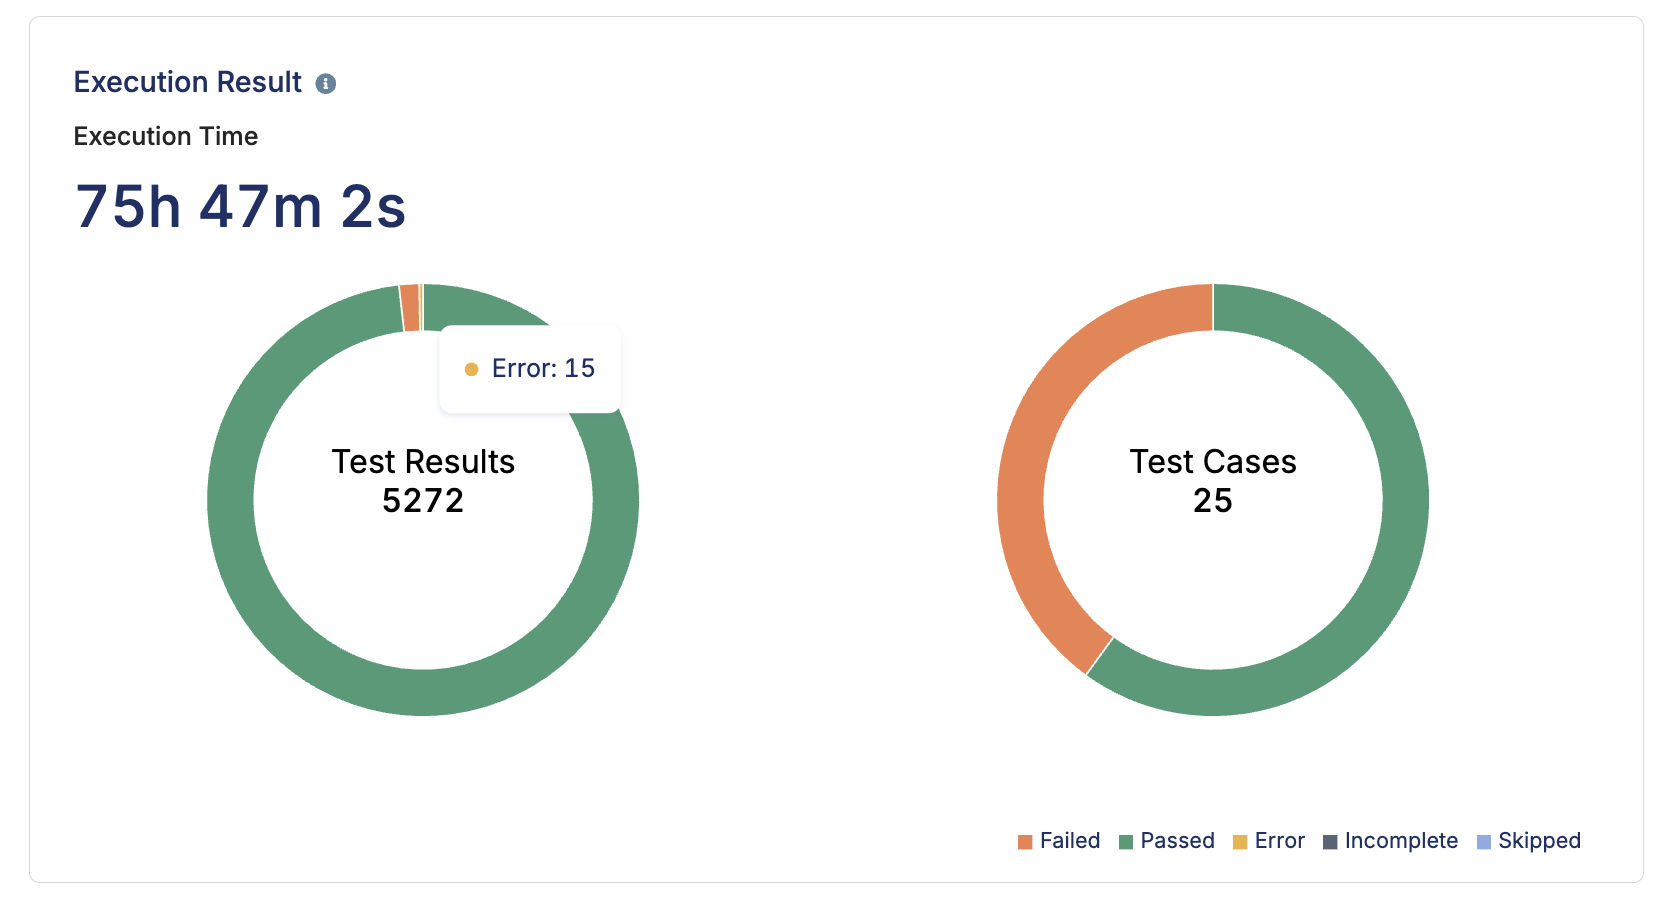
This chart enables you to evaluate test quality metrics across specified time periods. You can assess overall test health by analyzing the distribution of passed, failed, and error results—fewer failed or error tests indicate good quality, while higher failure rates signal the need to review your test cases or investigate application issues.
By analyzing these metrics, you can make informed decisions about your testing strategy, prioritize quality improvement initiatives, and ensure your application performs as expected.