License Utilization Dashboard (Legacy)
This document covers TestOps Legacy version only.
As an Organization Owner or Administrator, the License Utilization Dashboard allows you to track the use of Katalon Studio Enterprise and Katalon Runtime Engine licenses to help maximize the license allocations and productivity of your team.
License Usage Visualization
- You're an Owner or Admin of your Organization.
- On the Account admin page, select your Organization.
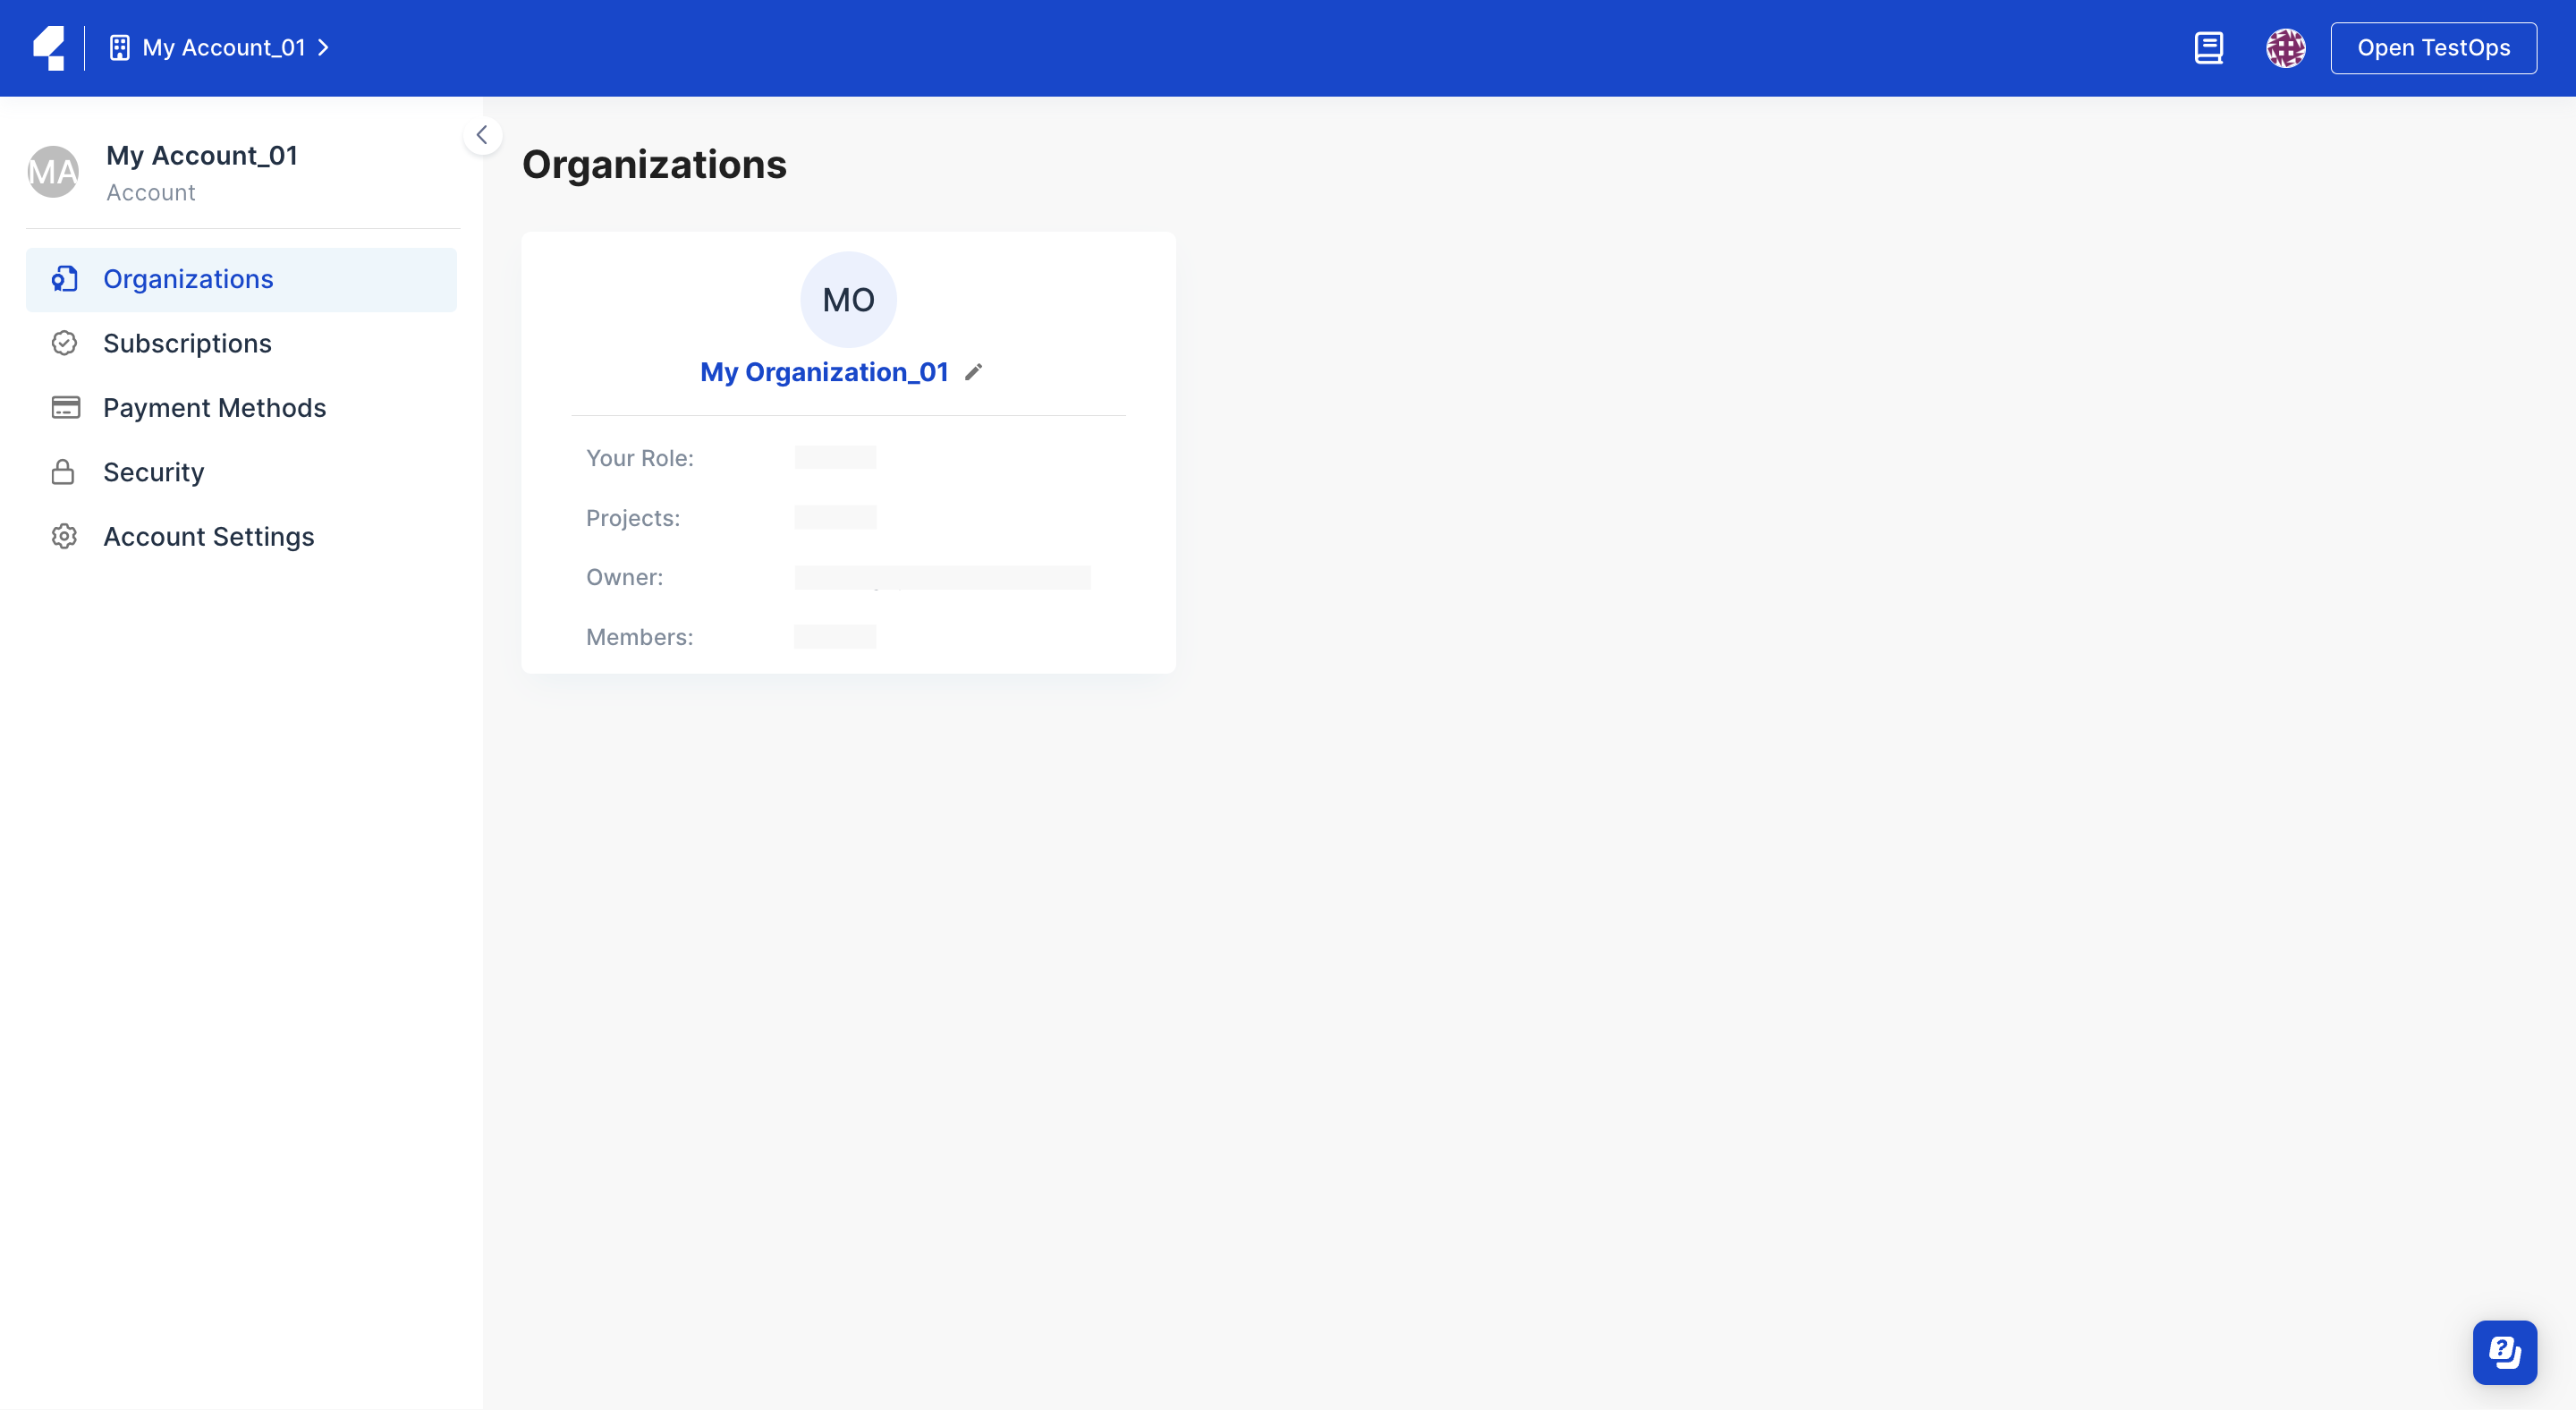
- The Organization admin page displays. Navigate to the Dashboard section and choose the product you want to view.
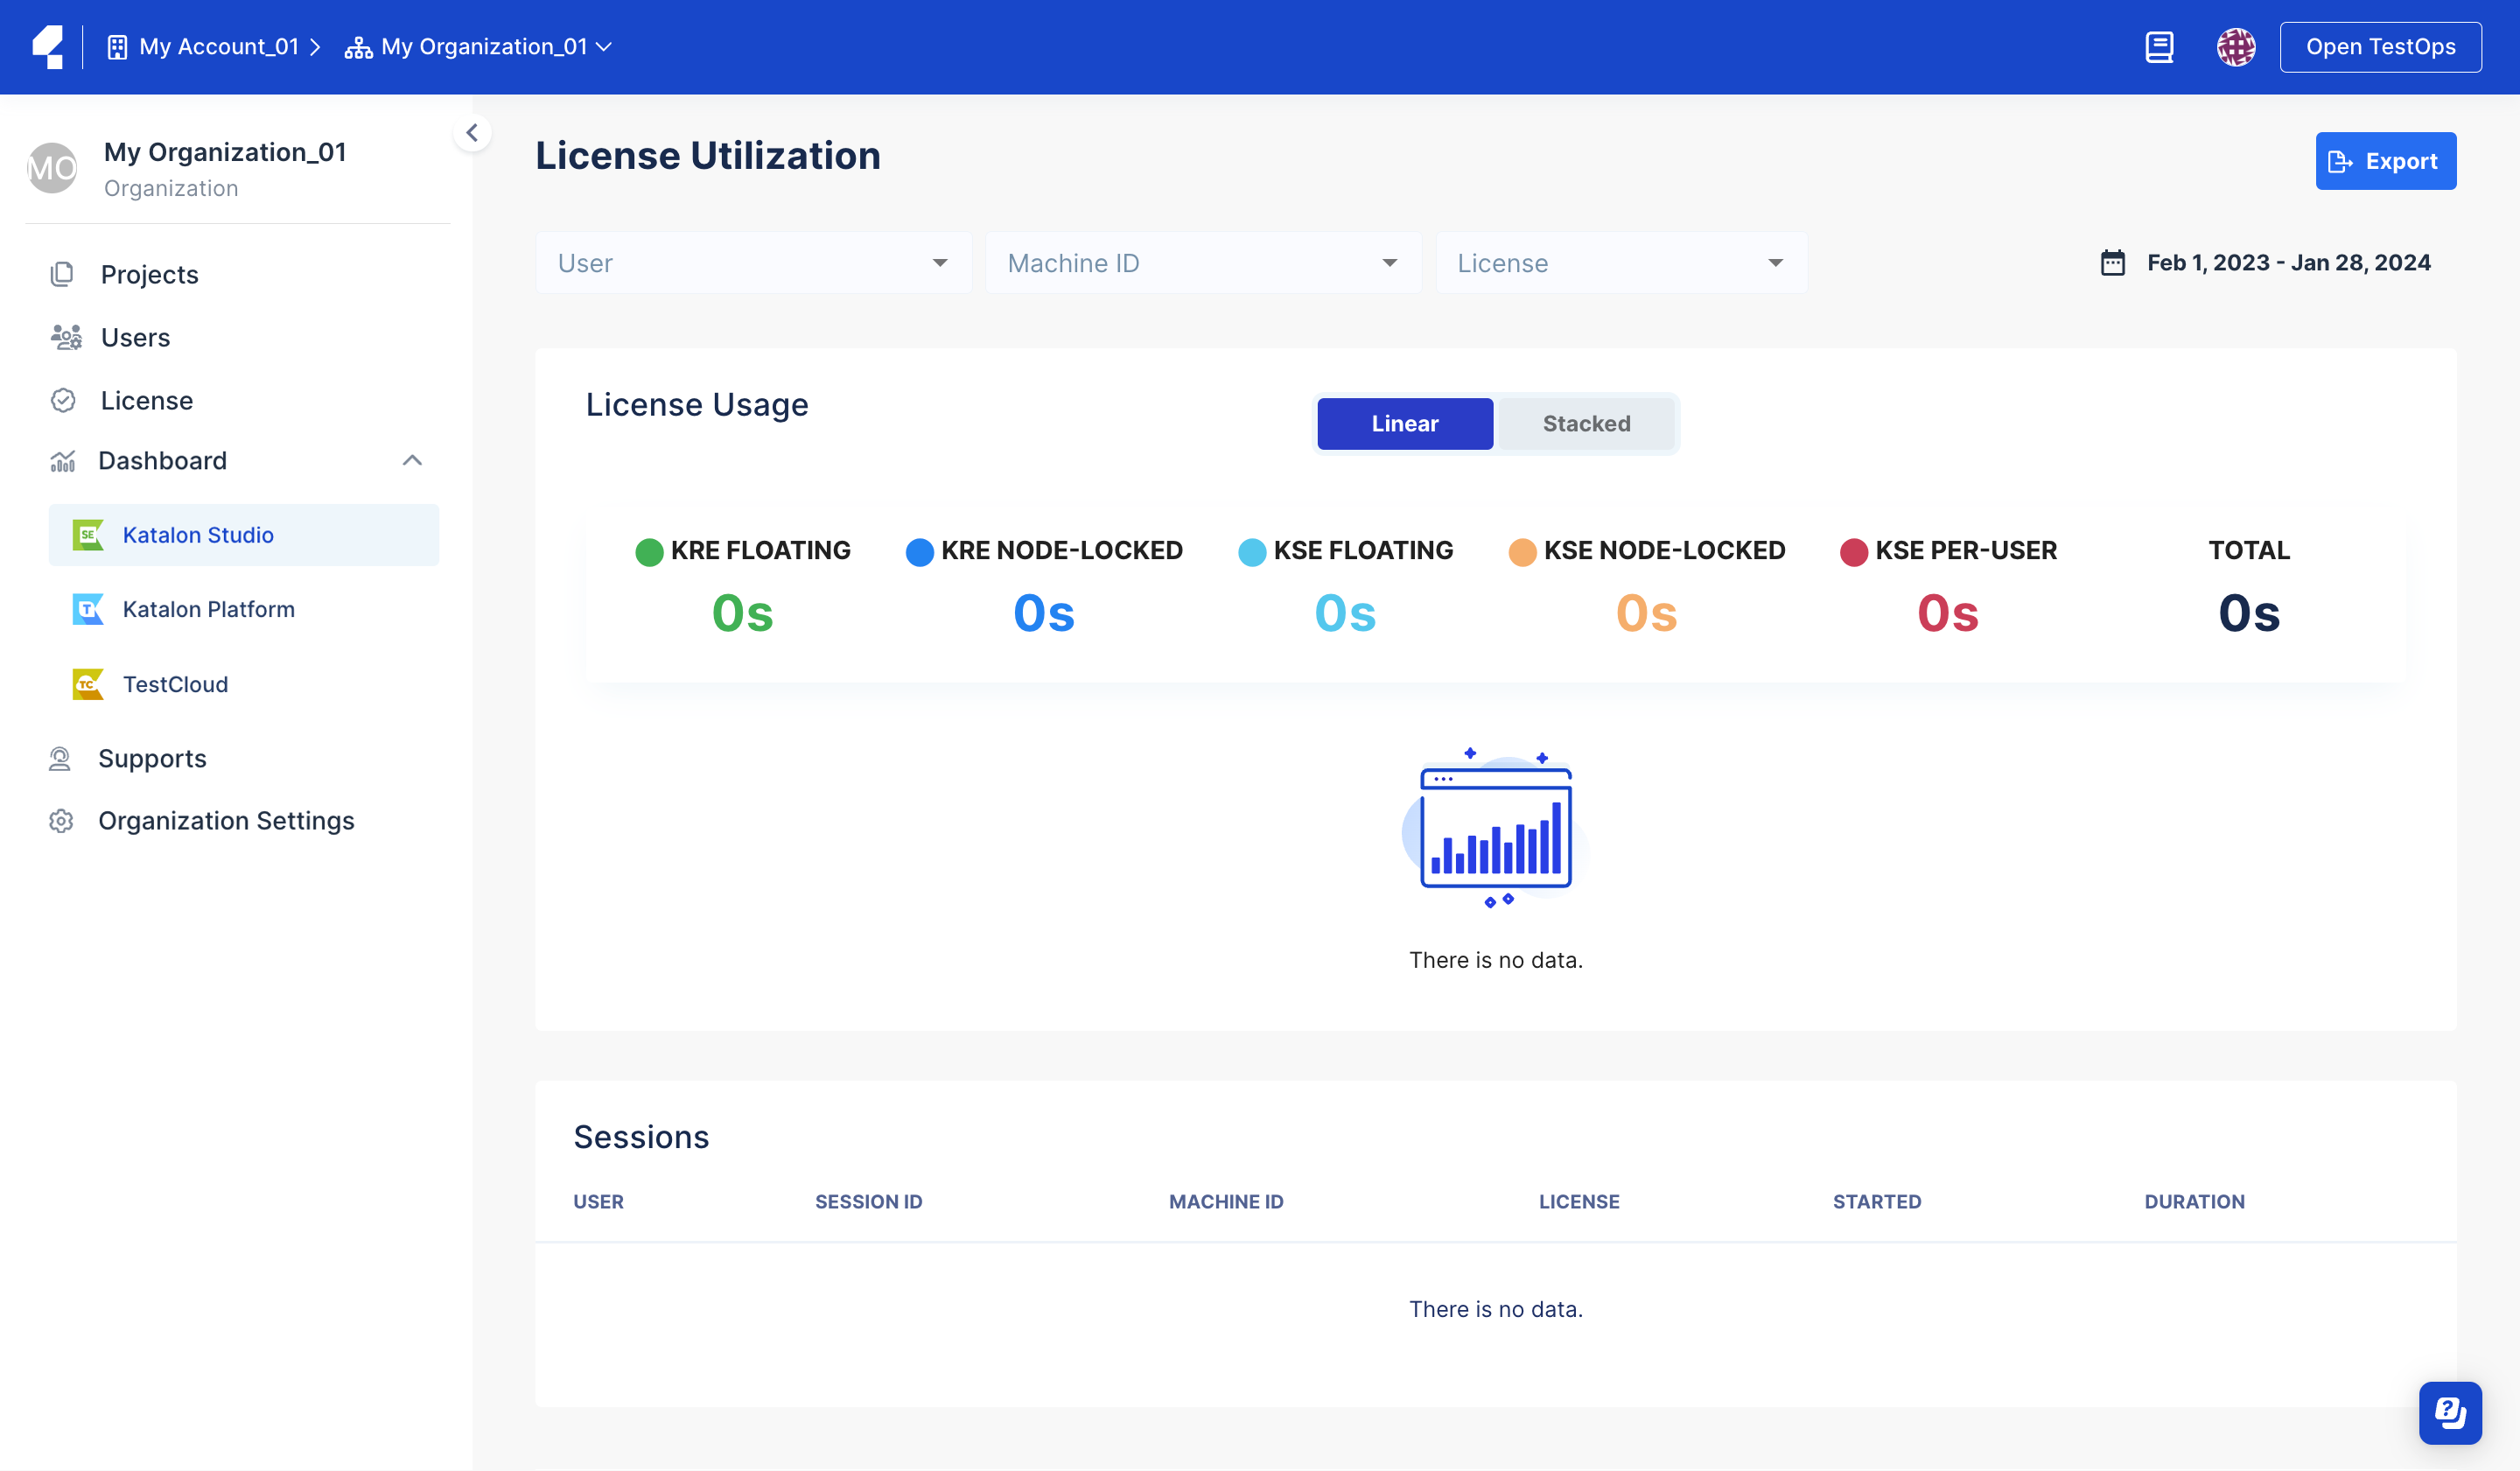
The License Utilization details of the selected product appear with filter options. You can also export your filtered data as a .csv file for analysis and management purposes.
The Filter Bar
Date time picker:
On the top right of the Product Utilization page, you can see the date time picker that displays a specific date range. For example: Feb 1, 2023 - Jan 28, 2024. The Date time picker allows you to select a range of dates for which you want to view the license usage.
Click the Date time picker icon at the top right corner of the license utilization dashboard. The range of dates displays accordingly.
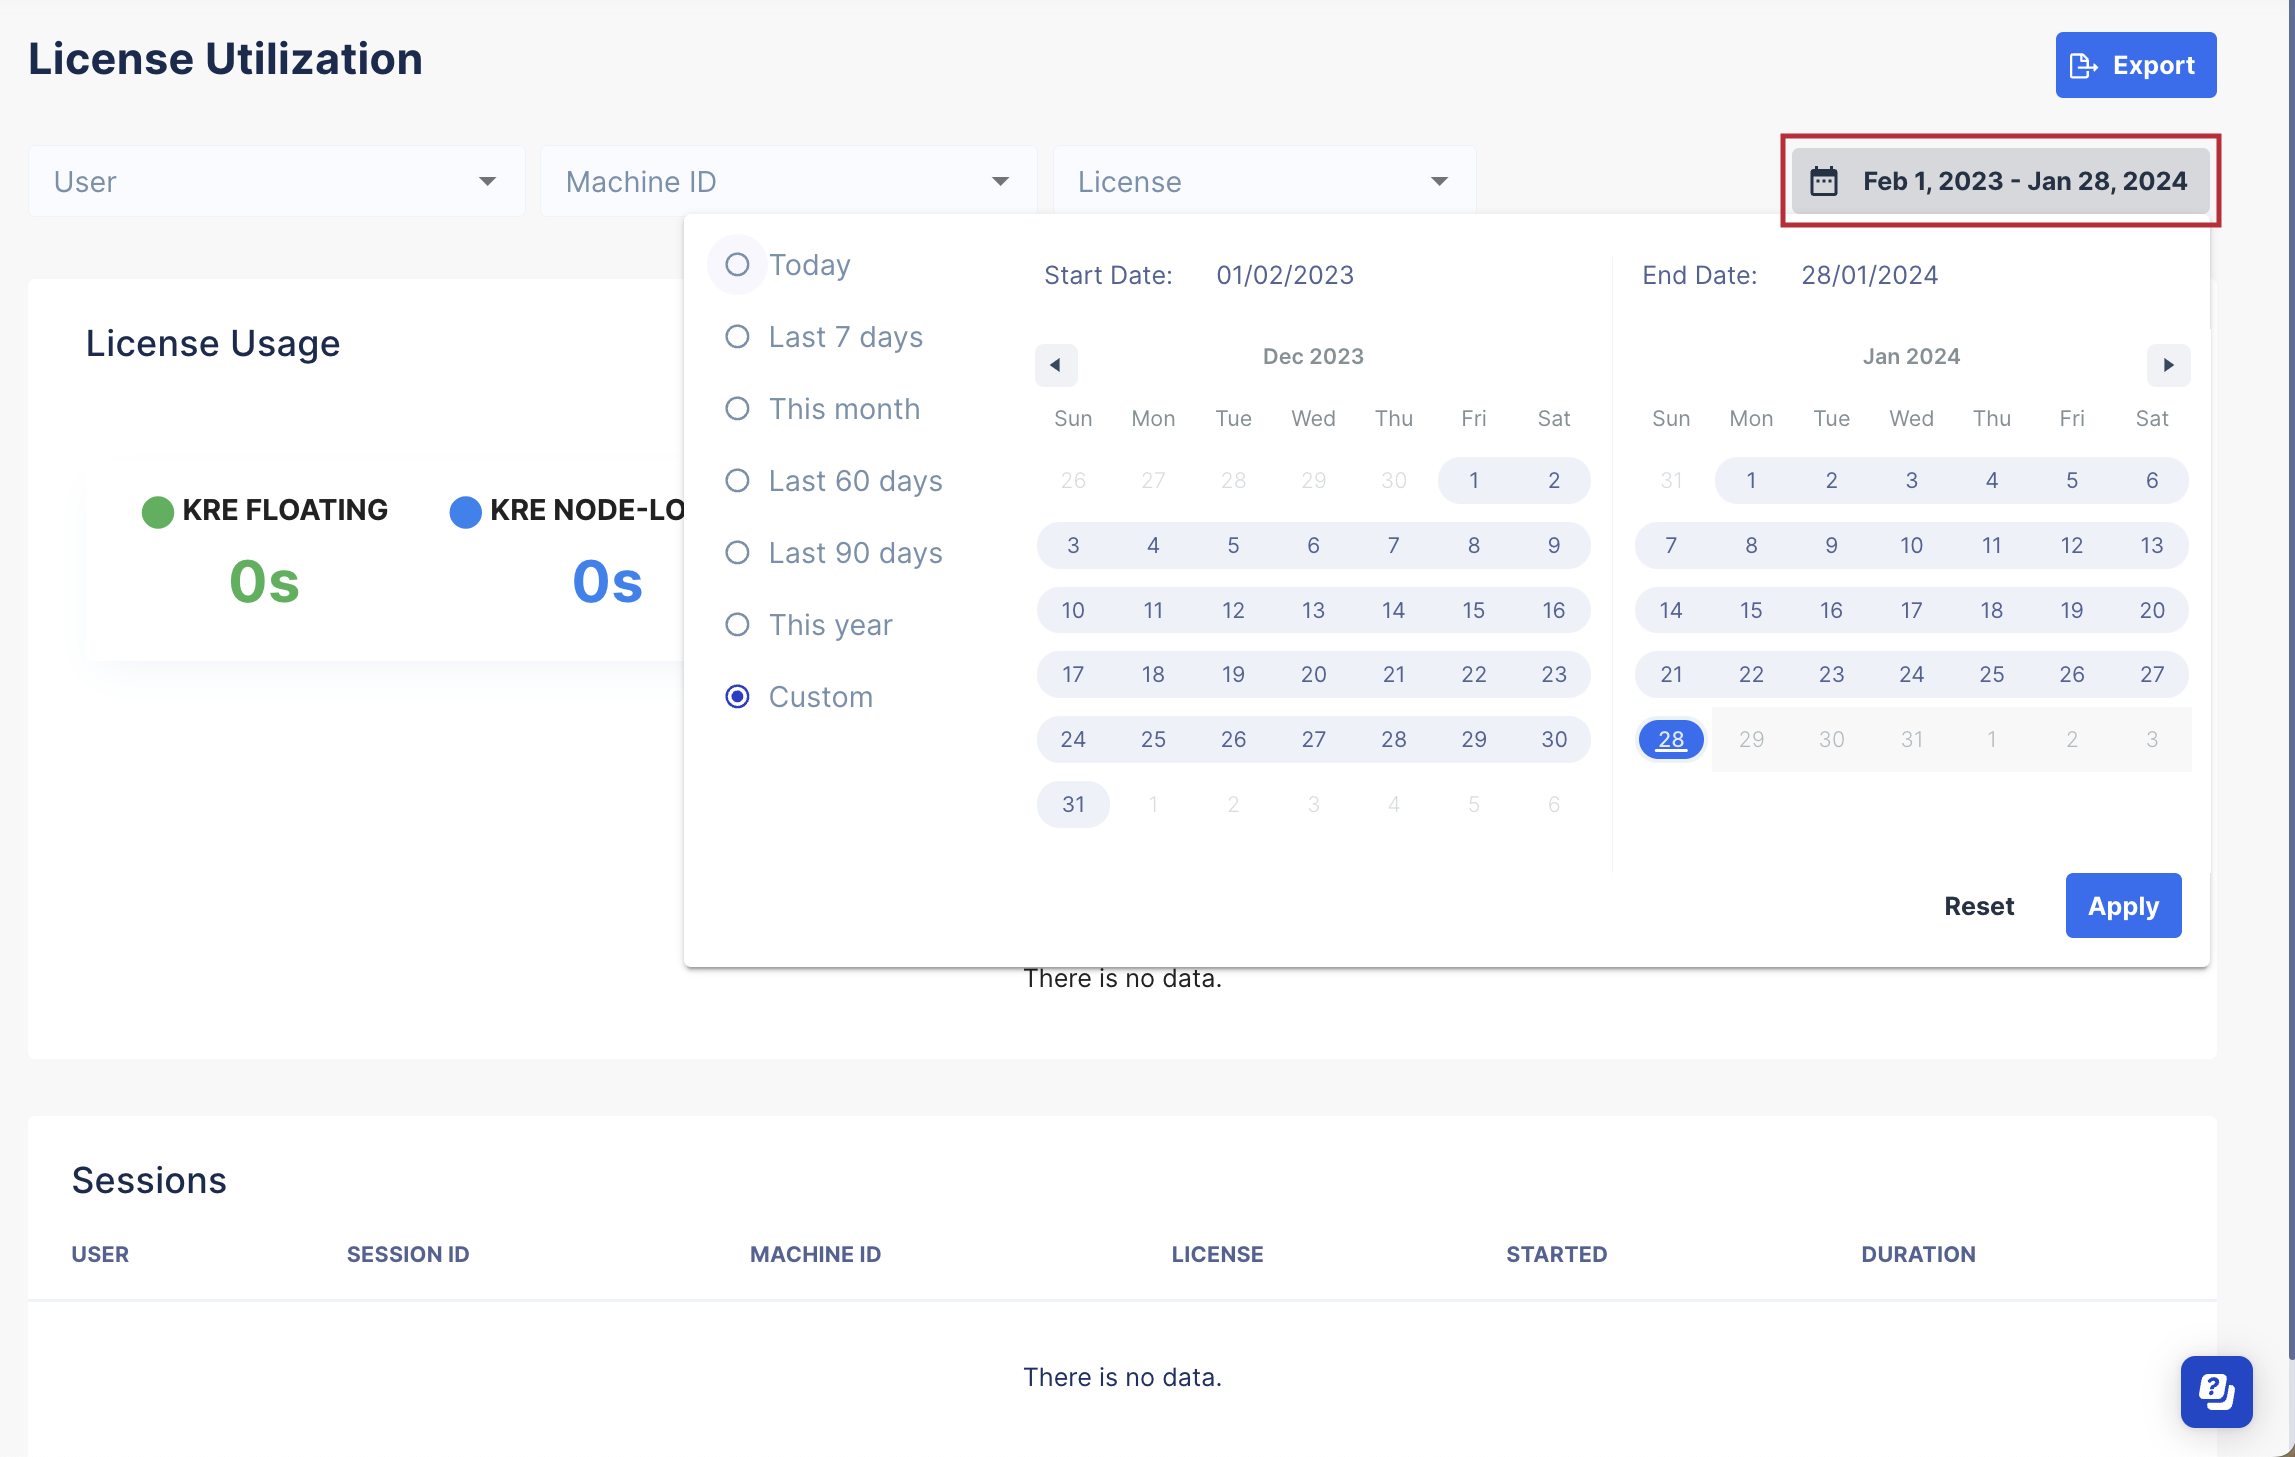
The buttons and their functions in the Date time picker are as given below:
Reset: Click this button to go back to the default date range. Refer to point 2 below, for more details on the default date range.
Apply: Click this button to apply the new date range that you select.
Note:If you select a date range but do not click on Apply, the current date range displays by default.
Default date range:

Keeps the default date range as it existed a year ago from [TODAY]:
- Start date = 1st of 12 months ago.
- End date = [TODAY]
As long as you apply the filter, the date range is valid for all sections on the page, including Chart and Session table.
For any date range or quick options that you select, the format is always: MMM DD, YYYY - MMM DD, YYYY, by default.
For example: Apr 01, 2021 - Mar 08, 2022.

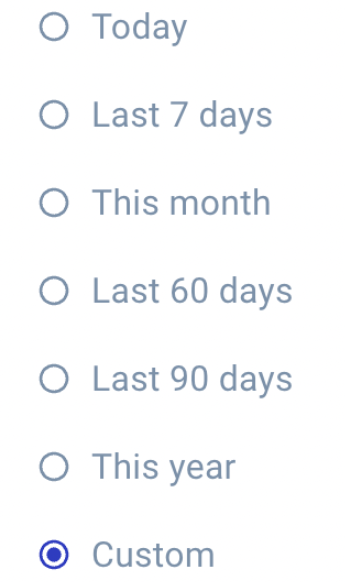
The date ranges to the left of the license utilization dashboard display the various timelines that you can select as per your requirement:
Let us suppose that Now is 11/02/2022, 16:22:00. The table below displays the corresponding date ranges and their meanings:
Date range Meaning Now The date range will be from 11/02/2022 00:00:00 - 11/02/2022, 16:21:59. Last 7 days The date range will be from 05/02/2022 00:00:00 - 11/02/2022, 23:59. This month The date range will be from 01/02/2022 00:00:00 - 11/02/2022, 23:59:59. Last 60 days The date range will be from 14/12/2022 00:00:00 - 11/02/2022, 23:59:59. Last 90 days The date range will be from 4/11/2022 00:00:00 - 11/02/2022, 23:59:59. This year The date range will be from 01/01/2022 00:00:00 - 11/02/2022, 23:59:59. Custom You can set up a custom date range filter as per your requirement. Note:In the Date time picker, You can select any date range that is within a range of 1 year, at the maximum.
If you select a date range of more than 1 year (say, 366 days), an error message displays accordingly, stating Date range is invalid.
User email, machine ID, and license types:
Use the filter to select the user email, machine ID, and license type that you want to analyze. The statistics, graph, and session table below display the session durations for each license type within the 1-year period.
If you leave it blank by default, you will see the total duration used for all license types, machine IDs, and user emails, including the data of removed machine IDs and user emails.
In each filter category, you can search and select multiple options. You can filter for removed users, but not for removed machine IDs.
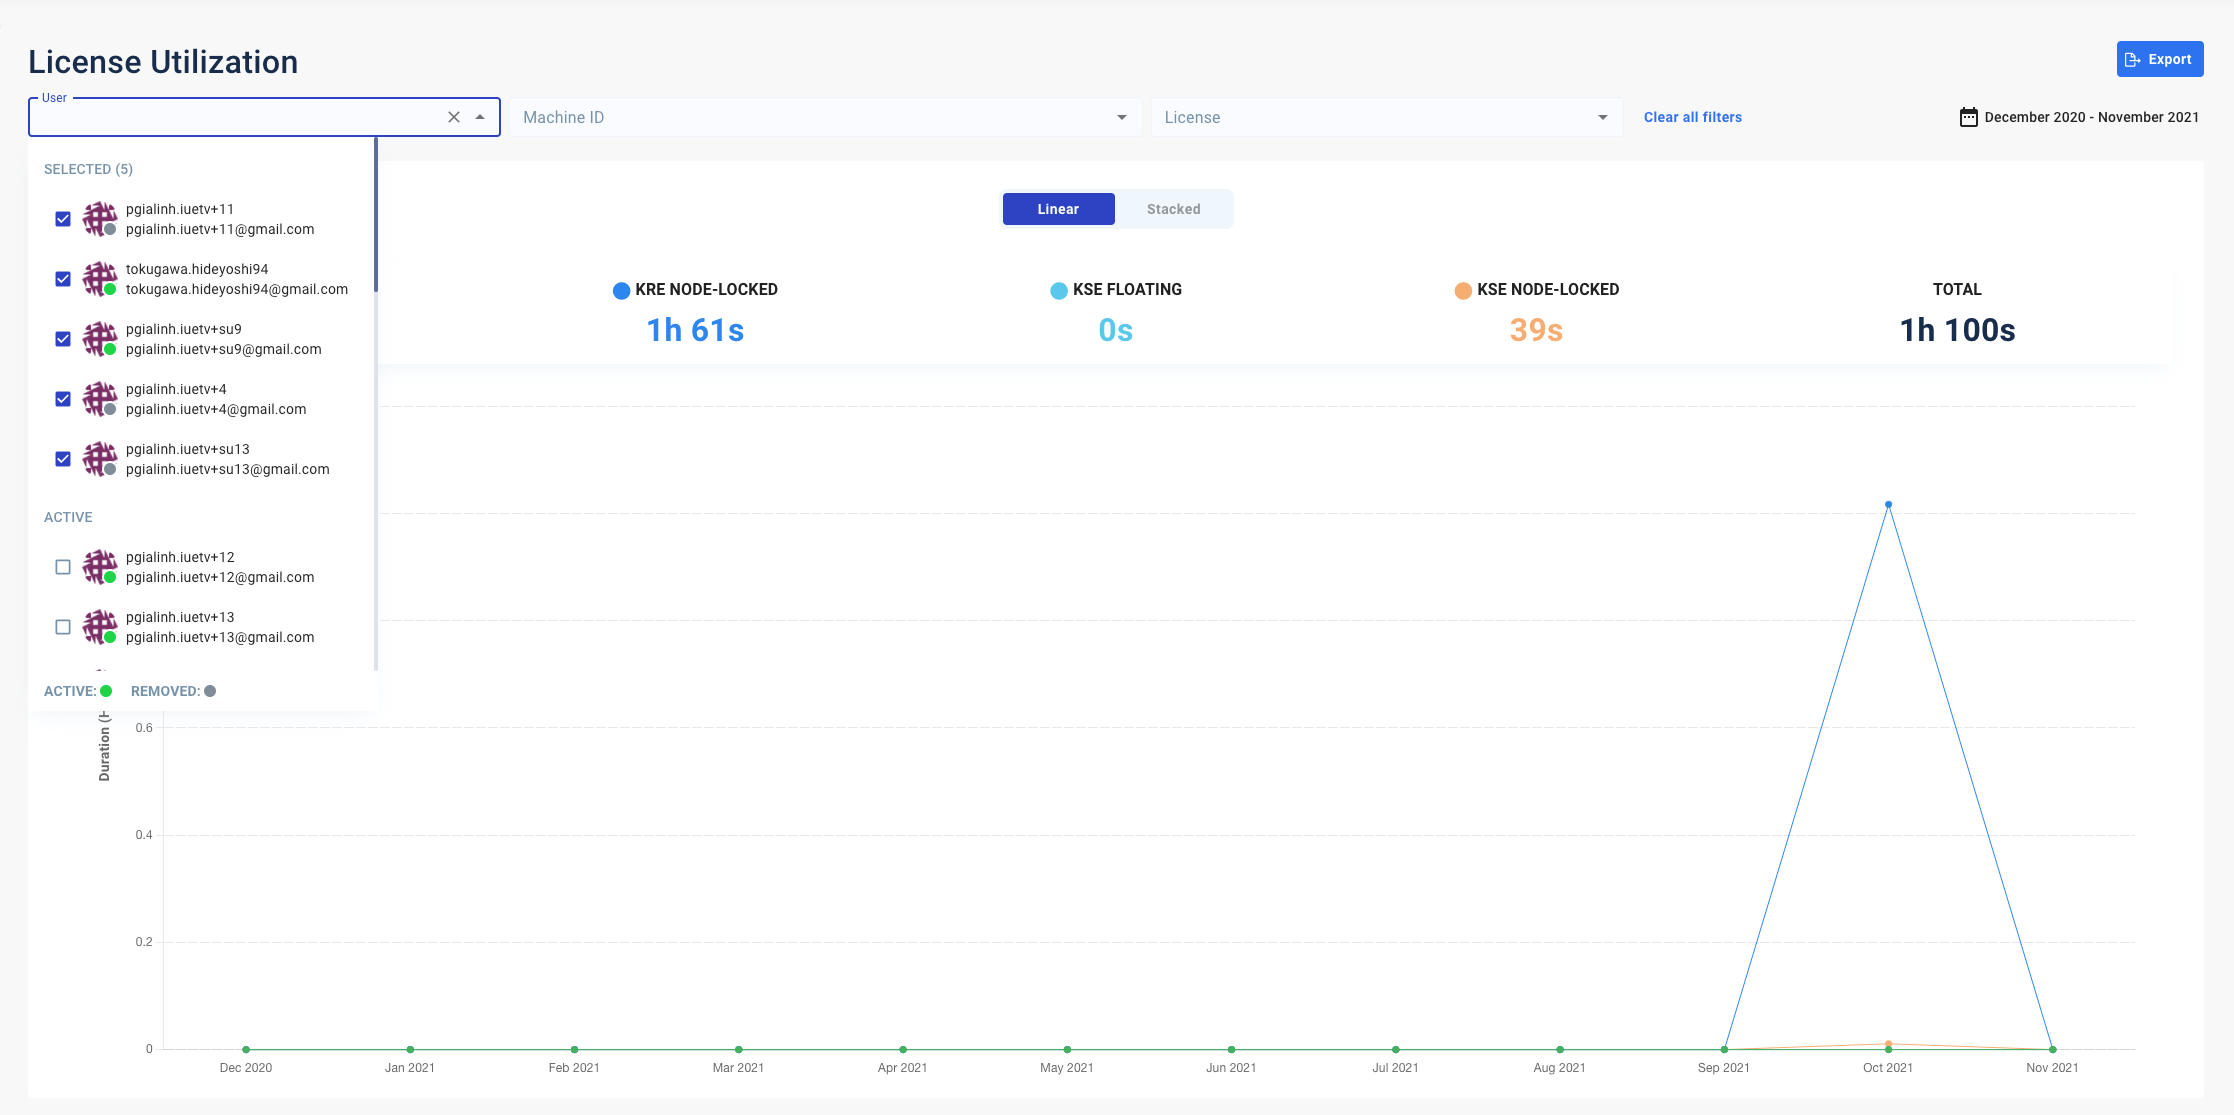
After you choose your filter options, the dynamic graph changes accordingly.
License Usage
In the License Usage section, you can see the statistics summary and the graph.
There are two modes for view. You can click on the button above the graph to switch between modes:
- The Linear mode shows the stats in numbers, and the graph, in a line chart.
- The Stacked mode shows the stats in percentage, and the graph, in a bar chart.
The statistics summary:
The statistics summary above the chart represents the total duration of testing for each license type within the time range.
The graph:
The graph visualizes the duration of each license type for each month. You can observe this diagram to find out usage trends for each licensed user in your team.
The linear mode:

The stacked mode:

To see the detailed information, hover over the stats bar or the graph. The detailed box appears.


Session Table
Below the graph section, you can view the detailed list of sessions completed by your team members.

If you leave the filter blank by default, you can still find the removed user emails or machine IDs session in the session table.
Export Utilization Report
After you filter your desired data, you can generate and download a CSV report. On the top left corner of the License Utilization dashboard, hit the Export button. A .csv file named License Utilization_[Org-name]_OrgID_yyyymmdd-yyyymmdd.csv is downloaded to your machine, in which yyyymmdd-yyyymmdd is the filtered date range.
The exported report includes:
- Username
- User email
- Session ID
- Machine ID
- License type
- Started timestamp
- Duration