Katalon Runtime Engine – Session-Based License Reports
This guide explains how to use Katalon Runtime Engine session-based license reports in Katalon True Platform. These reports help you monitor license utilization, identify peak demand periods, and optimize resource allocation across your Account or Organization, enabling data-driven license management and operational efficiency.
You must be assigned the Account Admin role to access the reports described below.
Overview
Katalon True Platform provides three primary session-based reports:
- Katalon Runtime Engine – License Usage – Resource utilization patterns and peak demand trends over time
- Katalon Runtime Engine – User Sessions – Session-level visibility into active and historical usage
- Test Execution - Cloud – License Usage – Test Execution - Cloud session resource monitoring and optimization
Each report serves a different purpose, from strategic capacity planning to operational monitoring.
Katalon Runtime Engine – License Usage
The Katalon Runtime Engine License Usage chart gives you a consolidated, time-based view of how session-based Katalon Runtime Engine licenses are utilized across your Account or Organization. This interactive report helps you monitor execution resource usage, identify peak demand periods, and optimize license allocation to ensure testing operations run efficiently.
Use Cases
This report helps you:
- Monitor periods of high demand to prevent resource constraints
- Identify underutilization that indicates potential cost-saving opportunities
- Plan license allocation based on historical usage patterns
- Make data-driven decisions about future license procurement
Interactive tooltips reveal detailed metrics for specific data points, helping you examine usage patterns without changing your view configuration.
How to View the Report
-
Go to Account Settings > Account > License Utilization.
-
Select Katalon Runtime Engine – License Usage.
The chart tracks three core metrics within the selected timeframe:
- Available Sessions: Total number of Katalon Runtime Engine session licenses available to your organization during each time interval, using the most current data point for accuracy.
- Peak Usage: Maximum number of concurrent sessions utilizing Katalon Runtime Engine licenses during each measured interval, highlighting resource demand spikes.
- Average Peak: Average peak usage across the time period, calculated differently based on your selected interval. For monthly views, this represents the average daily peak usage.
-
(Optional) Apply filters to refine your analysis by organization, date range, or time interval granularity.
-
(Optional) Hover over the chart to view detailed data points.
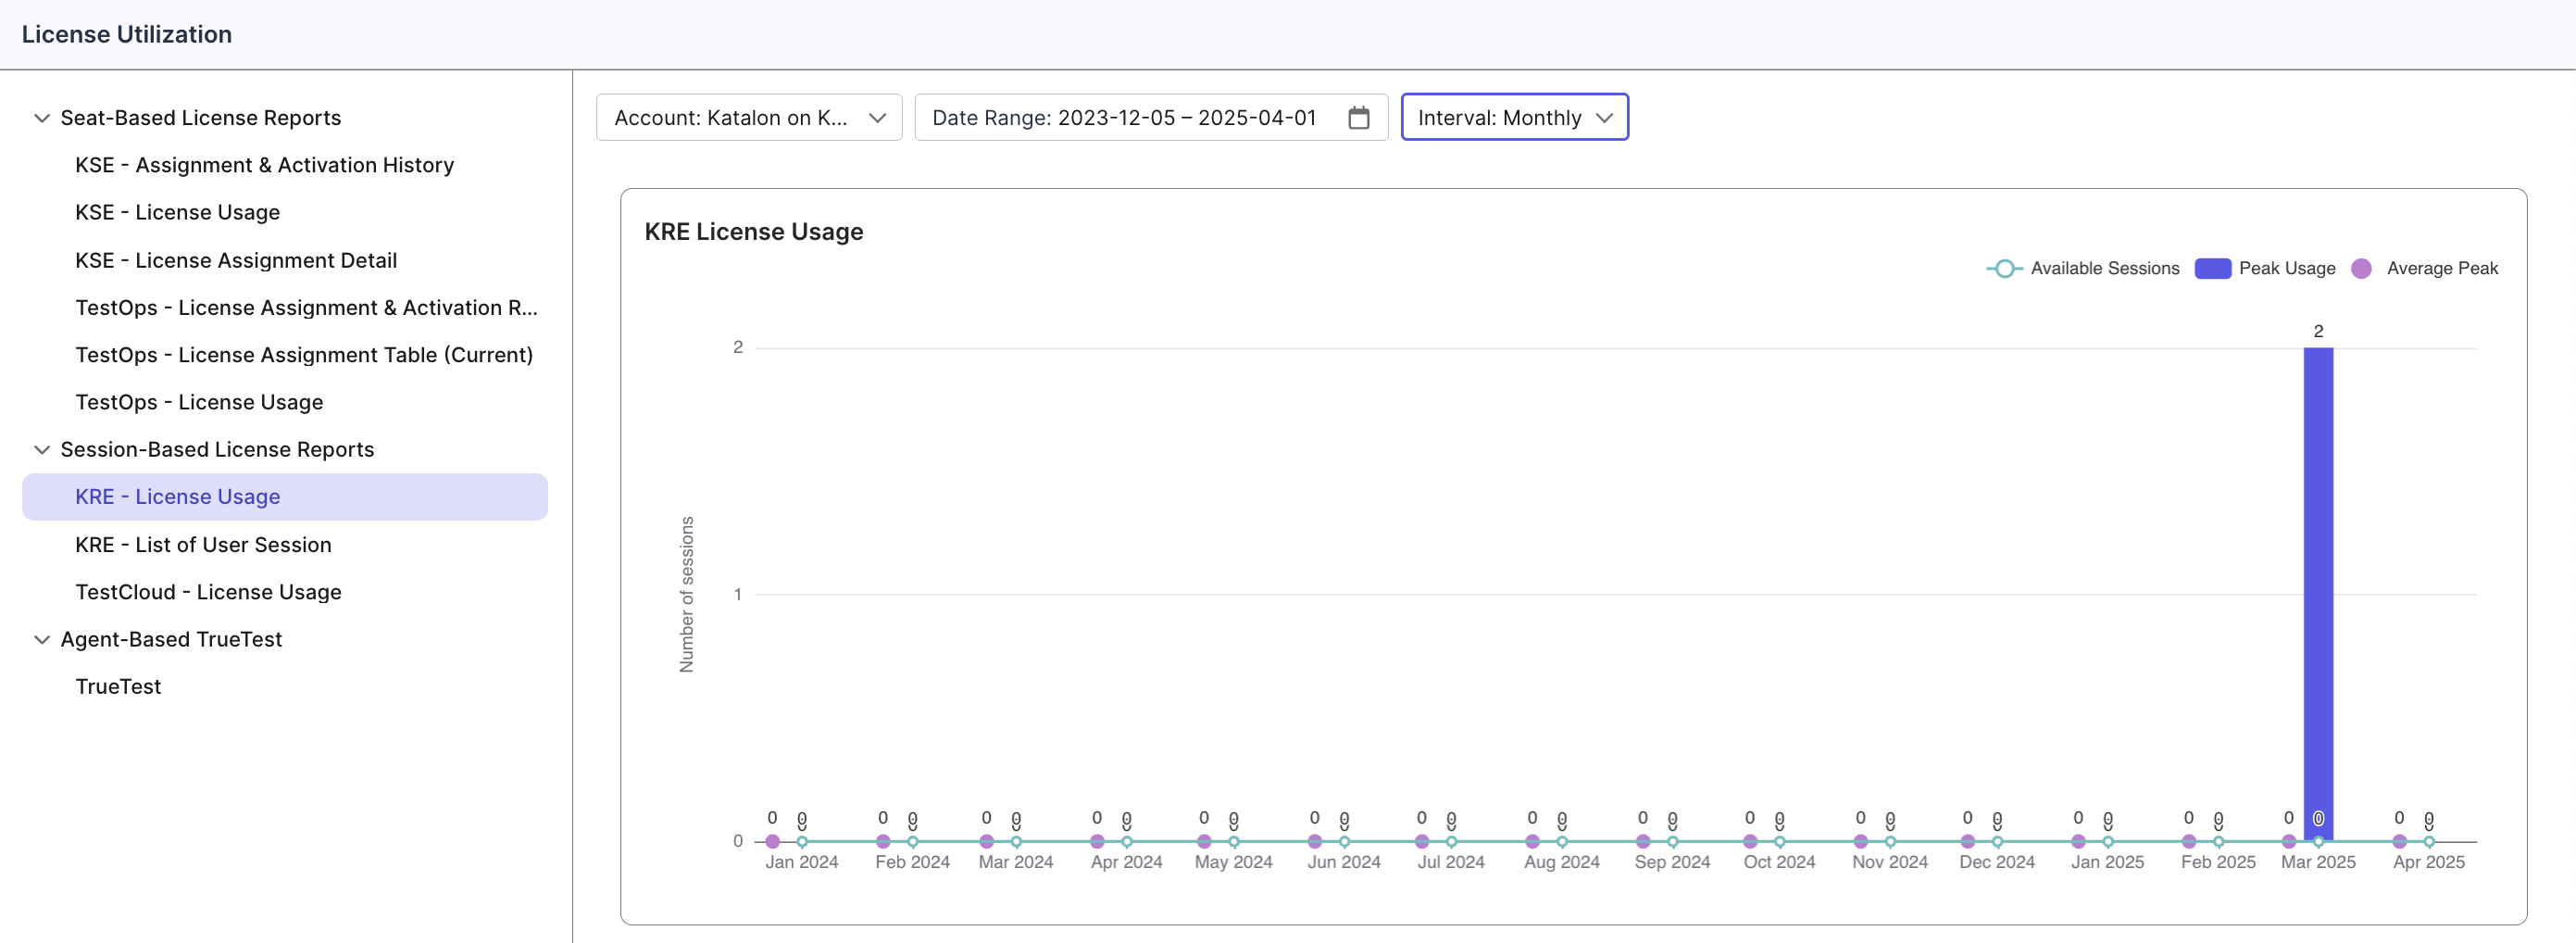
The visualization highlights usage gaps and peak demand periods, enabling you to make informed decisions about resource distribution and optimization across your testing environments.
Katalon Runtime Engine – User Sessions
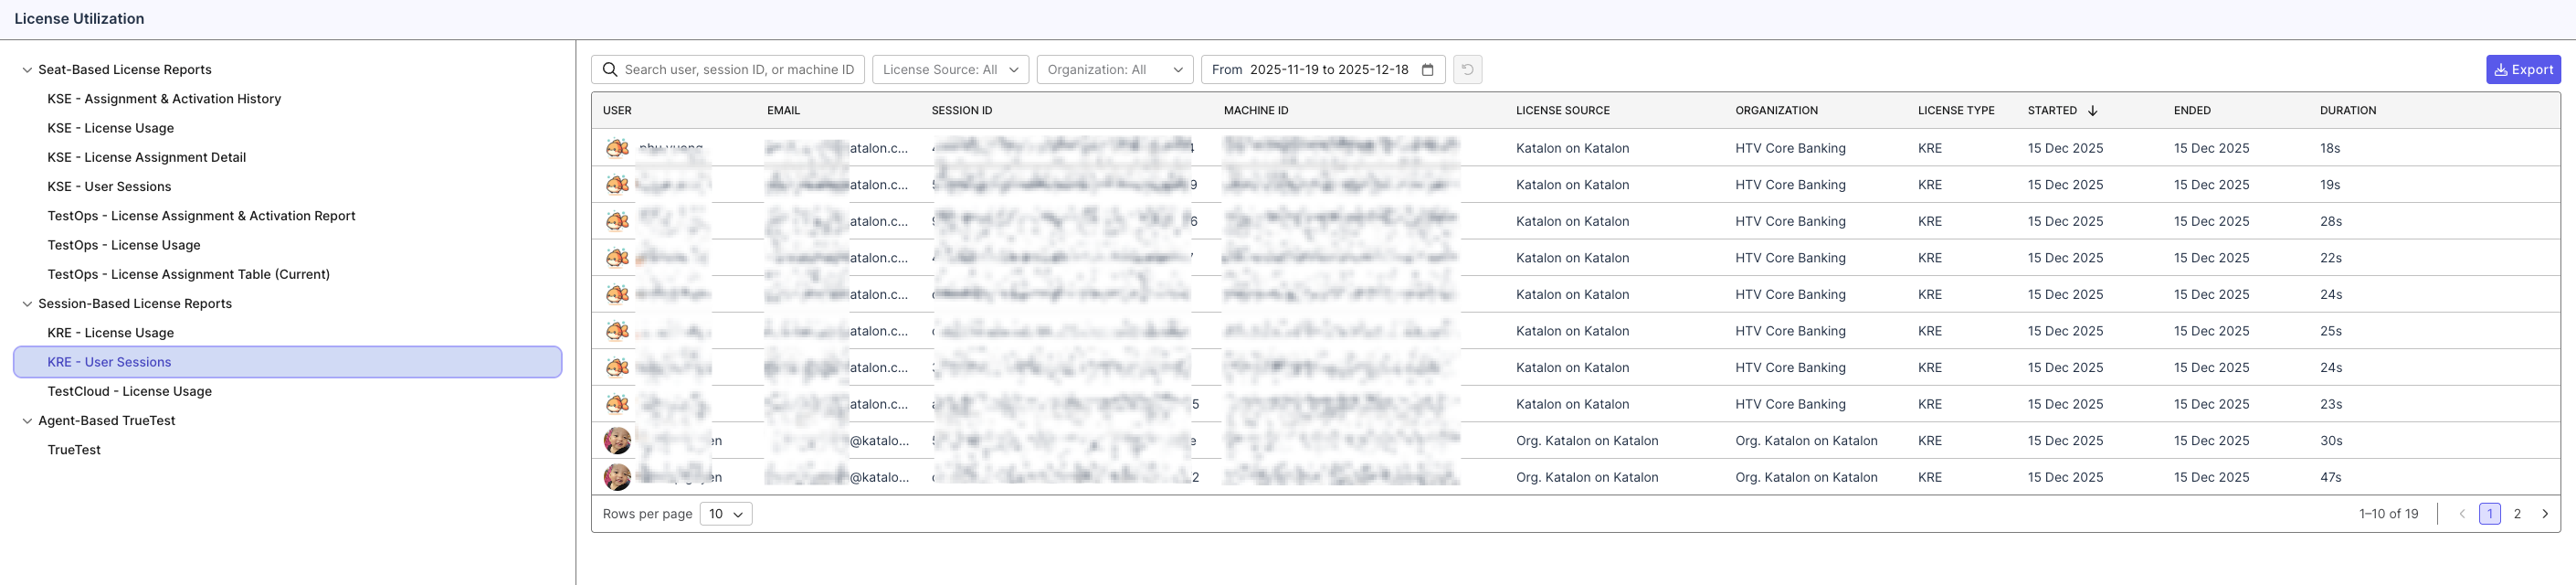
The Katalon Runtime Engine User Sessions report provides a session-level log of Katalon Runtime Engine license usage, showing exactly who is consuming a session, from which organization, and for how long. This table is especially useful for tracking resource consumption, validating session activity, and ensuring efficient allocation.
Use Cases
With this report, you can:
-
Monitor active and historical sessions: Review session-level details including user, email, session ID, machine ID, license source, organization, license type, start time, end time, and duration.
-
Apply advanced filters: Use the search bar to look up sessions by user, session ID, or machine ID, and narrow results using filters for license source and organization.
-
Identify usage patterns: Quickly spot clusters of short or long-running sessions and understand how execution resources are being consumed across teams.
When combined with the Katalon Runtime Engine License Usage chart, this table provides a complete view of how Katalon Runtime Engine sessions are allocated and used over time.
How to View the Report
- Go to Account Settings > Account > License Utilization.
- Under Session-Based License Reports, select Katalon Runtime Engine – User Sessions.
- User: Full name of the user
- Email: User's email address
- Session ID: Unique identifier for the session
- Machine ID: Identifier for the machine running the session
- License Source: Organization or account where the license originates
- Organization: Organization hierarchy the user belongs to
- License Type: Type of Katalon Runtime Engine license being used
- Started: Session start timestamp
- Ended: Session end timestamp (if completed)
- Duration: Total session duration
- (Optional) Use the search bar to find a specific user, session ID, or machine ID.
- (Optional) Apply filters using License Source and Organization to narrow the table to specific license sources or organizational units.
- (Optional) Adjust the date range (based on the session Started date) to focus on a specific analysis period.
- (Optional) Click Export to download all currently filtered data as a CSV file.
Test Execution - Cloud – License Usage
The Test Execution - Cloud License Usage chart provides detailed visibility into your Test Execution - Cloud license utilization patterns. This interactive visualization helps you monitor session resource usage, identify demand patterns, and optimize your license allocation to ensure efficient testing operations.
Use Cases
This report helps you:
- Identify periods when testing demand approaches your license limits
- Discover underutilized resources that could be reallocated
- Plan capacity based on historical usage patterns
- Make data-driven decisions about future license investments
Interactive tooltips reveal detailed metrics when you hover over data points, allowing you to examine specific usage information without changing your view configuration.
How to View the Report
-
Go to Account Settings > Account > License Utilization.
-
Select Test Execution - Cloud – License Usage.
The chart tracks three essential metrics within the selected timeframe:
- Available Sessions: Total Test Execution - Cloud session licenses available during each time interval, using the most current allocation data.
- Peak Usage: Maximum number of concurrent Test Execution - Cloud sessions during each measured interval, revealing when your demand approaches capacity limits.
- Average Peak: Average peak usage across time periods. For monthly views, this represents the average of daily peak usage values.
-
(Optional) Apply filters to refine your analysis by organization, date range, or time interval.
-
(Optional) Hover over the chart to view detailed data points.

The visualization highlights both usage gaps and demand spikes, enabling you to proactively manage your testing resources and optimize license allocation across teams and projects.