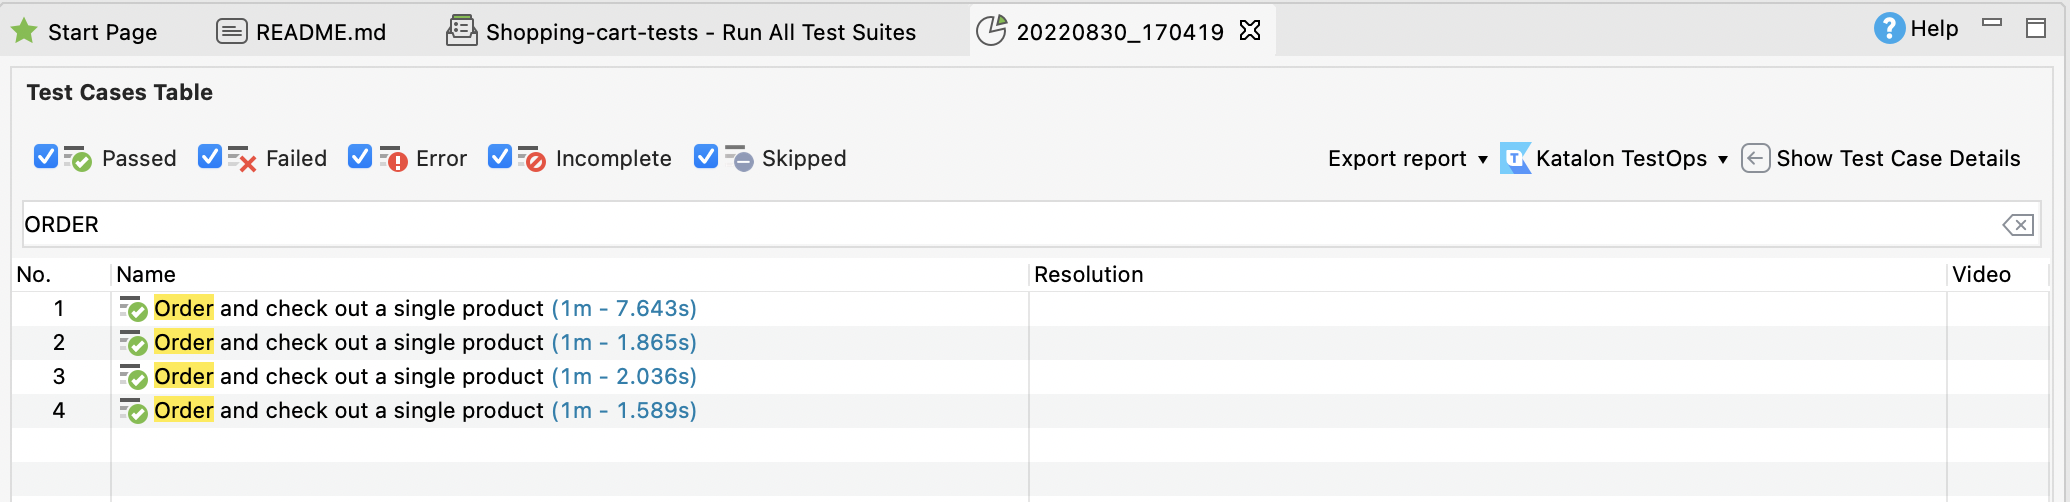
Toolbars and views in Katalon Studio
Toolbars

The main Toolbar contains the most common actions you usually perform, for example: creating test resources or executing automated tests.
System features
| Icon | Description |
|---|---|
 | Save the currently opened test artifact. |
 | Save all opened test artifacts. |
 | Open Spy Web to capture elements on websites. |
 | Open Spy Mobile to capture elements on mobile applications. |
 | Open Spy Windows Object to capture elements in Windows. |
 | Open Record Web to record WebUI test cases. |
 | Open Record Mobile to record mobile test cases. |
 | Open Record Windows Actions to record Windows test cases. |
 | Create a new test case. |
 | Open Katalon AI Assistant chat window. |
 | Run the currently open test case. You can select an app to run the test from the dropdown list. |
 | Run and debug the currently open test case. See Debug a test case. |
 | Stop the current test execution session. |
 | Open Command Builder to generate commands for console execution. |
 | Execution profile (testing environments) to be applied when running tests. |
 | Access our Help Center and our Forum. |
 | You can also submit any feedback or further questions to our channel. Katalon experts and users will try to help you as soon as possible. |
Plugin features
| Icon | Description |
|---|---|
 | Katalon True Platform An AI-native platform for test management and advanced reports & analytics. |
 | Self-Healing automatically tries out other locators when the default locator fails. |
 | Command for Git activities. You can select these options by selecting these options that appear in the dropdown list (after enabling Git):
|
 | Import test case from JIRA integrated account. |
Tests Explorer view
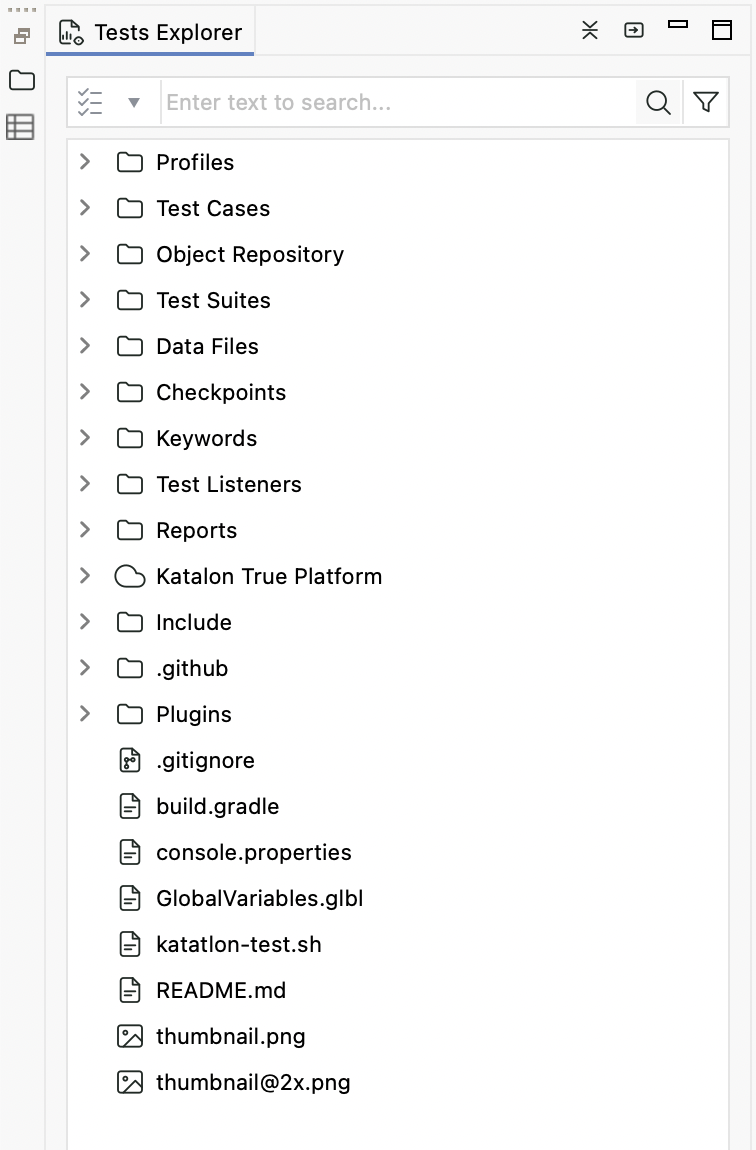
The Tests Explorer view allows you to browse the structure of your project and access all your test artifacts. Using the context menu on the view, you can create new artifacts, organize the view's items, or drag and drop them to certain editor views if needed.
| Group | Description |
|---|---|
| Profiles | List all execution profiles of the current project |
| Test cases | List all test cases within current project |
| Object repository | List all test objects of the current project |
| Test suites | List all test suites and test suite collections of the current project |
| Data files | List all test data of the current project |
| Checkpoints | List all checkpoints of the current project |
| Keywords | List all custom keywords of the current project |
| Test listeners | List all test listeners of the current project |
| Reports | List all generated reports of the current project |
| TestOps | Contains all test runs from TestOps server |
| Include | Contains Cucumber features file and step definition |
| Plugins | Contains all plugins file of the current project |
Customize Test Explorer
By default, Tests Explorer displays all test artifacts. To customize Tests Explorer, navigate to Project > Settings > Explorer and uncheck test artifacts you want to hide, then click Apply and Close.
Editors
The editor is used to modify the detailed information of an object. Each test artifact has its own editor.
Test Case editor
A test case is a set of actions executed to verify a particular feature or functionality of your software application.
When you open a test case, the test case editor contains the detailed information of that test case in the following tabs:
- Manual: displays the manual view, where the basic keyword-driven configuration allows you to create automated tests without coding. Refer to manual view for more details.
- Script: displays the script view, where advanced users with a programming background can modify test scripts using either Groovy or Java language. Refer to script view for more details.
- Variables: shows all defined variables for that test case. Refer to test variables for more details.
- Variables (Script mode) tab: shows all defined Variables for that Test Case in Script mode.
- Data binding: The Data binding tab allows you to conduct data binding at the test case level. You can refer to this document for further instruction: Data-driven testing at the test case level.
- Integration: displays your configured integration in the project, for example: qTest, Jira, Azure DevOps, etc. Refer to Integrate test case for more details.
- Properties: displays general information about the Test Case, including the Description and the Comment.
Test Object editor
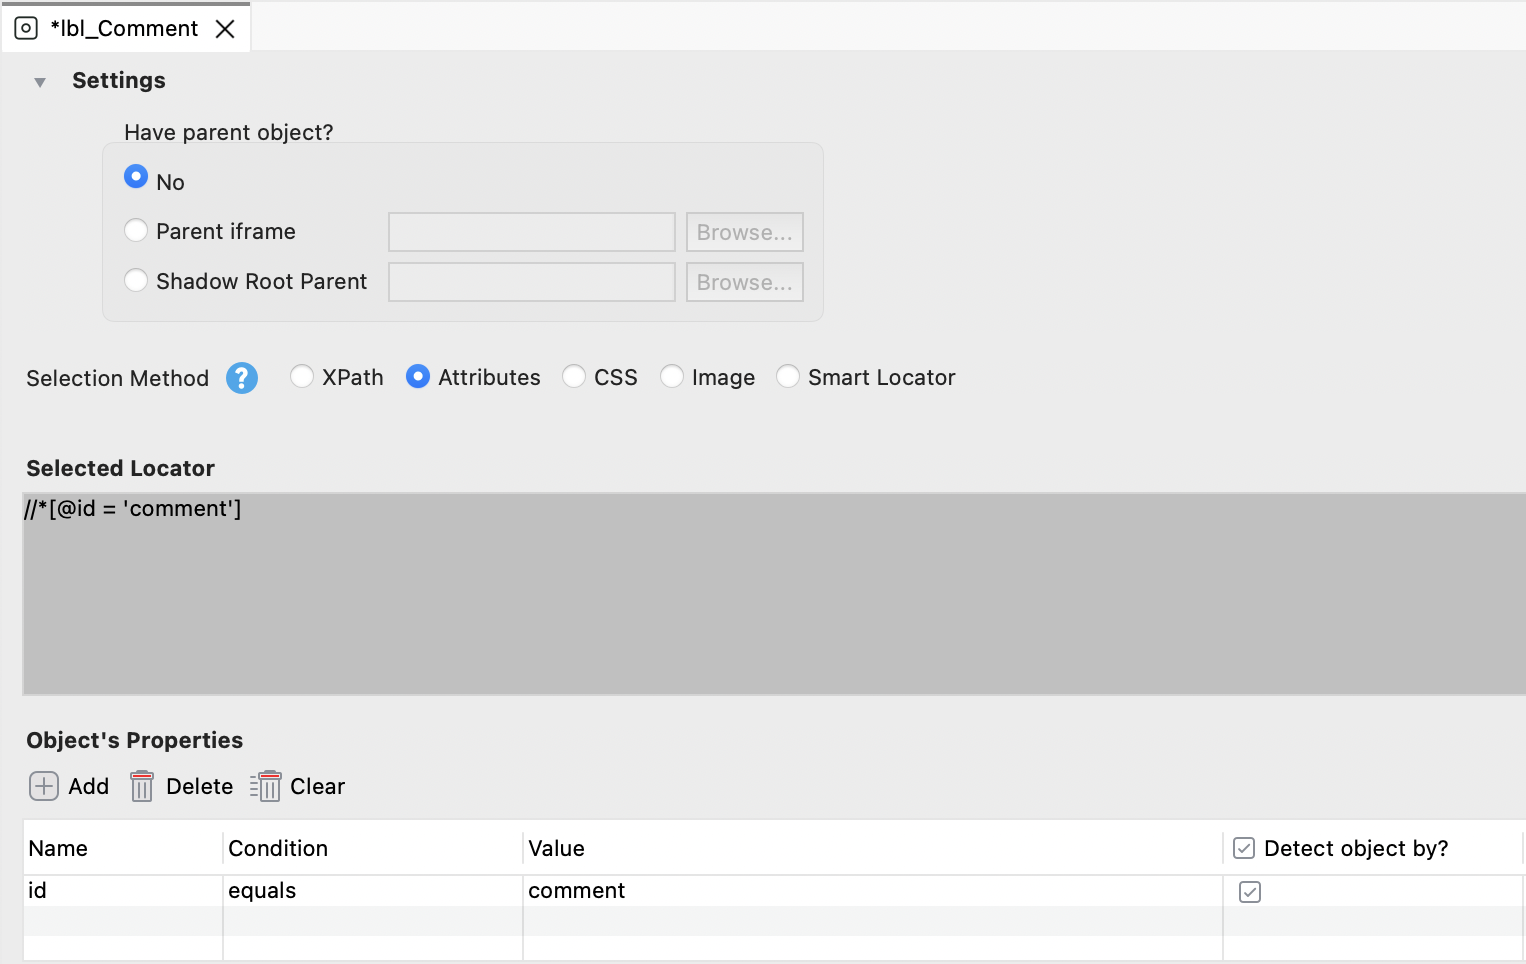
To open a test object, go to Tests Explorer > Object Repository and select the object you want to open. The test object editor displays all detailed information of a test object, including properties and object identification mechanisms. Refer to Spy Object for more details.
Web Service editor
To open a Web Service, go to Tests Explorer > Object Repository and select the Web Service you want to open. When you open a RESTful or SOAP request object, the Web Service editor displays detailed information of the current project, including the resource URL, request methods, and parameters.
For more details on each functionality, refer to the dedicated guide:
Test suite editor
A test suite (TS) is a collection of test cases.
When you open a test suite, the test suite editor displays detailed information of that test suite, including the following tabs and functions:
- Main: The main tab displays basic information about the test suite, such as test cases to be executed, flakiness or average execution duration. For more details, refer to Execute a test suite.
- Script: The script tab displays the script view, where you can set the environment, setUp, tearDown, or any configuration at the test suite level. To learn more about test suite configuration, see Test Suite.
- Integration: The integration tab displays information regarding your test suite integration, for example, with qTest. For more details, refer to Integrate test suite.
- Analytics: After a test suite execution, the analytics tab displays an analytics overview, including the last 3 recent runs of the test suite, execution statuses, and the average duration of the last 3 runs.
- Result: After you execute the test, the result tab displays the result of the latest execution, including the Passed/ Failed status of each test case, the summary report, all execution settings, and the execution environment.
Test suite collection editor
A test suite collection (TSC) contains a list of test suites, which allows you to execute multiple test suites together in either parallel mode or sequential mode.
- Main: the tab displays which test suites to be executed, the profile of each test suite, and the execution mode of the test suite collection.
- Result: displays the result of the latest execution, including the executed status and the Failed/ Total rate of each test suite. Double-click on a test suite or test case to view detailed results.
Refer to Test suite collection for more details.
Data file editor
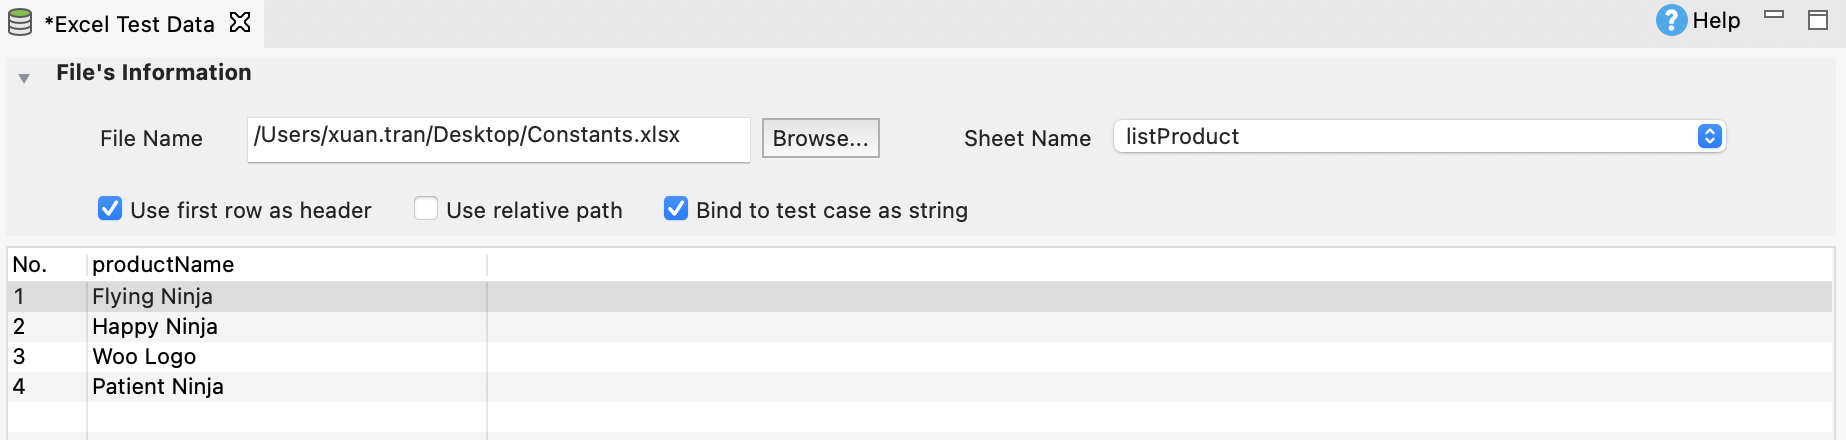
When you open a data file, the data file editor displays detailed information of the data file, including the data source and the data set preview. You can upload your data from an Excel file, a CSV file, a database query or create your own data file in Katalon Studio. Refer to Manage Test Data for more details.
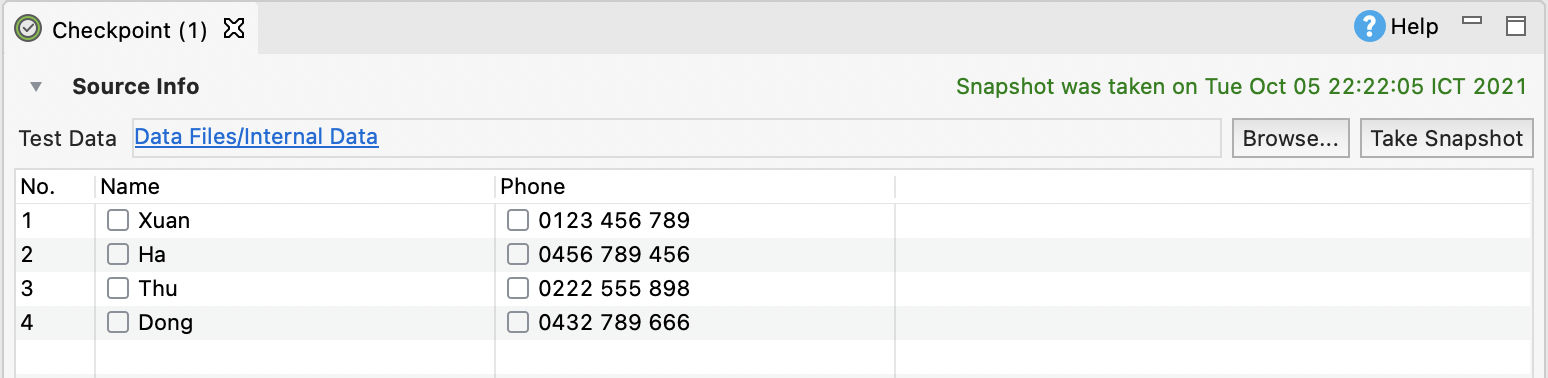
Checkpoint editor
When you open a checkpoint, the checkpoint editor displays the detailed information of the test data, including the data source and its taken snapshot. Refer to Manage Checkpoints for more details.
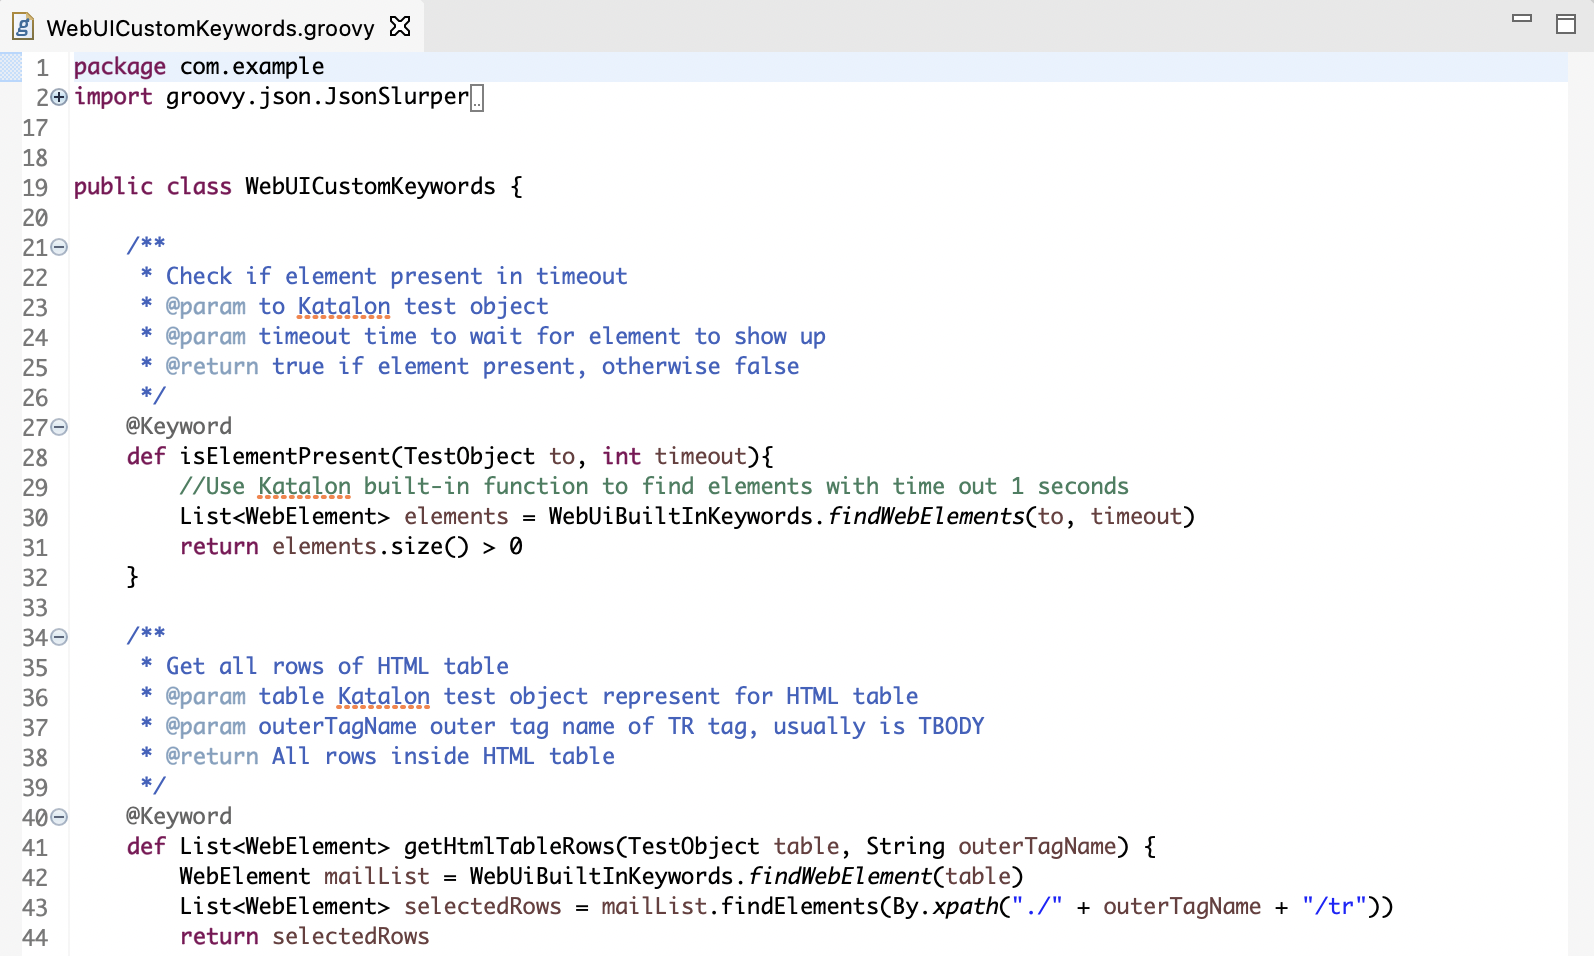
Keyword editor
When you open a custom keyword, the keyword editor displays the keyword content in script view. This scripting editor is similar to the script view of test cases, where you can define new custom keywords using Groovy or Java. Refer to Introduction to custom keywords for more details.
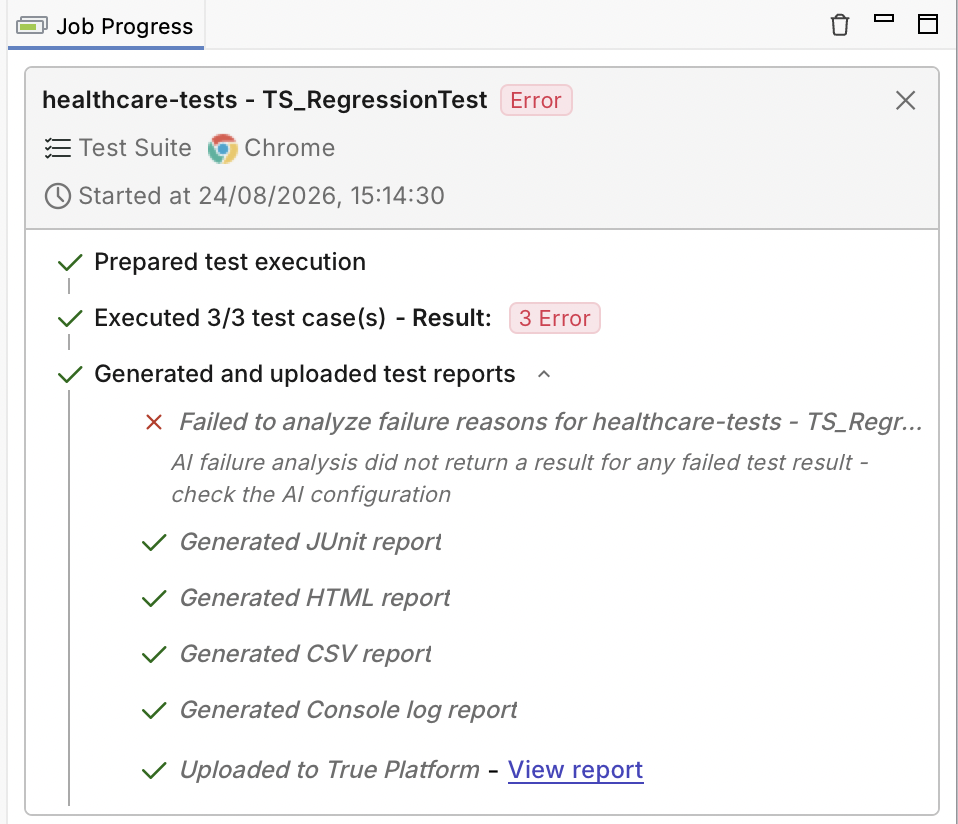
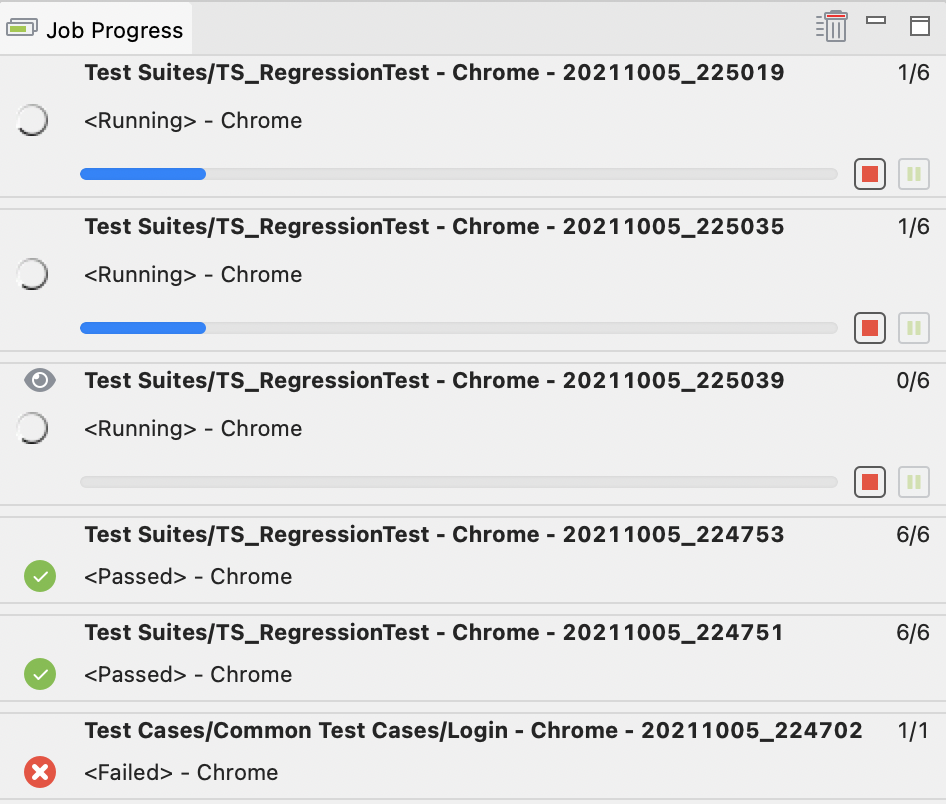
Job progress view
The Job Progress view allows you to see the progress of executing test cases, test suites, and test suite collections. It displays the execution status, environment, start time, completed execution steps, generated reports, and uploaded report status.
For executions uploaded to Katalon True Platform, click View result in the Job Progress view to open the uploaded execution result.
Introduced in version 11.0.0, the new Job Progress UI is enabled by default. To switch back to Legacy, navigate to Project > Settings > Execution and un-check the Enable Execution Viewer option.
New UI
Legacy UI
Problems tab
The Problems view shows errors and warning messages raised when setting up a project or designing a test case, test suite, test object, or test data.

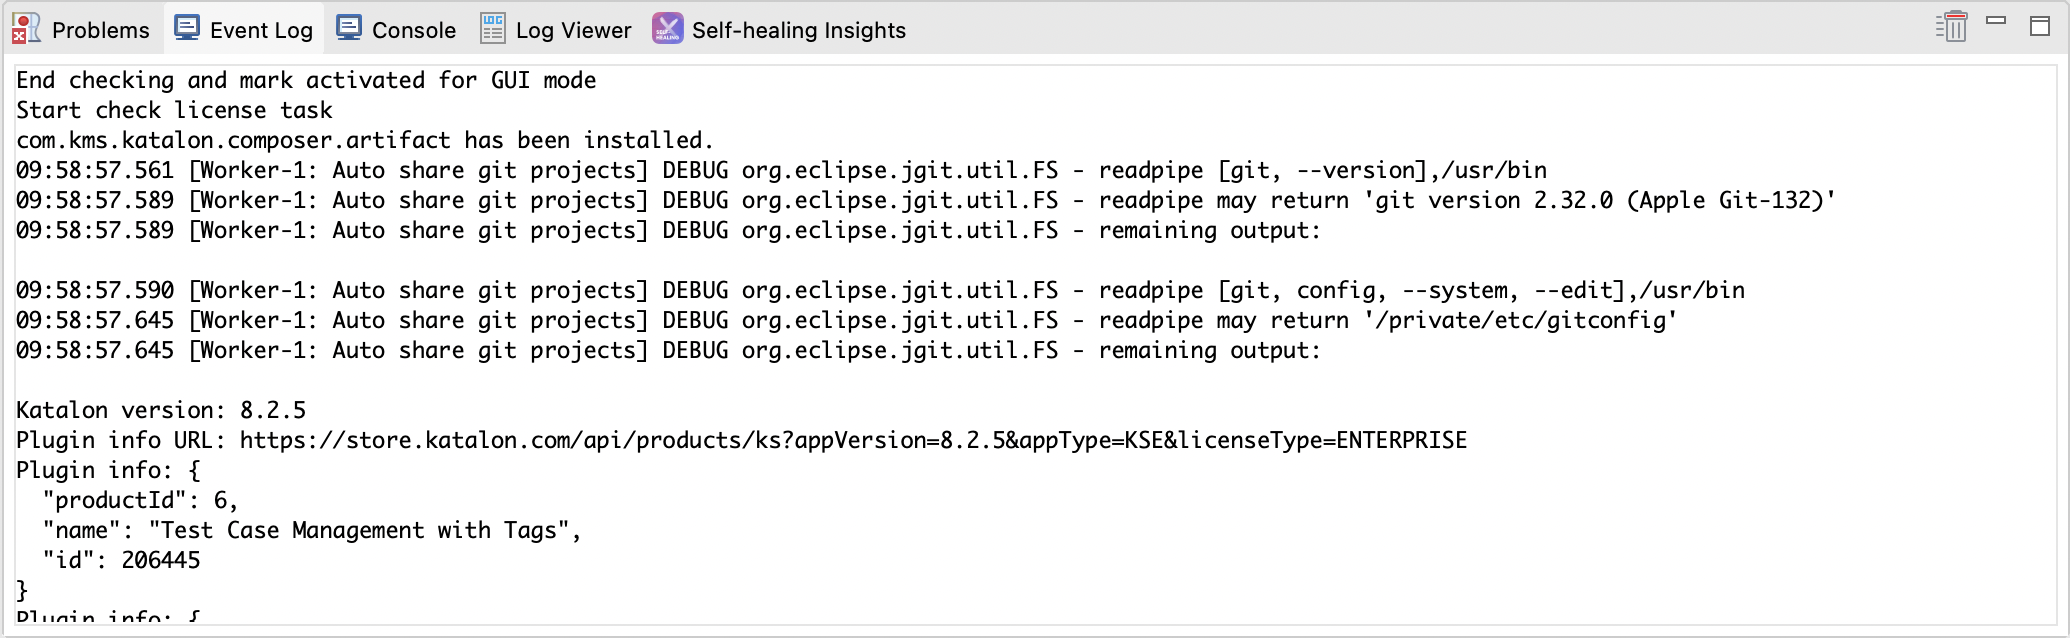
Event Log
The Event Log displays all run-time activities from all plugins and integrations enabled for your test run. Refer to Plugin for more details.
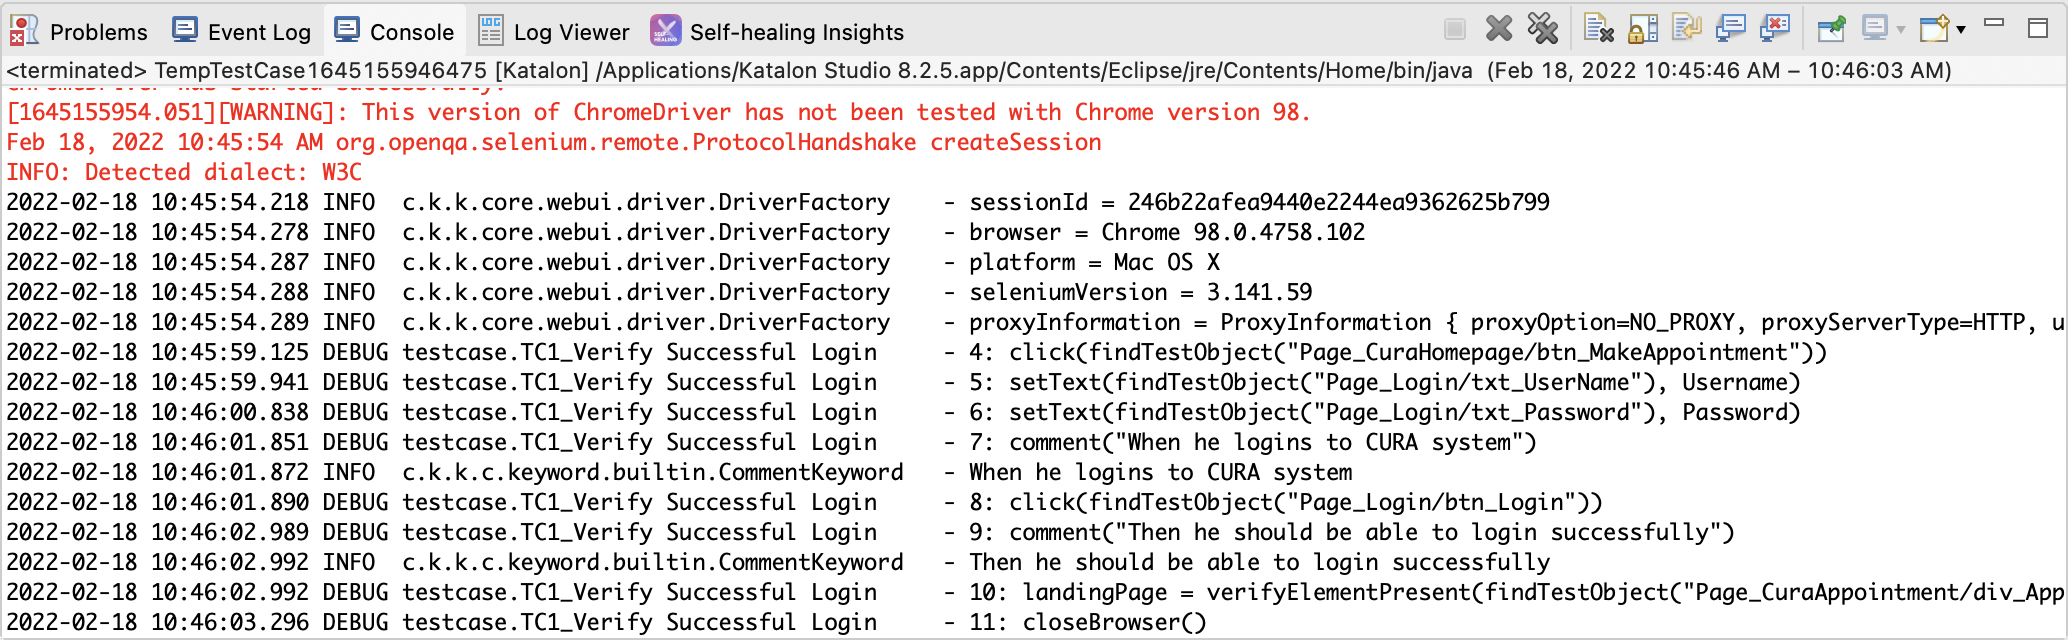
Console
The Console view shows the system logs of all run-time activities performed while Katalon Studio executes the automated test. The console output generated from test scripts is also displayed here.
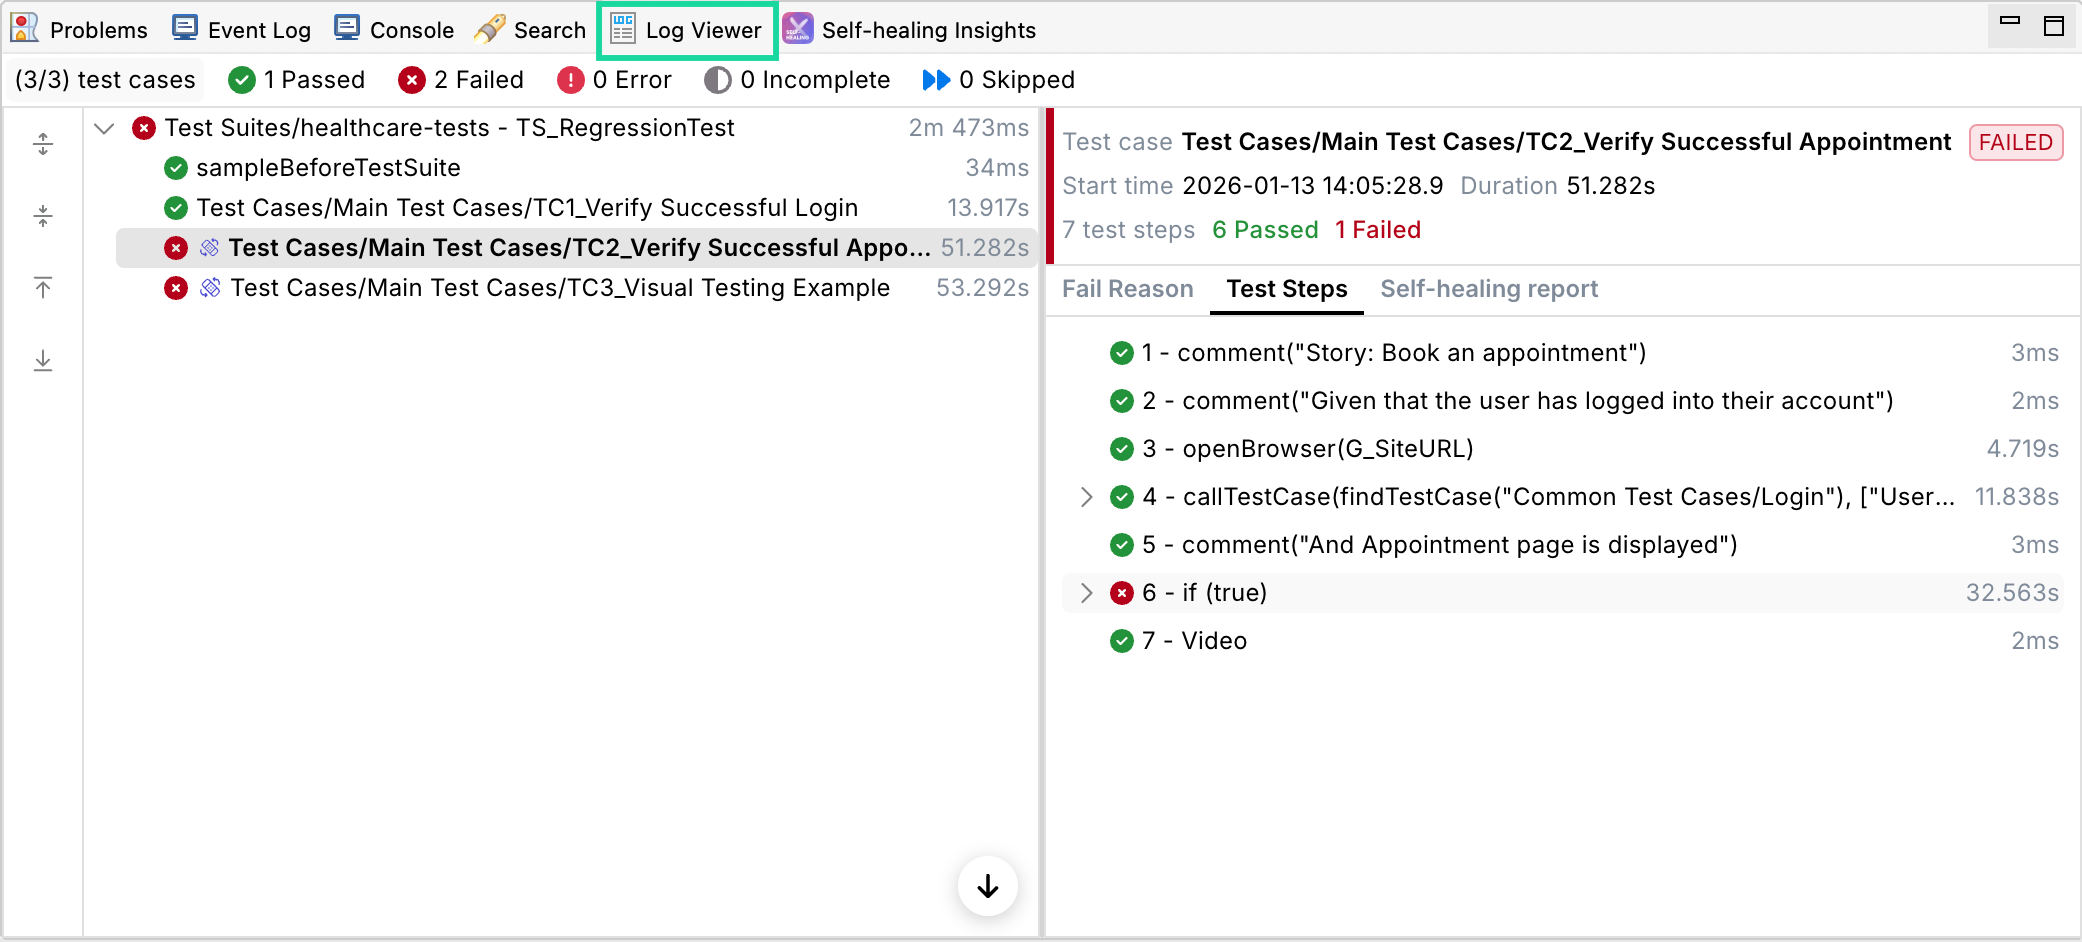
Log Viewer
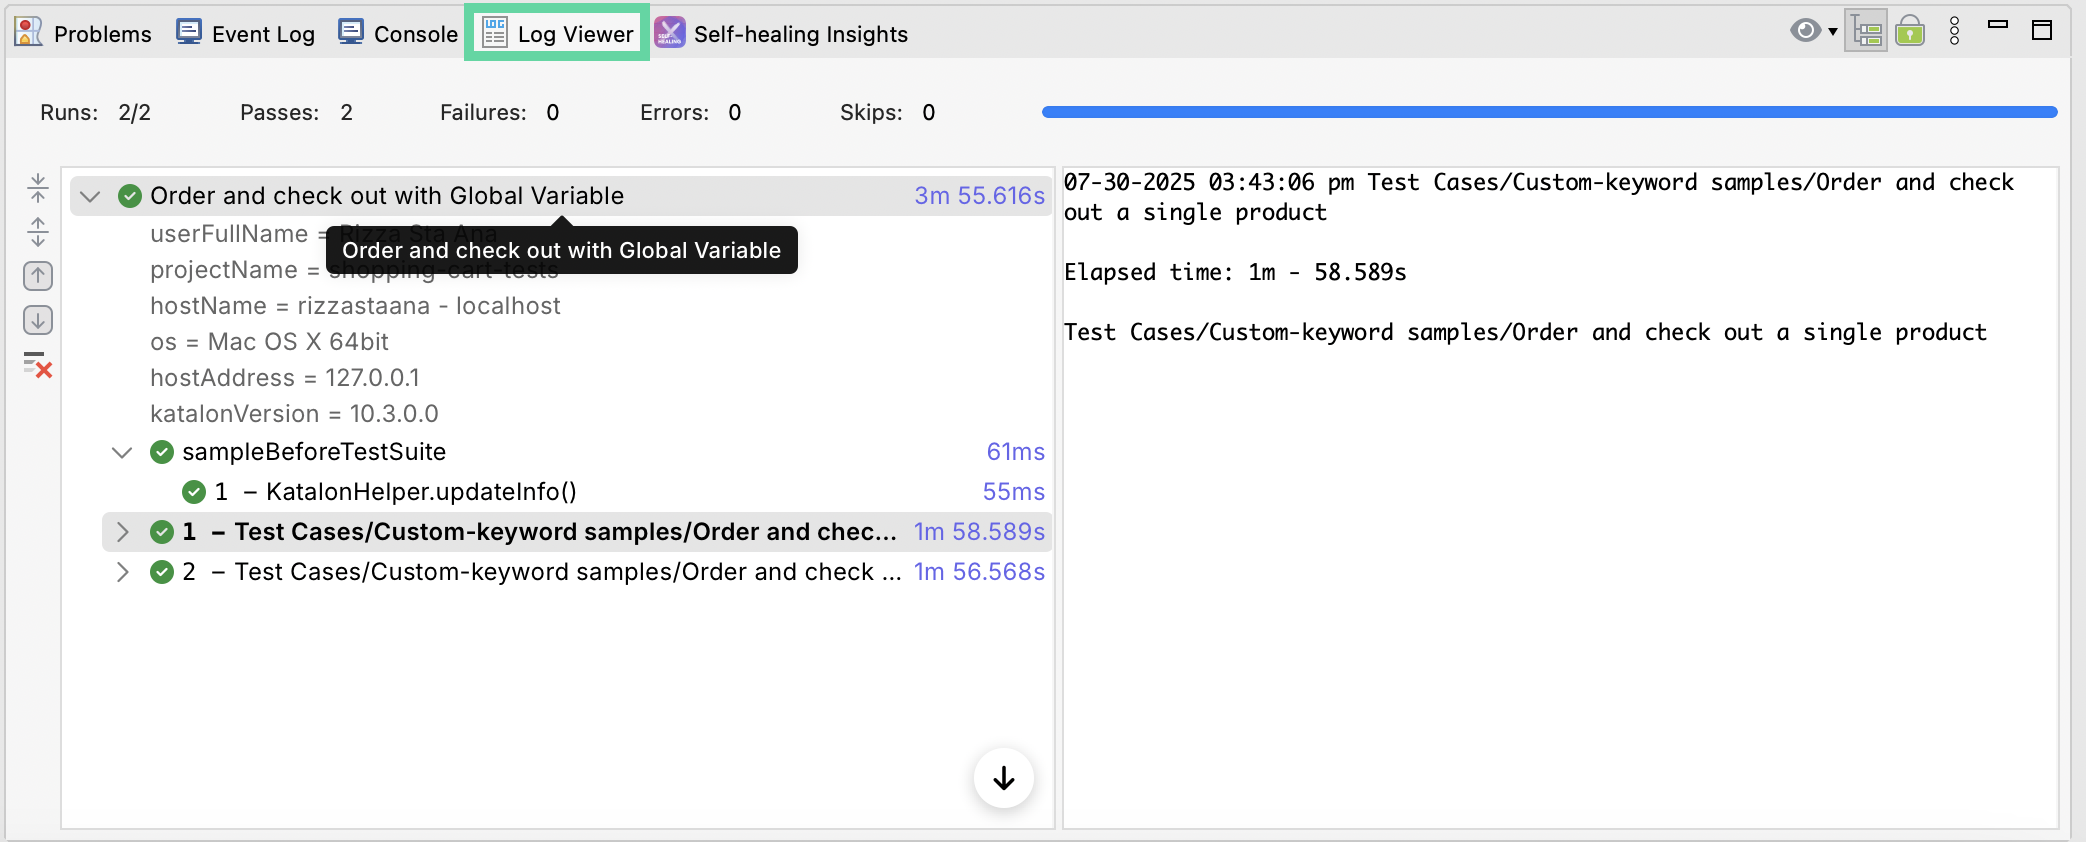
The Log Viewer displays real-time logs of the test execution. Refer to View Execution Log for more details.
Enhanced UI
Legacy UI
Report view
The report view allows you to view detailed information of completed test execution for a certain test suite.
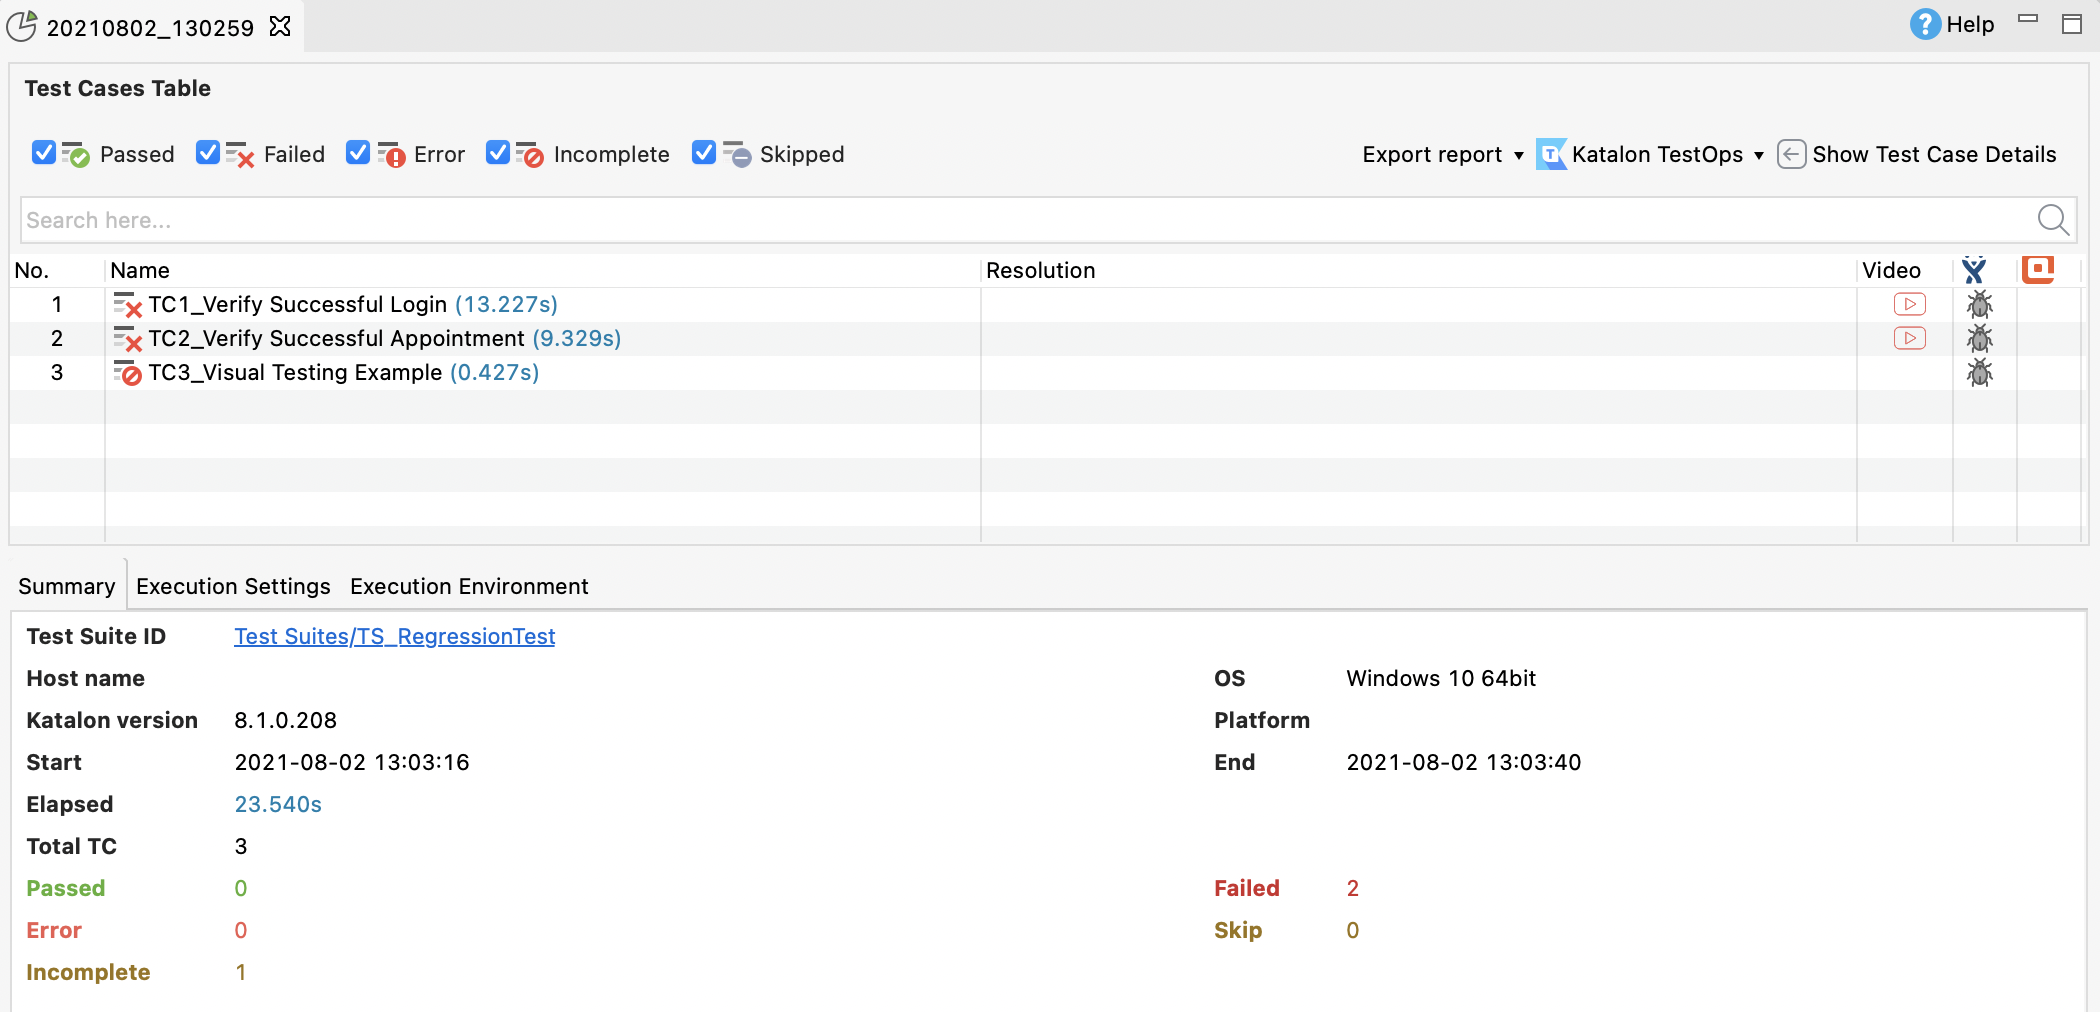
You can use the search bar to find the desired information in your report.