Analyze failure patterns
This document explains how to identify, diagnose, and prioritize failing or flaky automated test cases based on a project’s execution history.
Overview
Analyzing failure patterns helps teams quickly identify consistently failing and intermittently failing (flaky) test cases, based on failure rate distribution. With the Test Failures Analysis Report you can focus debugging effort where it reduces the most risk, improve overall test reliability, and lower maintenance overhead for CI pipelines and releases.
Steps to analyze failure patterns
Any failed test cases in your concerned scope. Patterns are clearer with at least 10-20 failures.
From the Katalon True Platform sidebar, go to Analytics > Reports > Test Failures Analysis Report.
Once you've accessed the report, follow these steps to analyze failure patterns.
Step 1: Select scope and filters
Before analyzing patterns, scope your data to a relevant subset. Below are a few examples:
-
By time range:
-
Last 7 days: Recent failures and current sprint issues
-
Last 30 days: Broader pattern detection across multiple sprints
-
Custom date range: Target specific release cycles or deployment windows
- Filter by test suite (optional): Narrow analysis to specific test suites if investigating targeted areas
-
Regression suite: Critical path failures
-
Smoke tests: High-priority basic functionality issues
-
Feature-specific suites: Isolated feature investigation
Step 2: Prioritize test cases by failure rates
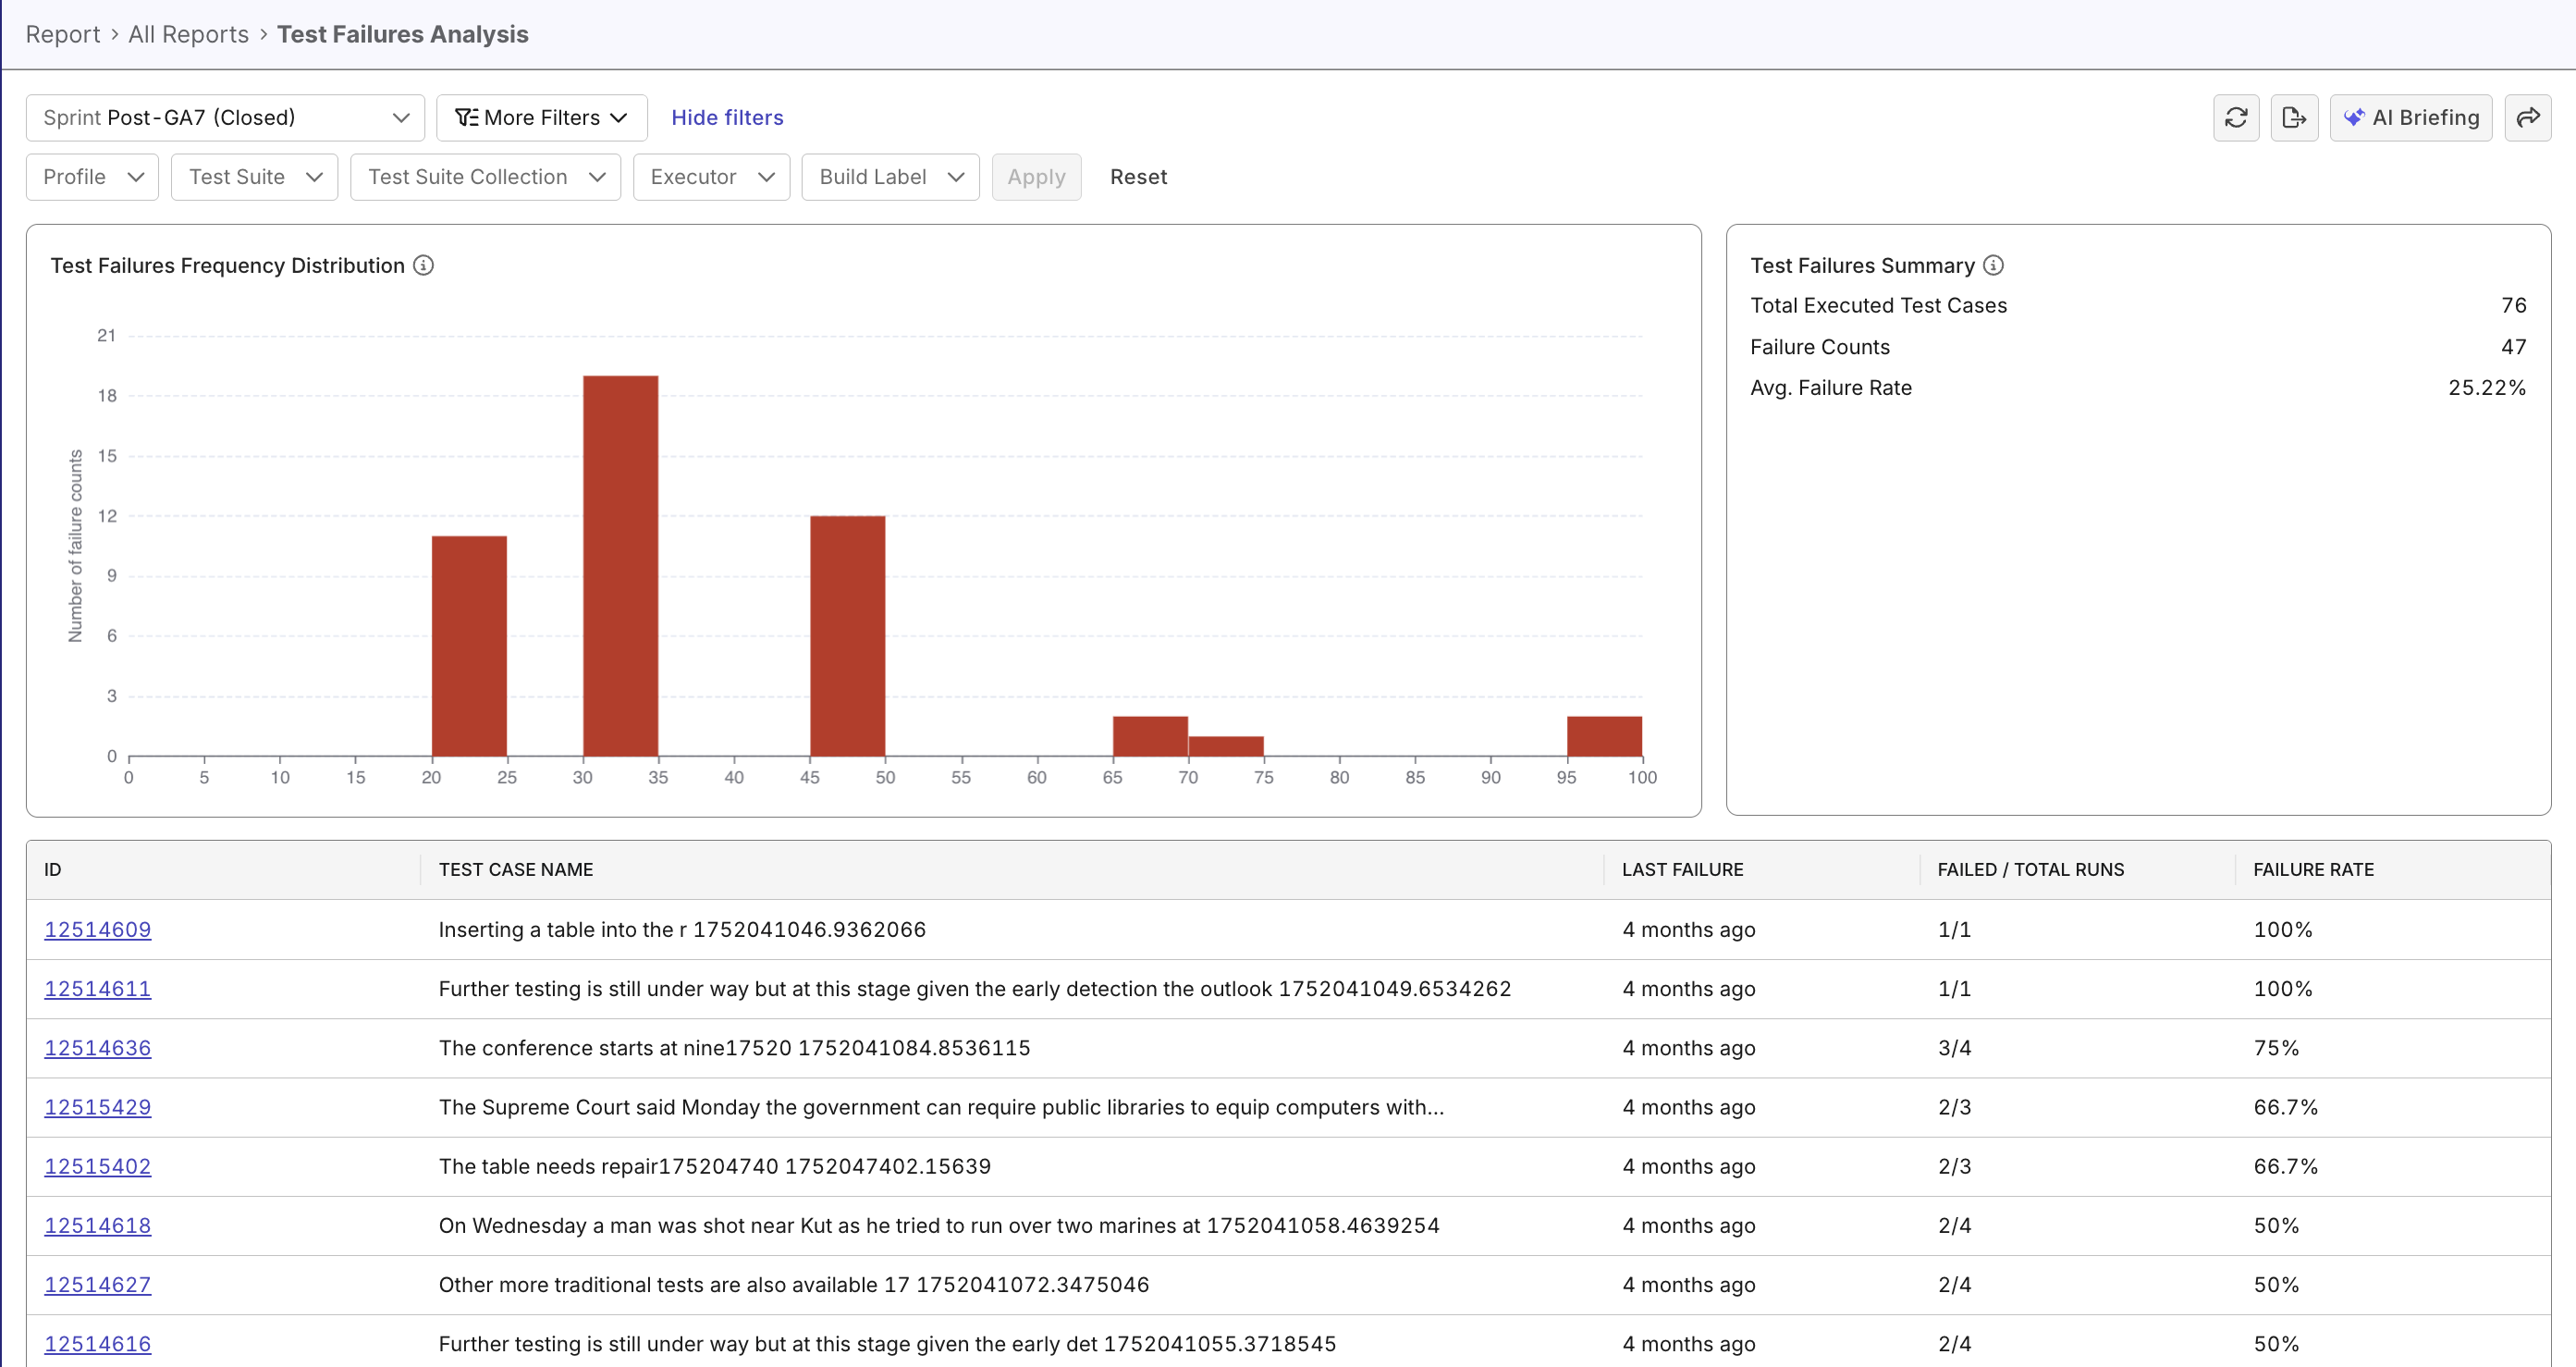
The histogram visualizes how many test cases fall within each failure rate range (e.g., 0–10%, 10–20%, etc.)
- High concentration at 100% > Broken or invalid tests.
- Spread in 20–80% range > Flaky or environment-sensitive tests. See Investigate Flaky Tests if you are in doubt that these tests are flaky.
- Low failure density (less than 10%) > Generally stable tests.
The test faiures summary lists total executed test cases, failure counts, and avg. failure rate to help you quickly assess the data's current failure state.
For each failure rate group, note Total occurrences and affected test count: High occurrence counts (10+ failures) or large number of affected tests indicates high-impact issues worth prioritizing
Step 3: View test case details for troubleshooting
Click on a test case to flag priority status, add notes and details, and assign a teammate to diagnose/take further action.
- Analyze failure patterns is one step in our recommended failure investigation workflow. See Investigate failures to understand how you can use Katalon True Platform capabilities to optimize your failure investigation process.
- Try Katalon AI Assistant to summarize which failure-rate clusters look most urgent and what to inspect next.