Investigate failures
This document explains how to investigate failed tests root cause using Katalon True Platform analytics capabilities.
- Access to Katalon True Platform with Viewer role or higher.
- Failed tests in the concerned time frame/release/sprint.
Failure investigation workflow
Follow these steps to investigate failures.
Step 1: Detect and prioritize failures
In Executions List, navigate to a failed test execution. You will arrive at a "test results details page", where you typically investigate failure:
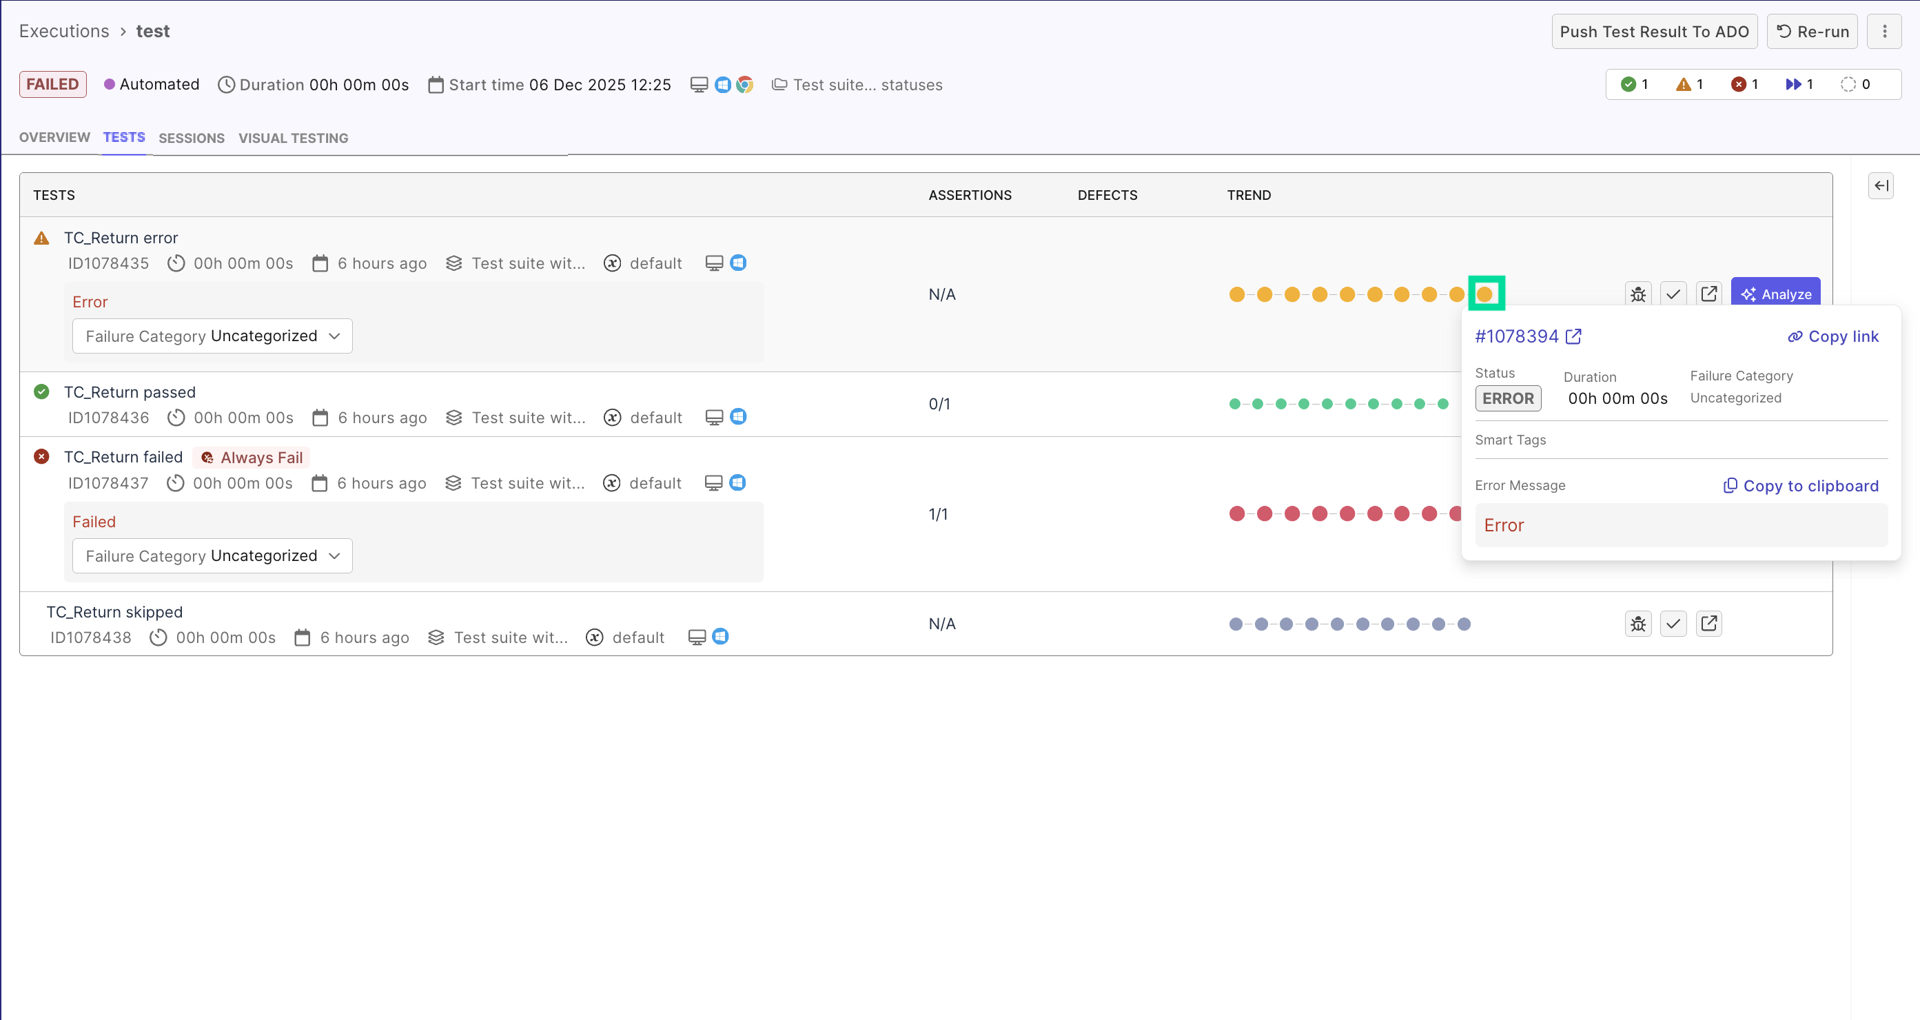
- Use test quality indicators (smart tags) to help you prioritize:
- Test runs with
new failuresor with a high pass rate. These are likely due to a recent code change. - Test runs with
always failedtag. - If a test run has
flakytag, first investigate its flakiness status to avoid wasting efforts on troubleshooting. See Investigate Flaky Test for more details.
Step 2: Review test result details to investigate
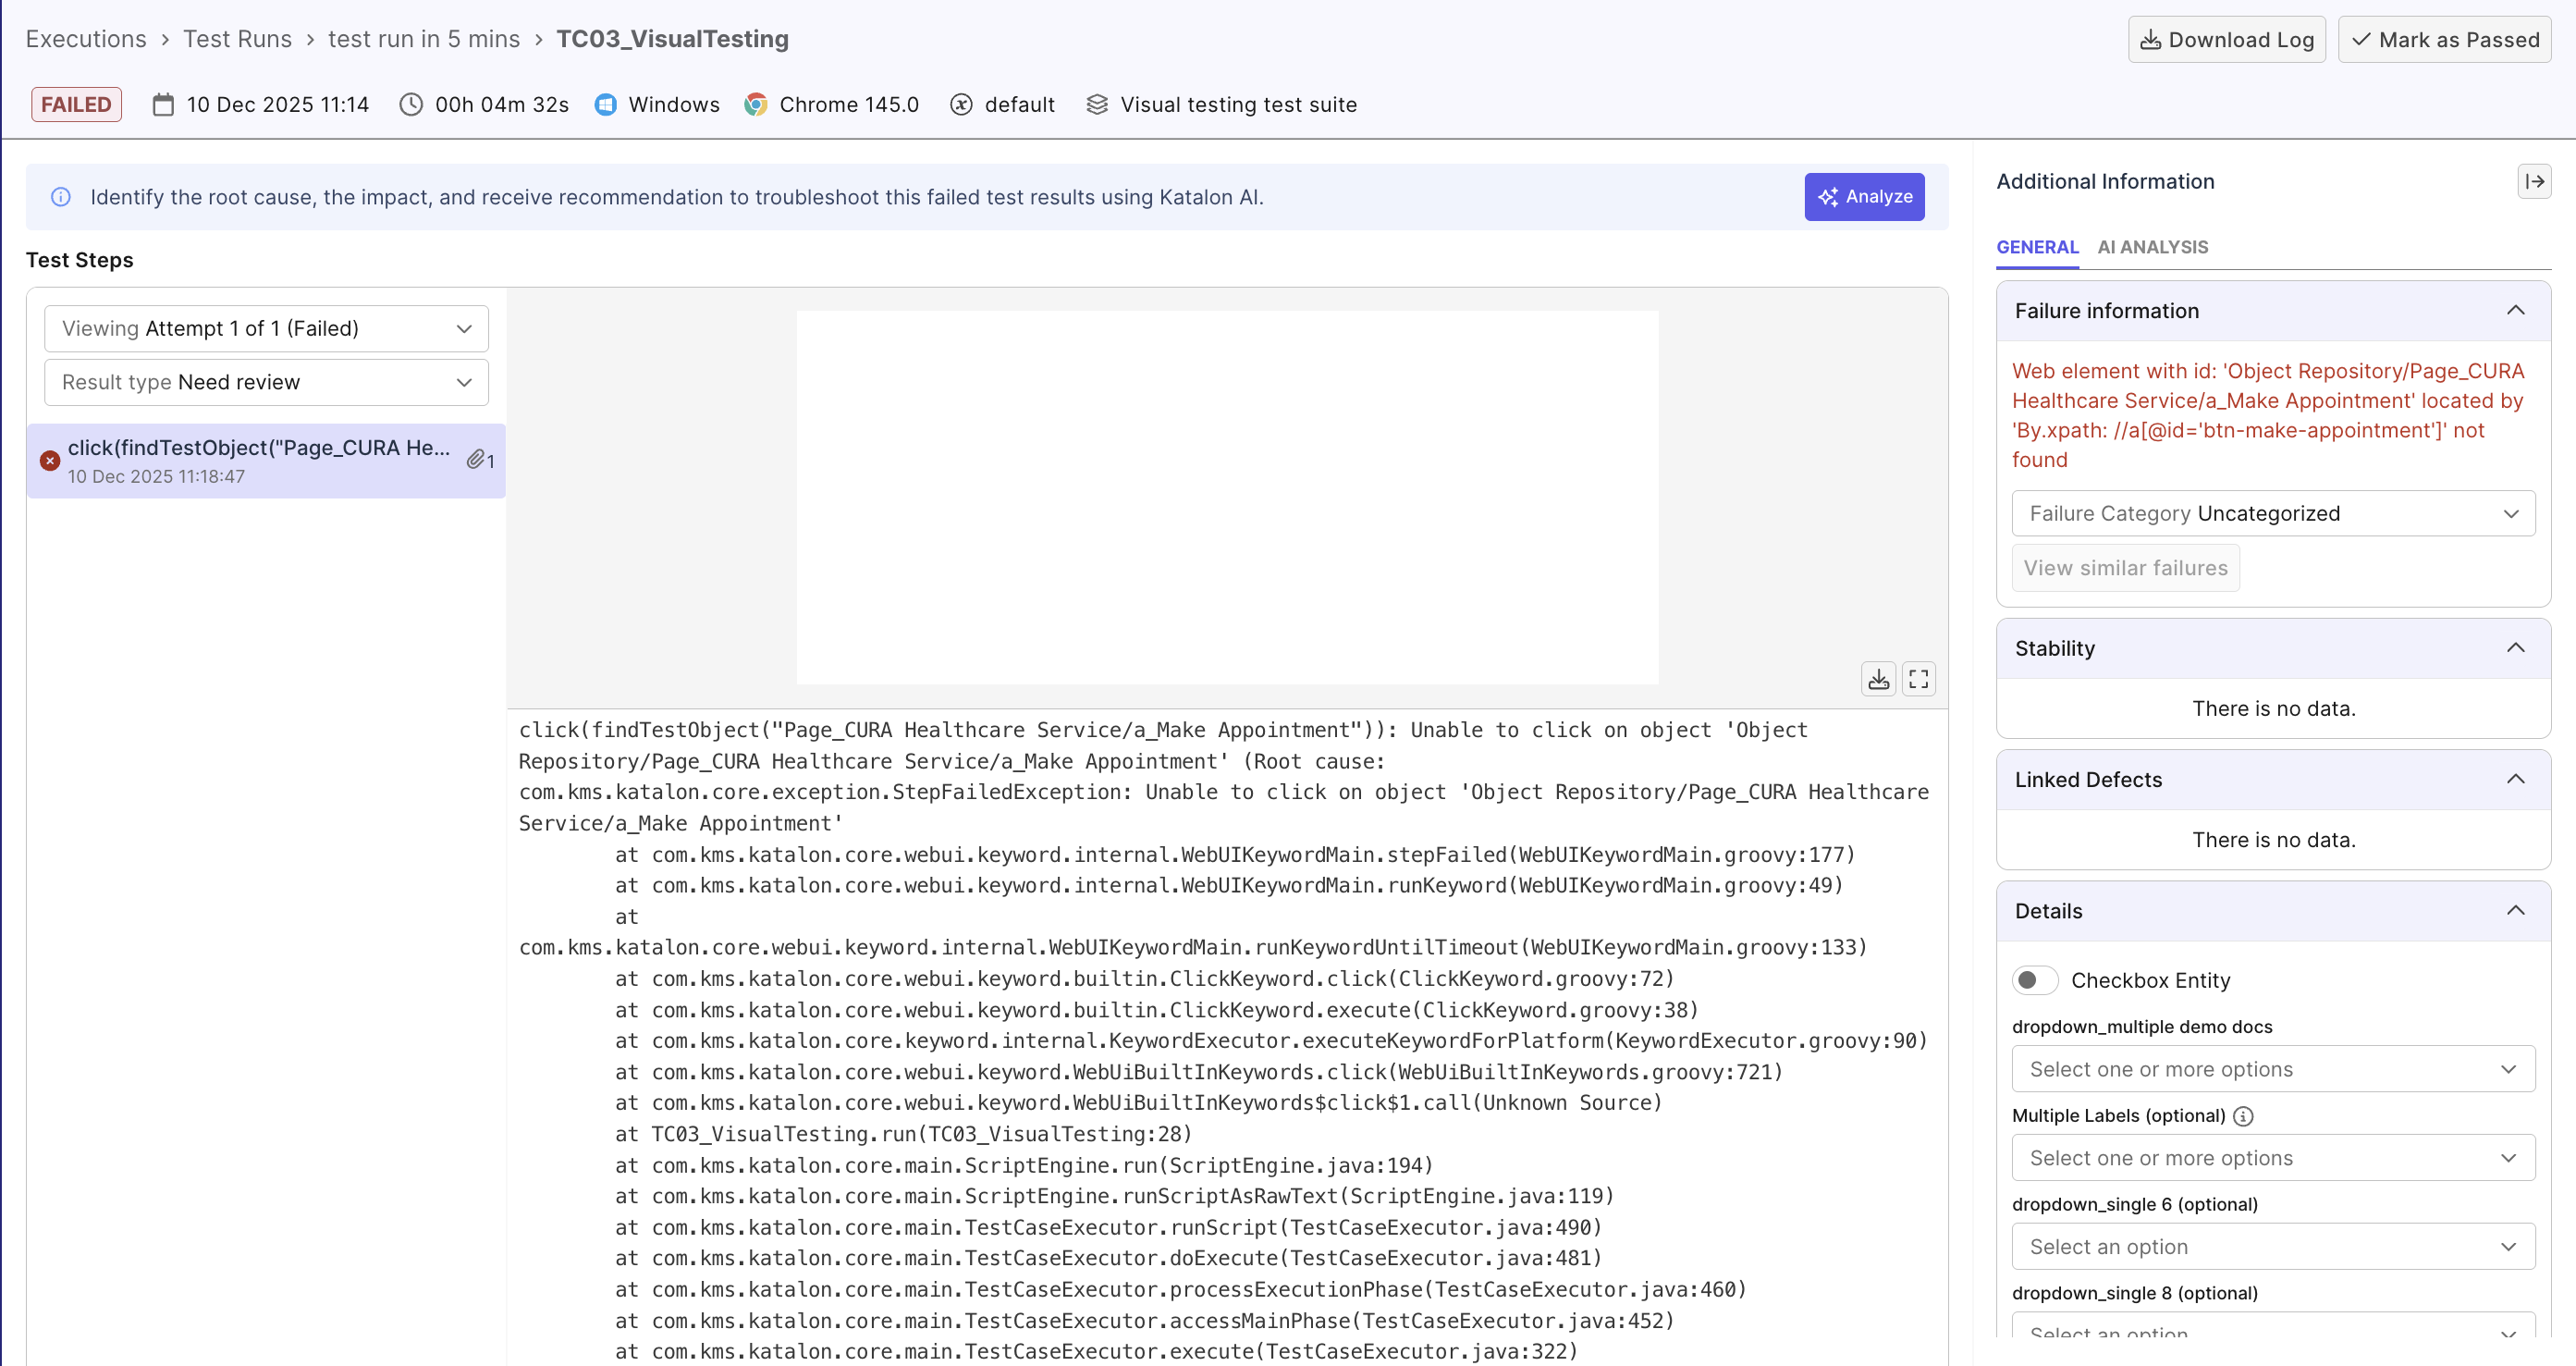
The Test Result Details page is the central investigation workspace.
Read failure message for context
The failure message is your first clue about what went wrong. Below are some common failure messages:
- "Element not found: #submitButton" (locator issue)
- "Expected: 100, Actual: 99" (assertion failure)
- "Timeout after 30 seconds" (timing issue)
- "Connection refused" (network/environment issue)
Identifying these failure messages helps identify issues quickly and saves investigation time.
Triage with AI
With full access to execution context, Katalon AI Assistant can help you understand the failure at a quick glance.
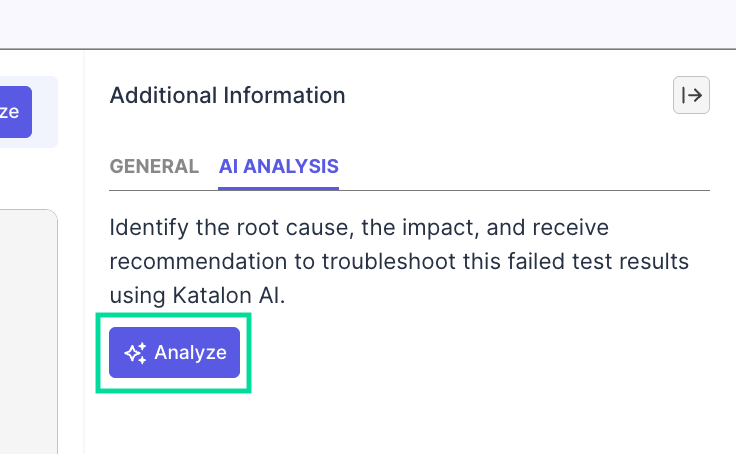
From a failed result, you can trigger root cause analysis in either of these ways:
- Open the failed result and select Analyze in the AI Analysis tab.
- From a dashboard or report that shows a failed result ID/test run ID, chat with the agent directly and provide the ID for failure analysis.
In both flows, the agent automatically reviews details like logs, stack traces, screenshots, scripts, and result pattern to triage the failure and suggest an approach:
Analyze the failure/error manually
Use AI's analysis to focus your manual review.
- View the full Execution Logs with info, warnings, errors, and stack traces.
- Analyze stack traces for exception messages, error location, framework calls... and cross-reference with AI. E.g., If AI mentions
Broken Selector, keep an eye out forNoSuchElementExceptionerror. - Check execution environment: If AI suggested
Environment Issue, check environment details (browser, device, OS type, and execution profile) for any potential root cause. - Review screenshots/videos: go back to the test run details page from the test results, and review images or videos for visual clues. E.g. wrong page loaded, elements overlaying, ...
- Verify test data and configuration: check dataset, inputs, staging/QA/production environment, authentication... to make sure testing data is as expected.
Step 3: Determine Root Cause and Take Action
Classify the failure before assigning a teammate to take action. For example:
- Product Defect: Application behaves incorrectly → Create defect, attach evidence. See Linkages to learn how to create and auto-attach defect to a failed result.
- Test Issue:
- Faulty assertions, locators, or logic → Assign teammate to fix the test and re-run.
- Tests with
flakytag → Follow the Investigate Flaky Tests workflow and if the test is truly unstable (), assign a teammate to review. - Environment Issue: Infrastructure, configuration, or network failures → Escalate to DevOps / infra team
Step 4: Document findings for future reference
Documenting your investigation helps you validate resolutions and quickly traces back in case of future recurrence.
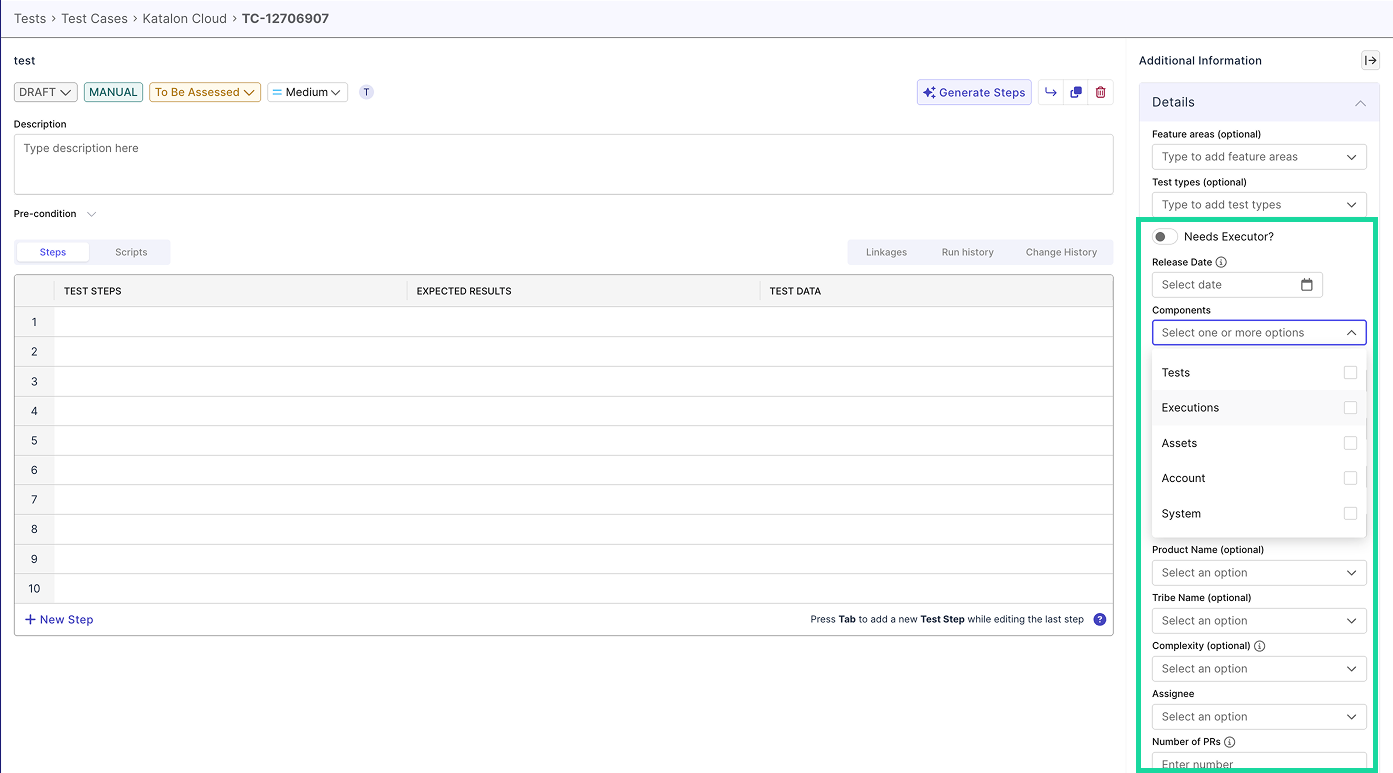
Within Katalon True Platform, you can configure customizable fields and add details to the run in the test result details page. For example:
- Configure an "issue type" fields with values
env-issue,data_issue,... - Configure a
known-flakytag to remind teammates the test used to be flaky in the past
Besides these fields, you can also:
- Update ALM defect ticket or issue tracker
- Share findings via Slack or internal communication channels
- Use AI summary to share findings