Assess test case quality
This document explains how to use Katalon True Platform capabilities to understand how reliable your test cases are, to grade automation quality, and help you shift focus.
Overview
Assessing test quality is crucial for reliable releases: it reveals flaky or brittle tests, uncovers systemic issues, and helps prioritize QA effort to improve automation ROI.
The Test Case Health Analysis report provides a comprehensive view of your test case execution health, across both automated and manual tests. Use this report to monitor test case performance, identify problematic tests, and assess automation effectiveness through pass rate analysis.
Steps to assess test quality
In Katalon True Platform, you can access the Test Case Health Analysis Report through multiple routes:
-
Via the Release Health Dashboard: the Test Case Distribution By Execution Status widget can be expanded to navigate to the Test Case Health Analysis report.
-
Via Analytics > Reports > Test Case Health Analysis report.
Once you've accessed the report, follow these steps to analyze defect trends.
Step 1: Select the scope you want to assess
Choose the sprint release or time duration you want to evaluate, or a custom date range.
You can also refine the report further using these filters:
- Test Case Type: automated, manual, or both. This comparison helps you determine whether issues are isolated to automation only, or reflect broader product quality problems.
- Latest Status: passed, failed, error, skipped
- Custom filters: filter by custom fields (build ID, …). to help uncover more meaningful trends. See ... to learn more about custom fields.
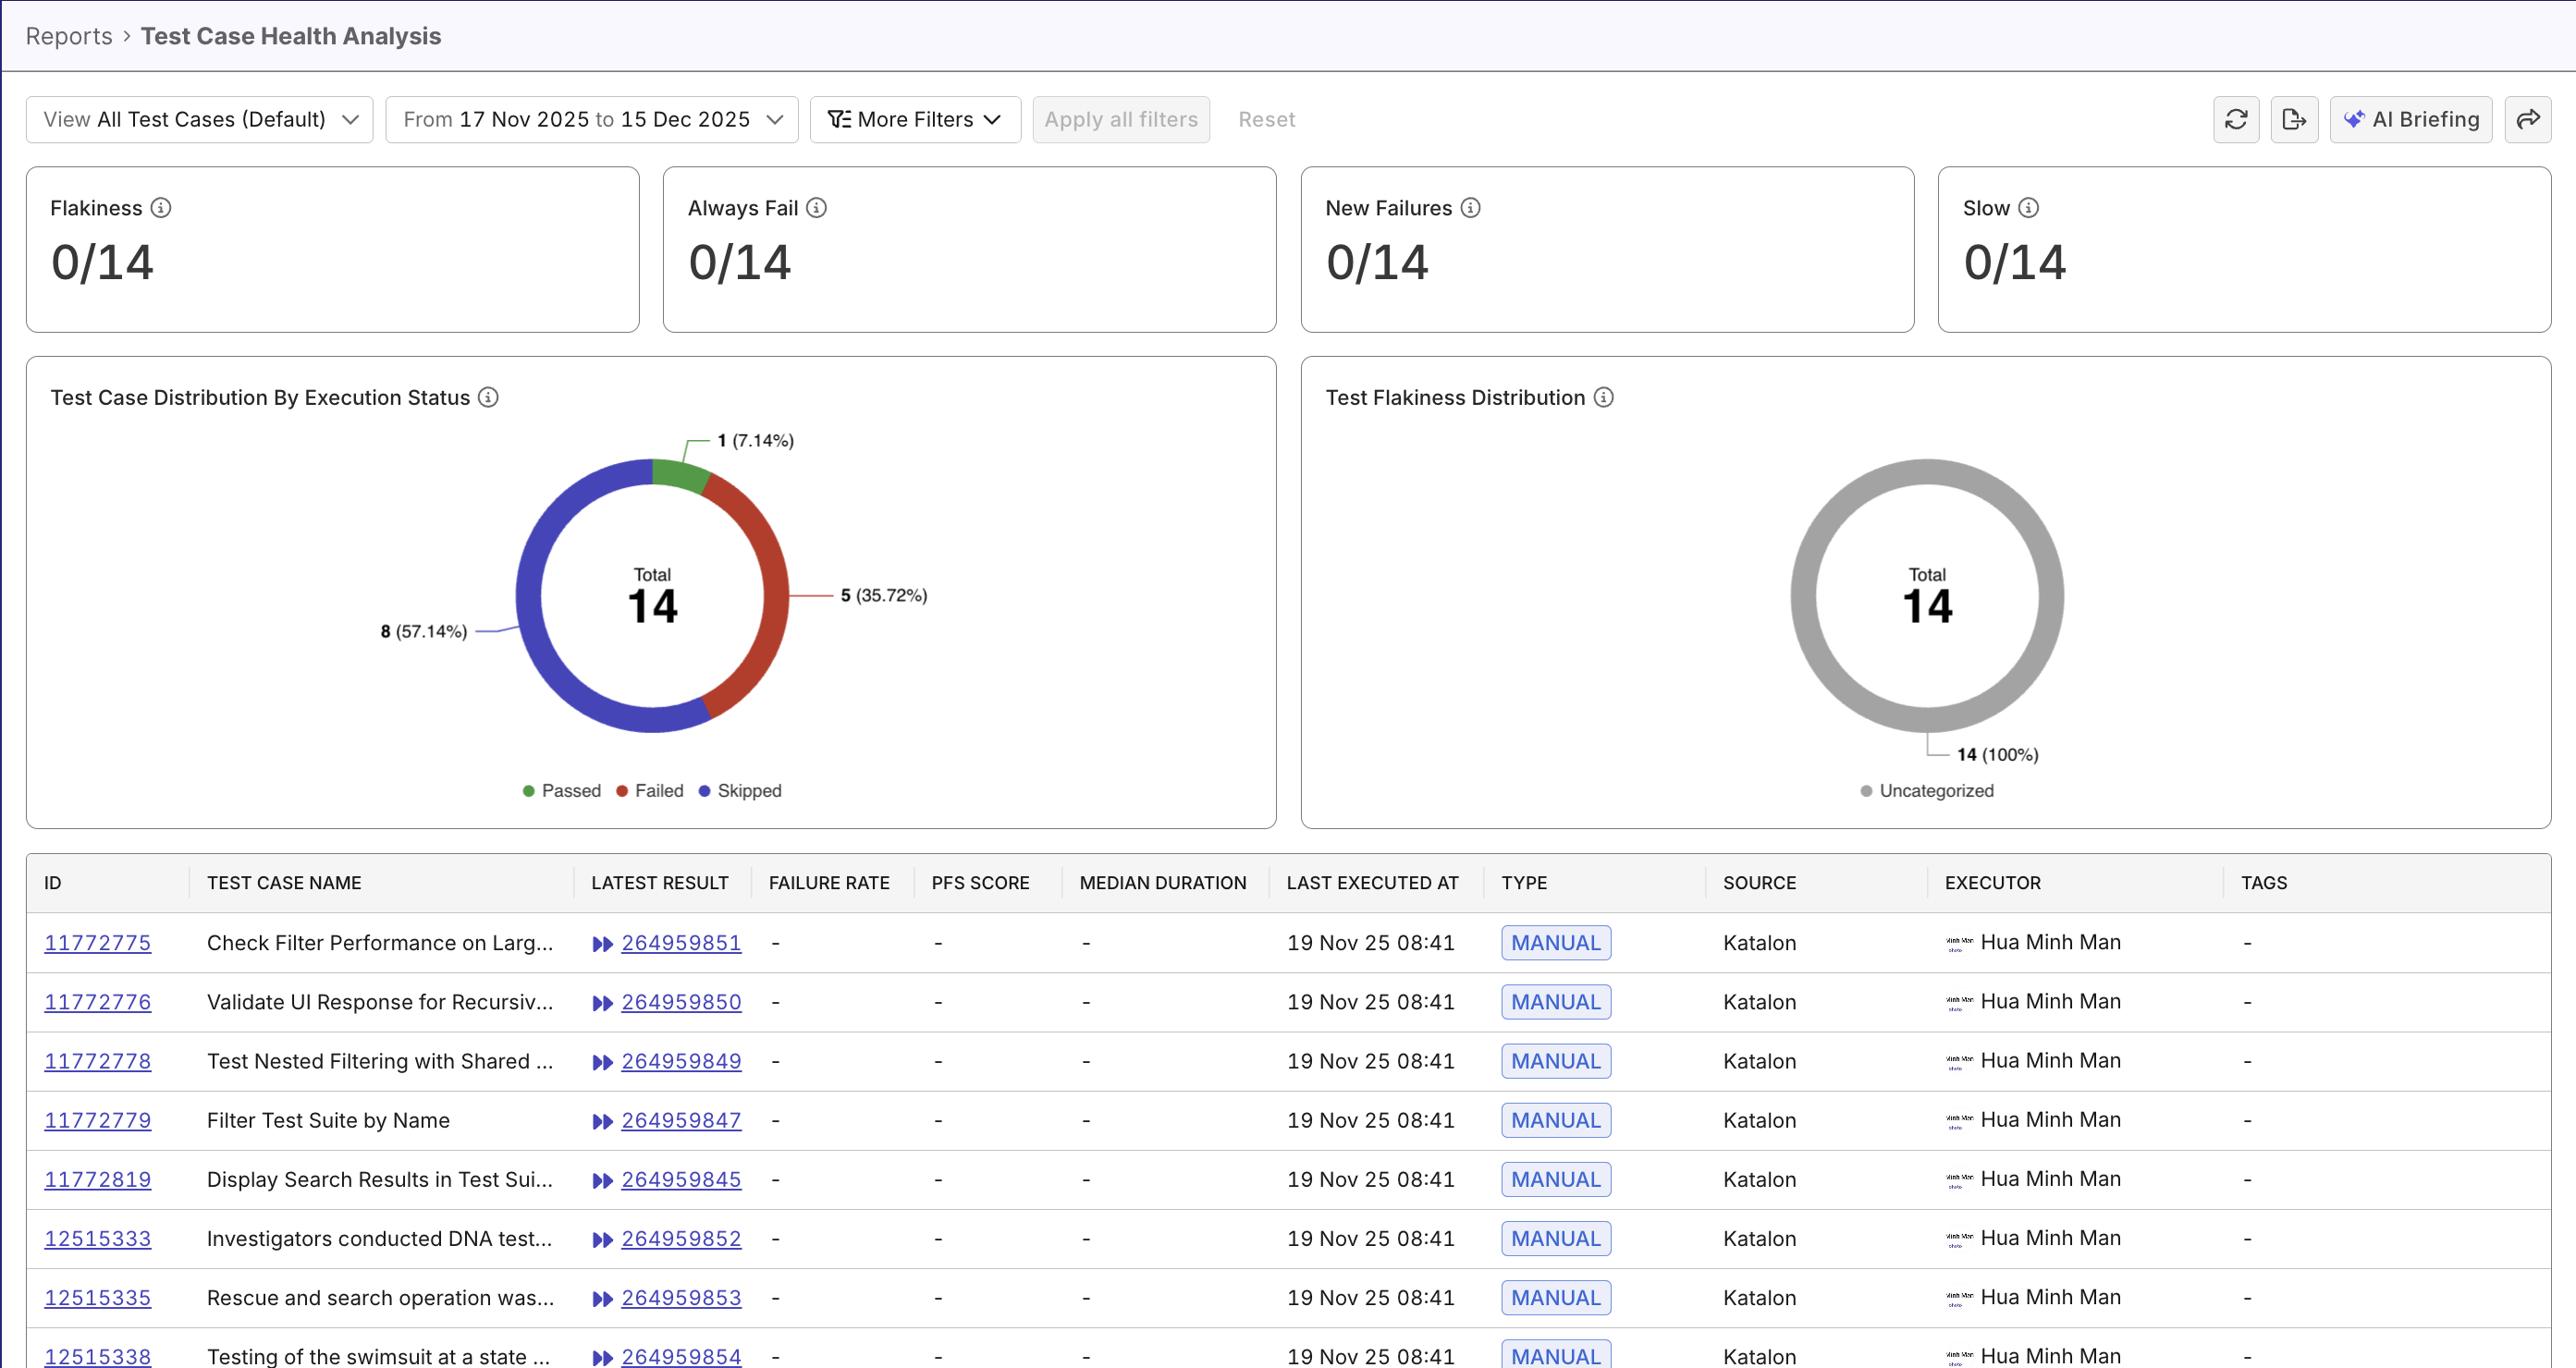
Step 2: Assess overall health
At the top of the report, big-number widgets show counts of executed tests flagged with smart tags. These numbers allow you to understand quickly whether your project is of great health.

The Test Case Distribution by Execution Status widget breaks down all executed tests into four categories: Passed, Failed, Error, and Skipped. A generally healthy project may look like:
- Consistently high pass rate
Failed,Error, andSkippedrates stay within healthy thresholds- No major concentration of
flakytests appears - Both automation and manual results show stable performance

The Test Flakiness Distribution widget breaks down flaky tests by various degrees (Stable, Potentially Flaky, Flaky, Highly Flaky). If the test status breakdown looks good but the rate of flaky tests is concerning, it calls for further investigation.
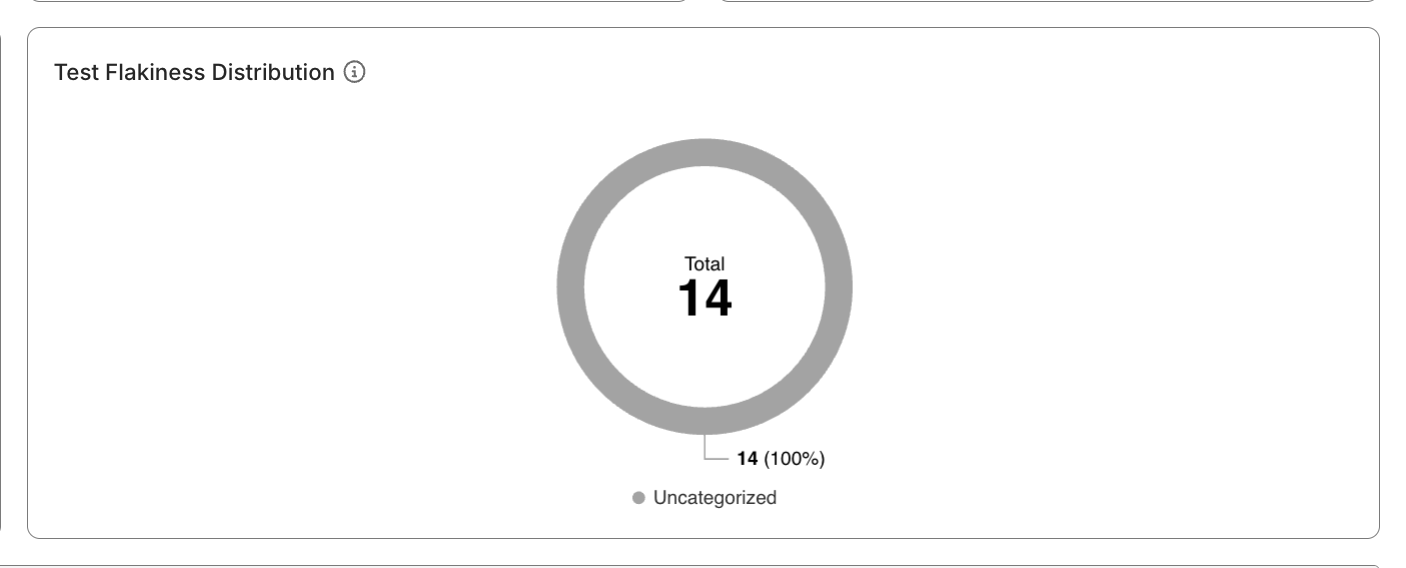
To understand how Katalon True Platform calculates PFS to measure flakiness, see Probabilistic Flakiness Score.
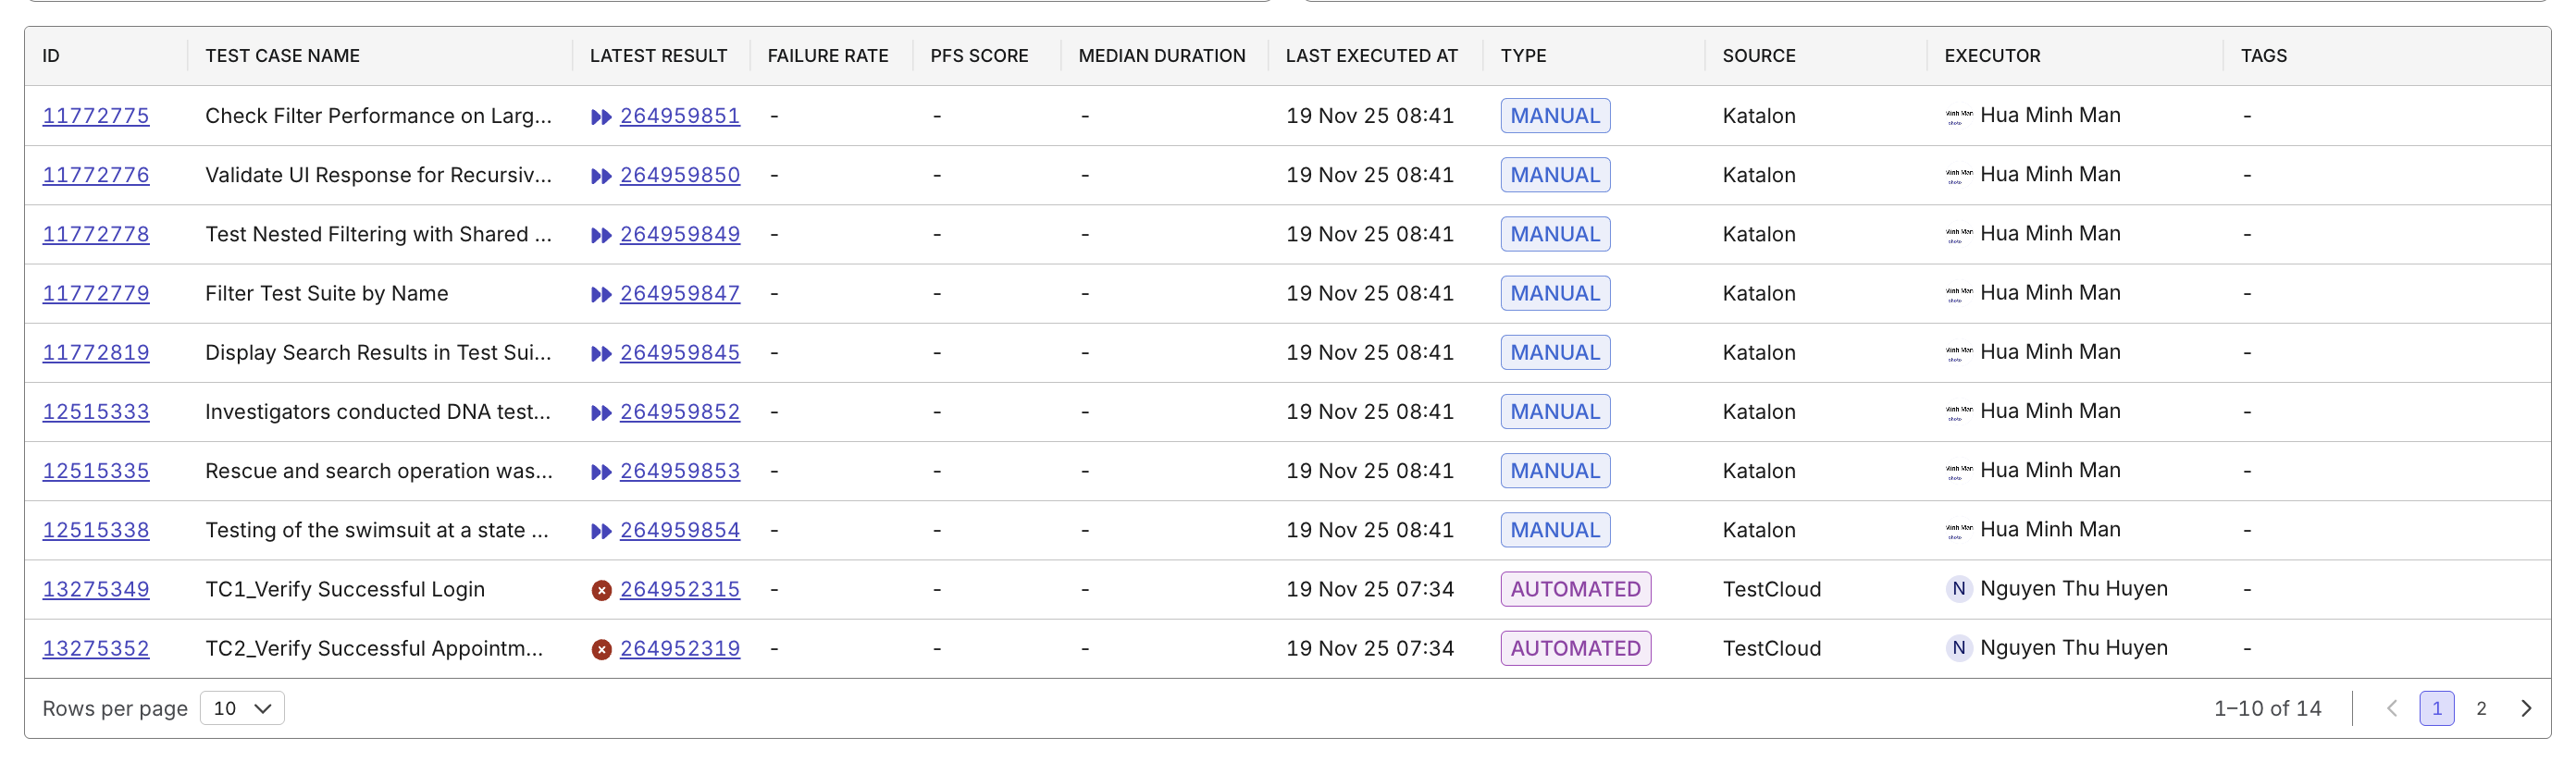
Step 3: Investigate further
Use the data table to move from project-level assessment to test-level diagnosis:
- Identify which specific tests contribute to unhealthy trends (long median duration, high PFS, high failed rate, with smart tags…)
- Open a test case’s details/its latest execution result to investigate failures or investigate flaky tests.
- Apply filters by results/quality tags to further narrow down data.
To have a quick pointer on next steps, try asking Katalon AI Assistant which unhealthy tests should be addressed first.