Track testing productivity
This document explains how to track test case creation productivity using the Test Case Publishing Activity Report.
Overview
Tracking test case publishing progress means monitoring how draft test cases move through review to publication over time. It shows the team’s velocity in meeting requirements and reveals whether work is flowing smoothly from creation to completion.
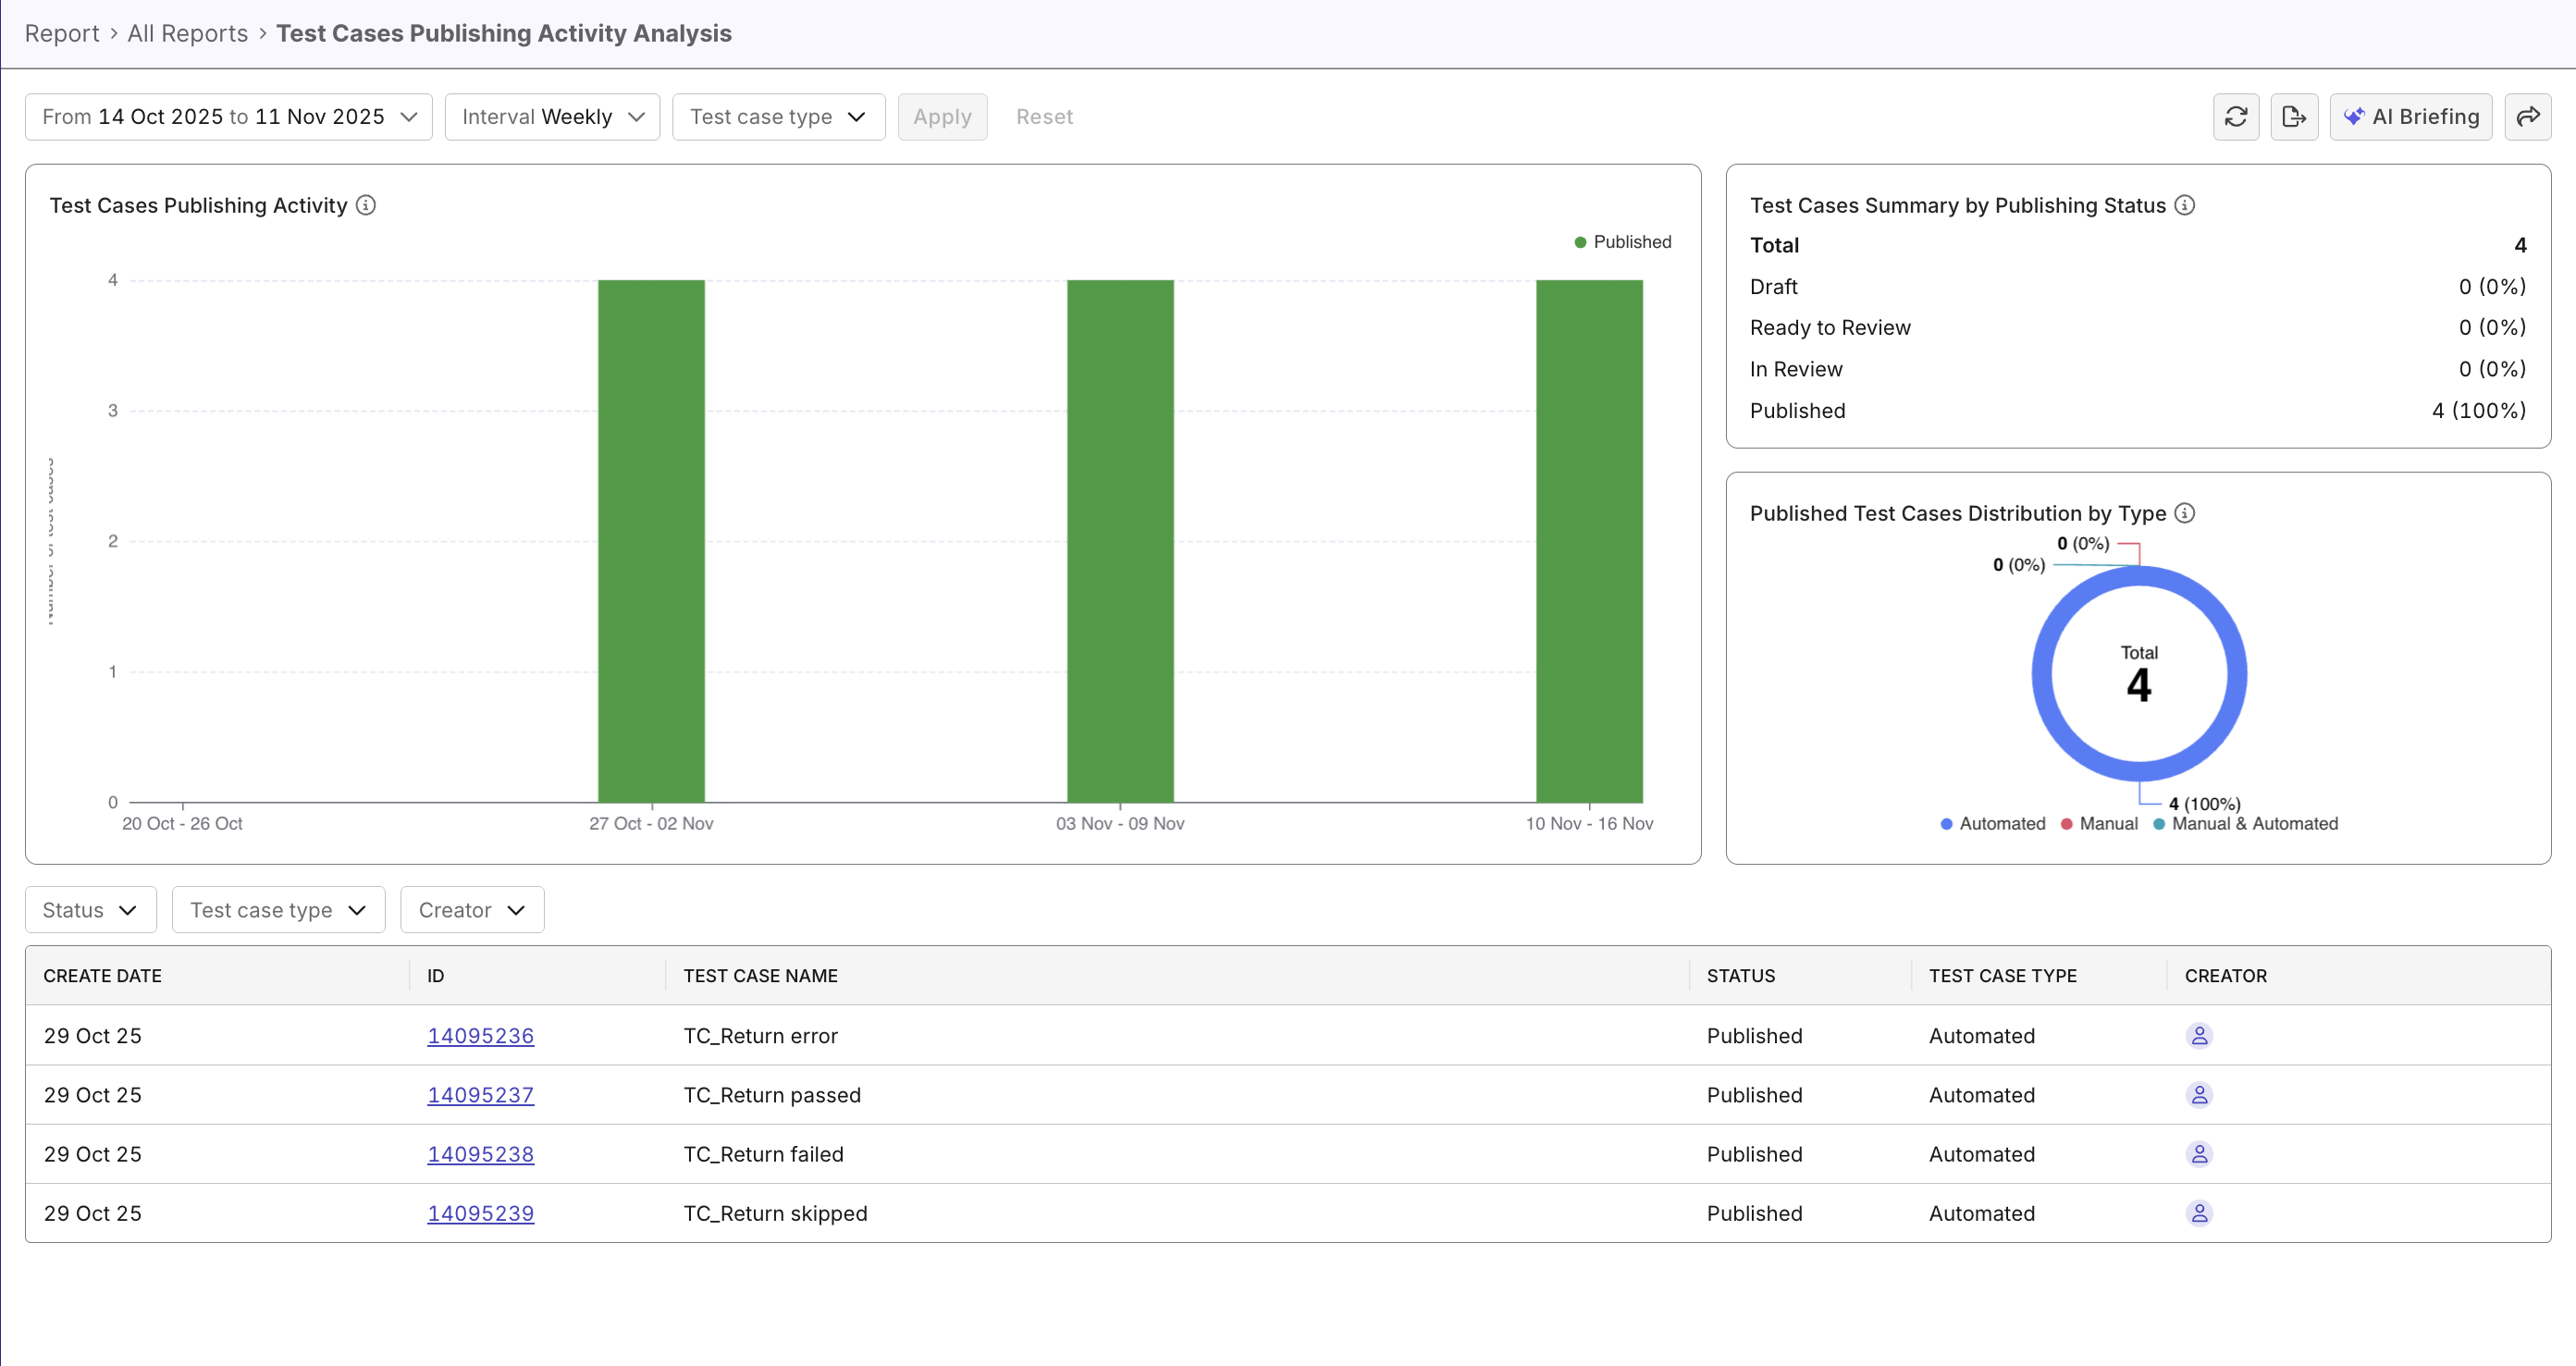
The Test Case Publishing Activity Report in Katalon True Platform helps by visualizing trends across statuses (Draft, Ready to review, In Review, Published), highlighting bottlenecks, and enabling filters to gain underlying insights. The report surfaces where work stalls, quantifies throughput, and supports planning for upcoming sprints and releases.
Steps to track testing productivity
In Katalon True Platform, you can access the Test Cases Publishing Activity Report through multiple routes:
-
Via the Analytics & Trends Dashboard: the Test Cases Publishing Activity widget can be expanded to navigate to the Test Case Publishing Activity Report.
-
Analytics > Reports > Test Case Publishing Activity Report.
Once you've accessed the report, follow these steps. to track testing productivity.
Step 1: Select data scope and filters
Select a date range or release/sprint and interval to view the activity trend at your desired granularity.
Example configurations:
- Assess sprint overall velocity - to track daily test creation rate: current sprint range, daily interval.
- Assess automation capacity - to measure automation weekly throughput: last 4 weeks, weekly interval, automated test type only.
Step 2: View and interpret data
This report excludes autonomous test cases generated by TrueTest, and INACTIVE test cases.
The bar chart showing test case counts by status over time (Draft, Ready to review, In Review, Published). Hover to see count breakdowns to understand test case publication progress.
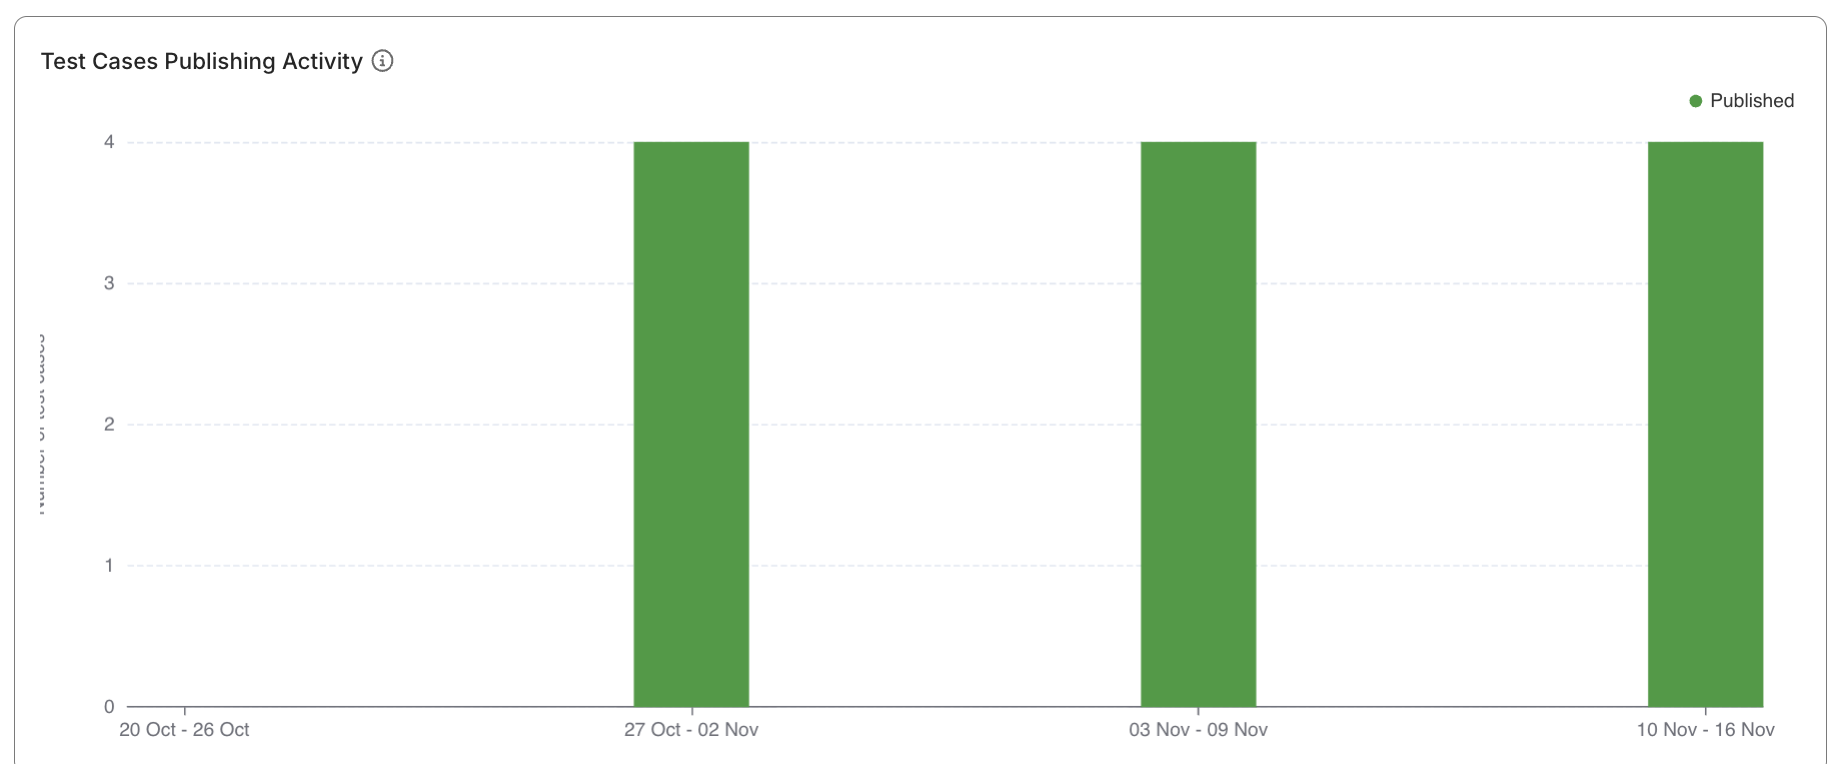
A quick guide to interpret bar chart patterns:
| Pattern | What it suggests | Recommended action |
|---|---|---|
| Consistently balanced distribution across statuses + Increasing bar heights | Steady work, no obvious bottlenecks. | Continue monitoring to ensure the workflow remains stable. |
High Draft + Increasing bar heights | Active test case creating, healthy velocity, but many are unfinished. | Ensure testers have enough time or guidance to finalize cases for review. |
High Draft + Stable bar heights | New test cases not progressing to review. | Investigate blockers such as unclear requirements, workload imbalance, or lack of review readiness. |
High Ready to Review + Increasing bar heights | Piling test cases. | Assign more reviewers or schedule regular review sessions. |
High In Review + Stable bar heights | Reviews taking too long to complete, slowing the publishing pipeline. | Streamline review processes or reduce review workload per reviewer. |
High Published + Increasing bar heights | Consistent progress: test cases are progressing towards completion. | Maintain current practices and monitor sustainability. |
High Published + Stable bar heights | Stagnation: existing work is completed, but few new test cases are being created. | Check requirements, test planning, or backlog readiness. |
| Decreasing bar height overall | Slow activity: reduced workload, shifting priorities, or capacity constraints. | Verify team allocation and project timelines. |
Ask Katalon AI Assistant to analyze existing patterns, or provide a summary of workflow bottlenecks or review-stage slowdowns as pointers.
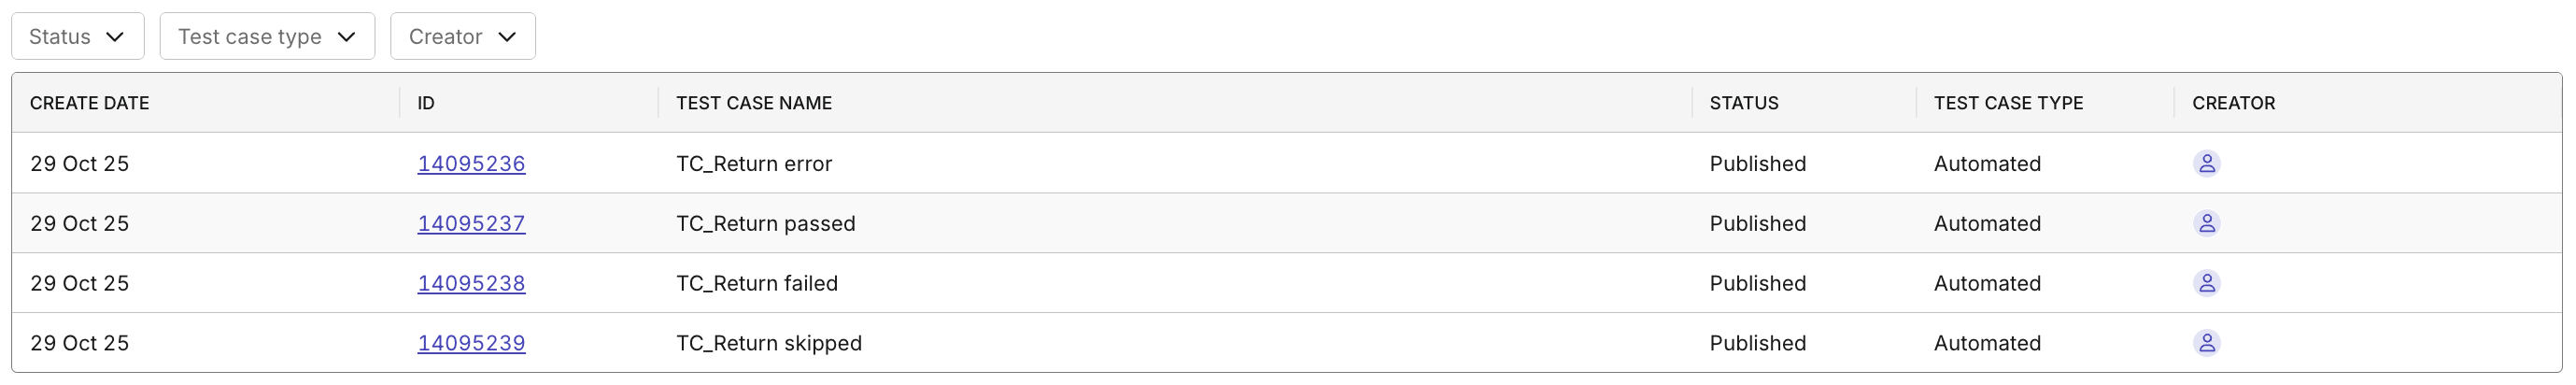
Step 3: View test cases in the data table
Inspect the data table to see the breakdown of all test cases — sortable and filterable by status, type, author, and created date. You can also interact with the chart to view data by a particular day/week/month and automation status.
Common use cases:
- Sort by date to find newest test cases, then review recent team output.
- Filter by Creator to analyze/compare individual productivity.
- Filter by Draft status to identify bottle necks and take actions.