Analyze defect status
This document explains how to analyze defect status using Katalon True Platform reports and tools.
Overview
Analyzing the current defect status helps teams prioritize fixes and focus effort where it’s most needed. The Defect Status Analysis Report provides an interactive summary of defect counts by severity, priority, and resolution state, making it quick and easy to filter, drill down, and assign issues for triage.
Steps to analyze defects status
In Katalon True Platform, you can access the Defect Status Analysis Report through multiple routes:
-
Via Live Monitor Dashboard: the unresolved defect distribution widgets can be expanded to navigate to the Defect Status Analysis Report.
-
Via Analytics > Reports > Defect Status Analysis Report.
Once you've accessed the report, follow these steps to analyze defect status.
Step 1: Configure data scope and filters
- Choose the analysis scope: Time Range, Release, or Sprint depending on what you want to investigate.
- Use the Resolution State filter (default: Unresolved) to focus on open issues. Start with Unresolved to focus your triage. Switch to Resolved for historical root-cause analysis.
- Open More Filters to refine by Severity, Priority, Assignee. Combine Severity and Priority filters to find high-impact work items (e.g., Critical & Priority 1).
Defect priority/severity are Katalon True Platform's native terms, not your ALM tool's. Configure mapping between the terms when configuring your ALM tools.
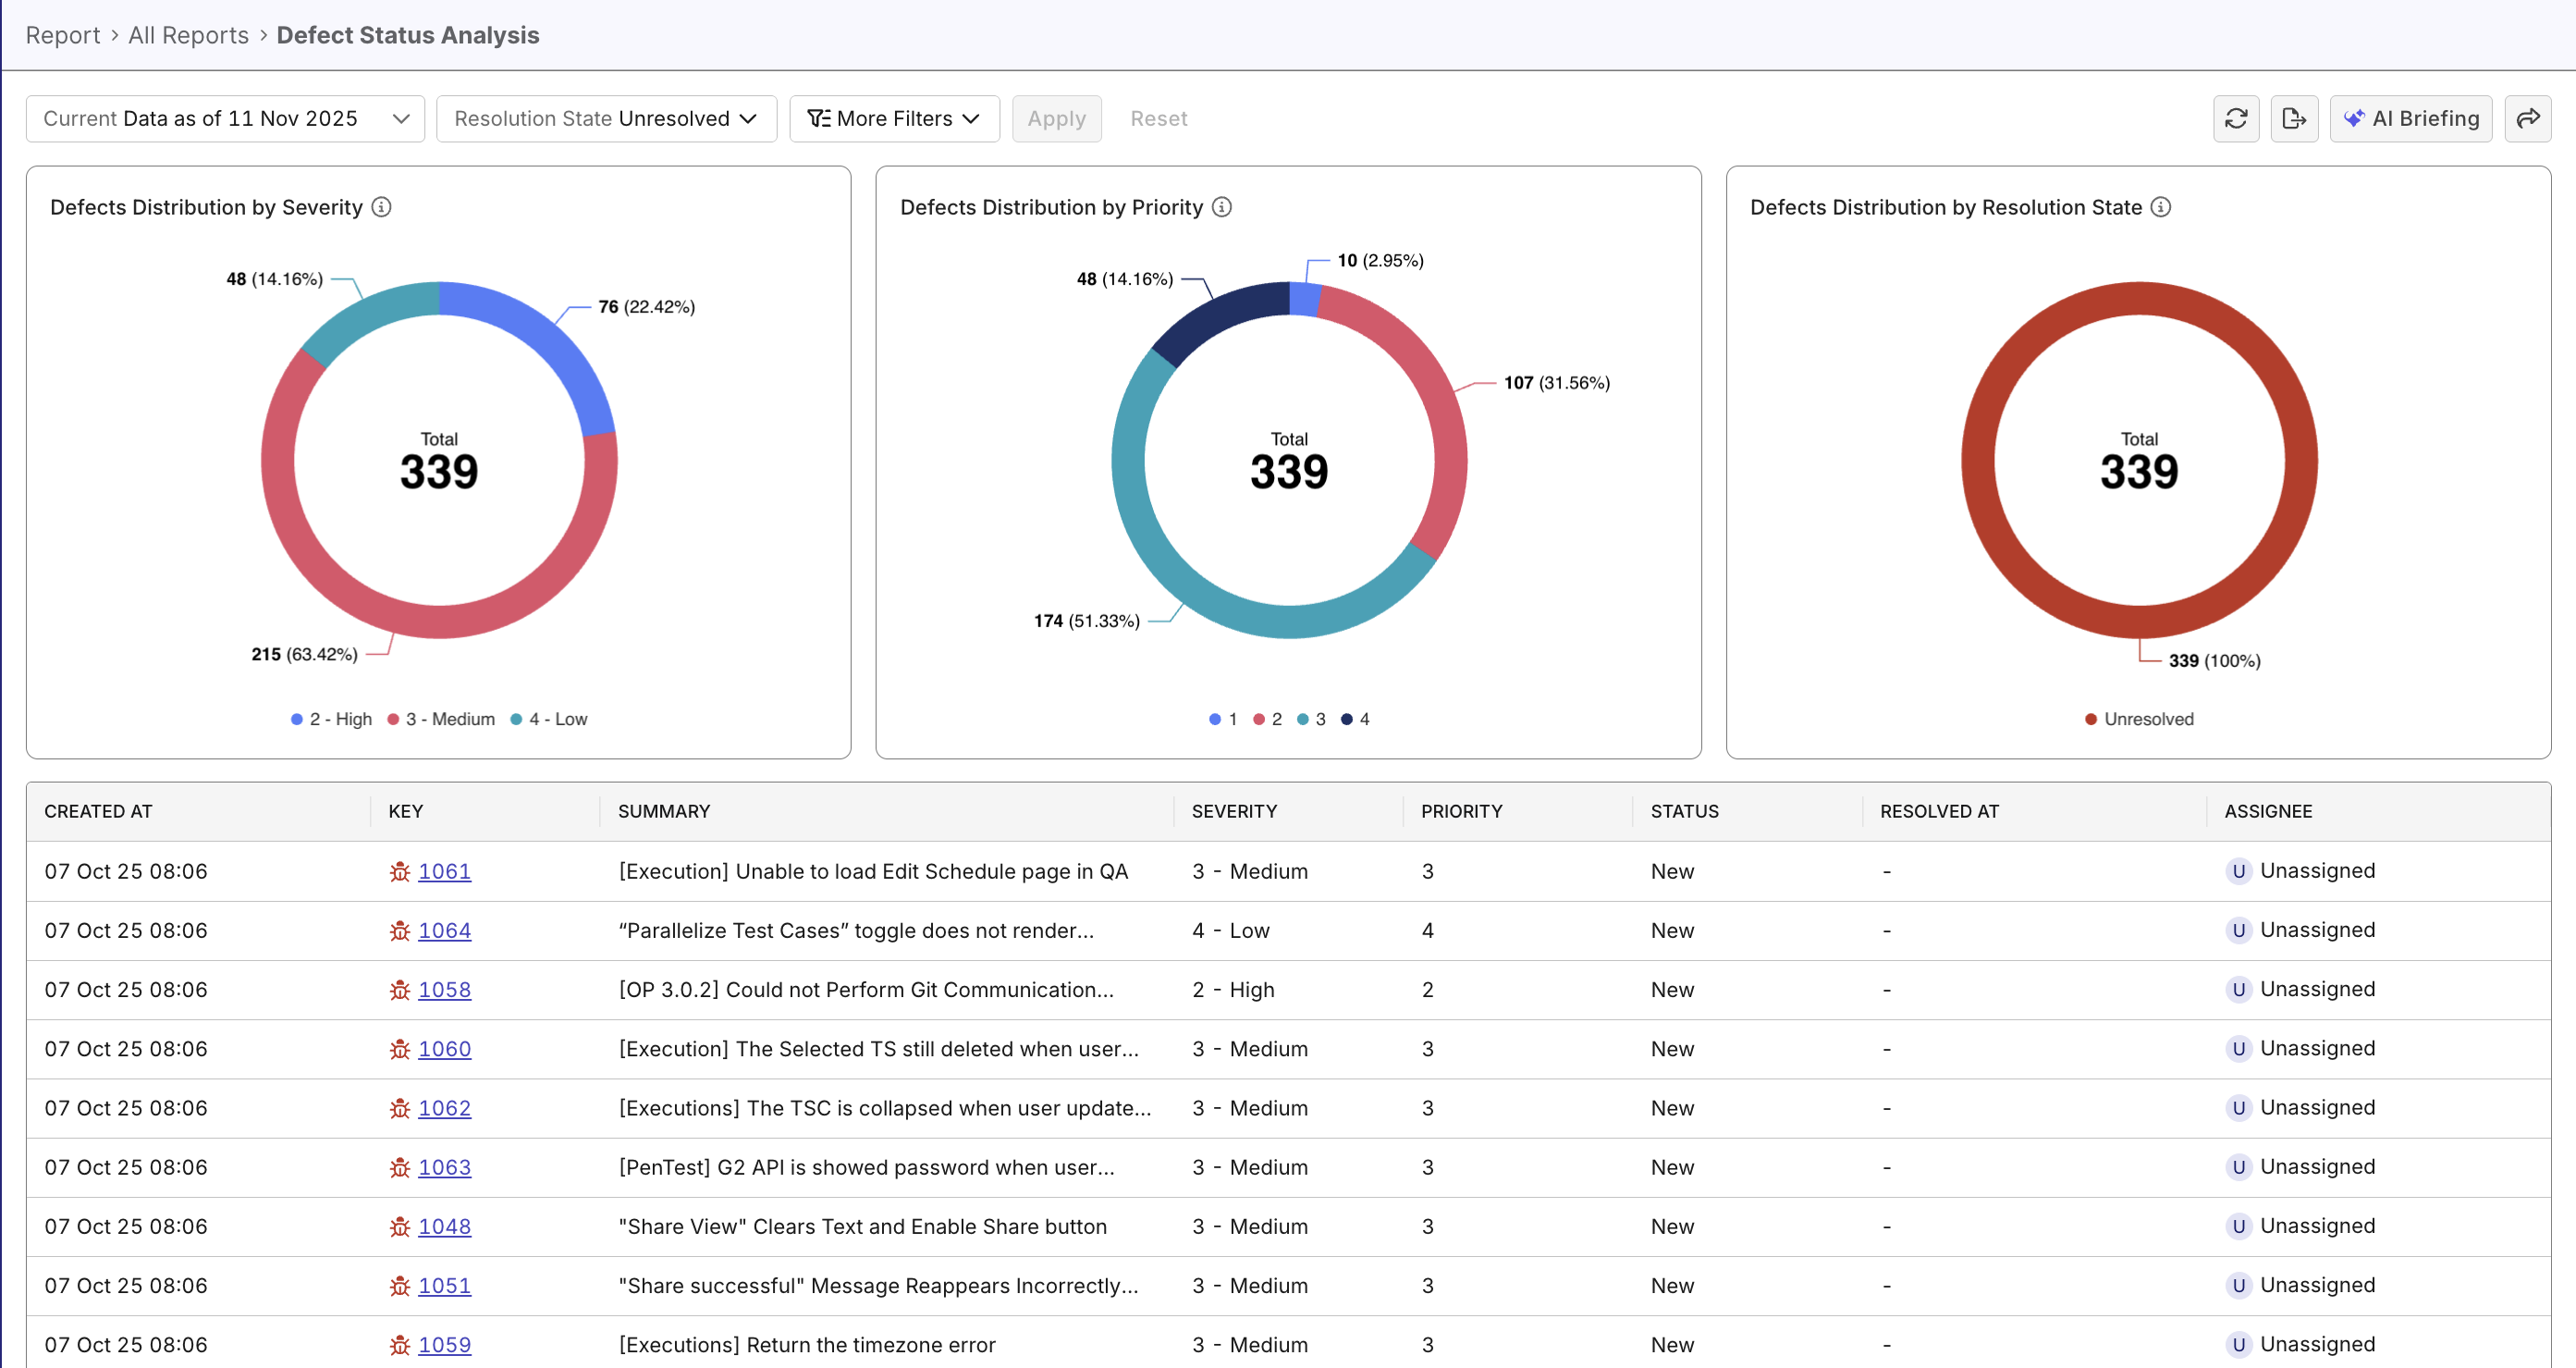
Step 2: Analyze visuals and drill down for insights
- Visuals: Three donut charts show breakdowns by Severity, Priority, and Resolution State. Hover to view counts and percentages.
- Drill down: Click any chart segment (for example, High priority or Resolved) to filter the Defect Details Table below.
- Table: Use the table to inspect individual defects (Created At, Key, Summary, Severity, Priority, Status, Resolved At, Assignee). Click the defect key to open the defect in your integrated ALM.
- First try Katalon AI Assistant for quick pointers (e.g. Which defects need attention the most?)
- Use the defect table to capture test coverage gaps or recurring failures; if many similar defects appear, consider a deeper code review or adding regression tests.
- Make the report part of your sprint rituals: mid-sprint check-ins and retrospectives help catch trends early.
Step 3: Take action
- Prioritize defects: Use the filtered view to identify high-priority defects that need immediate attention.
- Communicate: Share a filtered snapshot (export or dashboard link) with stakeholders — dev leads, product managers, and QA — to align on remediation.
- Track: Assign defects to owners and track progress using the table and filters.
- Plan corrective work: If defects accumulate across a release or sprint, schedule focused bug-fix work or a stabilization sprint.