Analyze defect trends
This document explains how to use Katalon True Platform capabilities to view defect trends over a specific period.
Overview
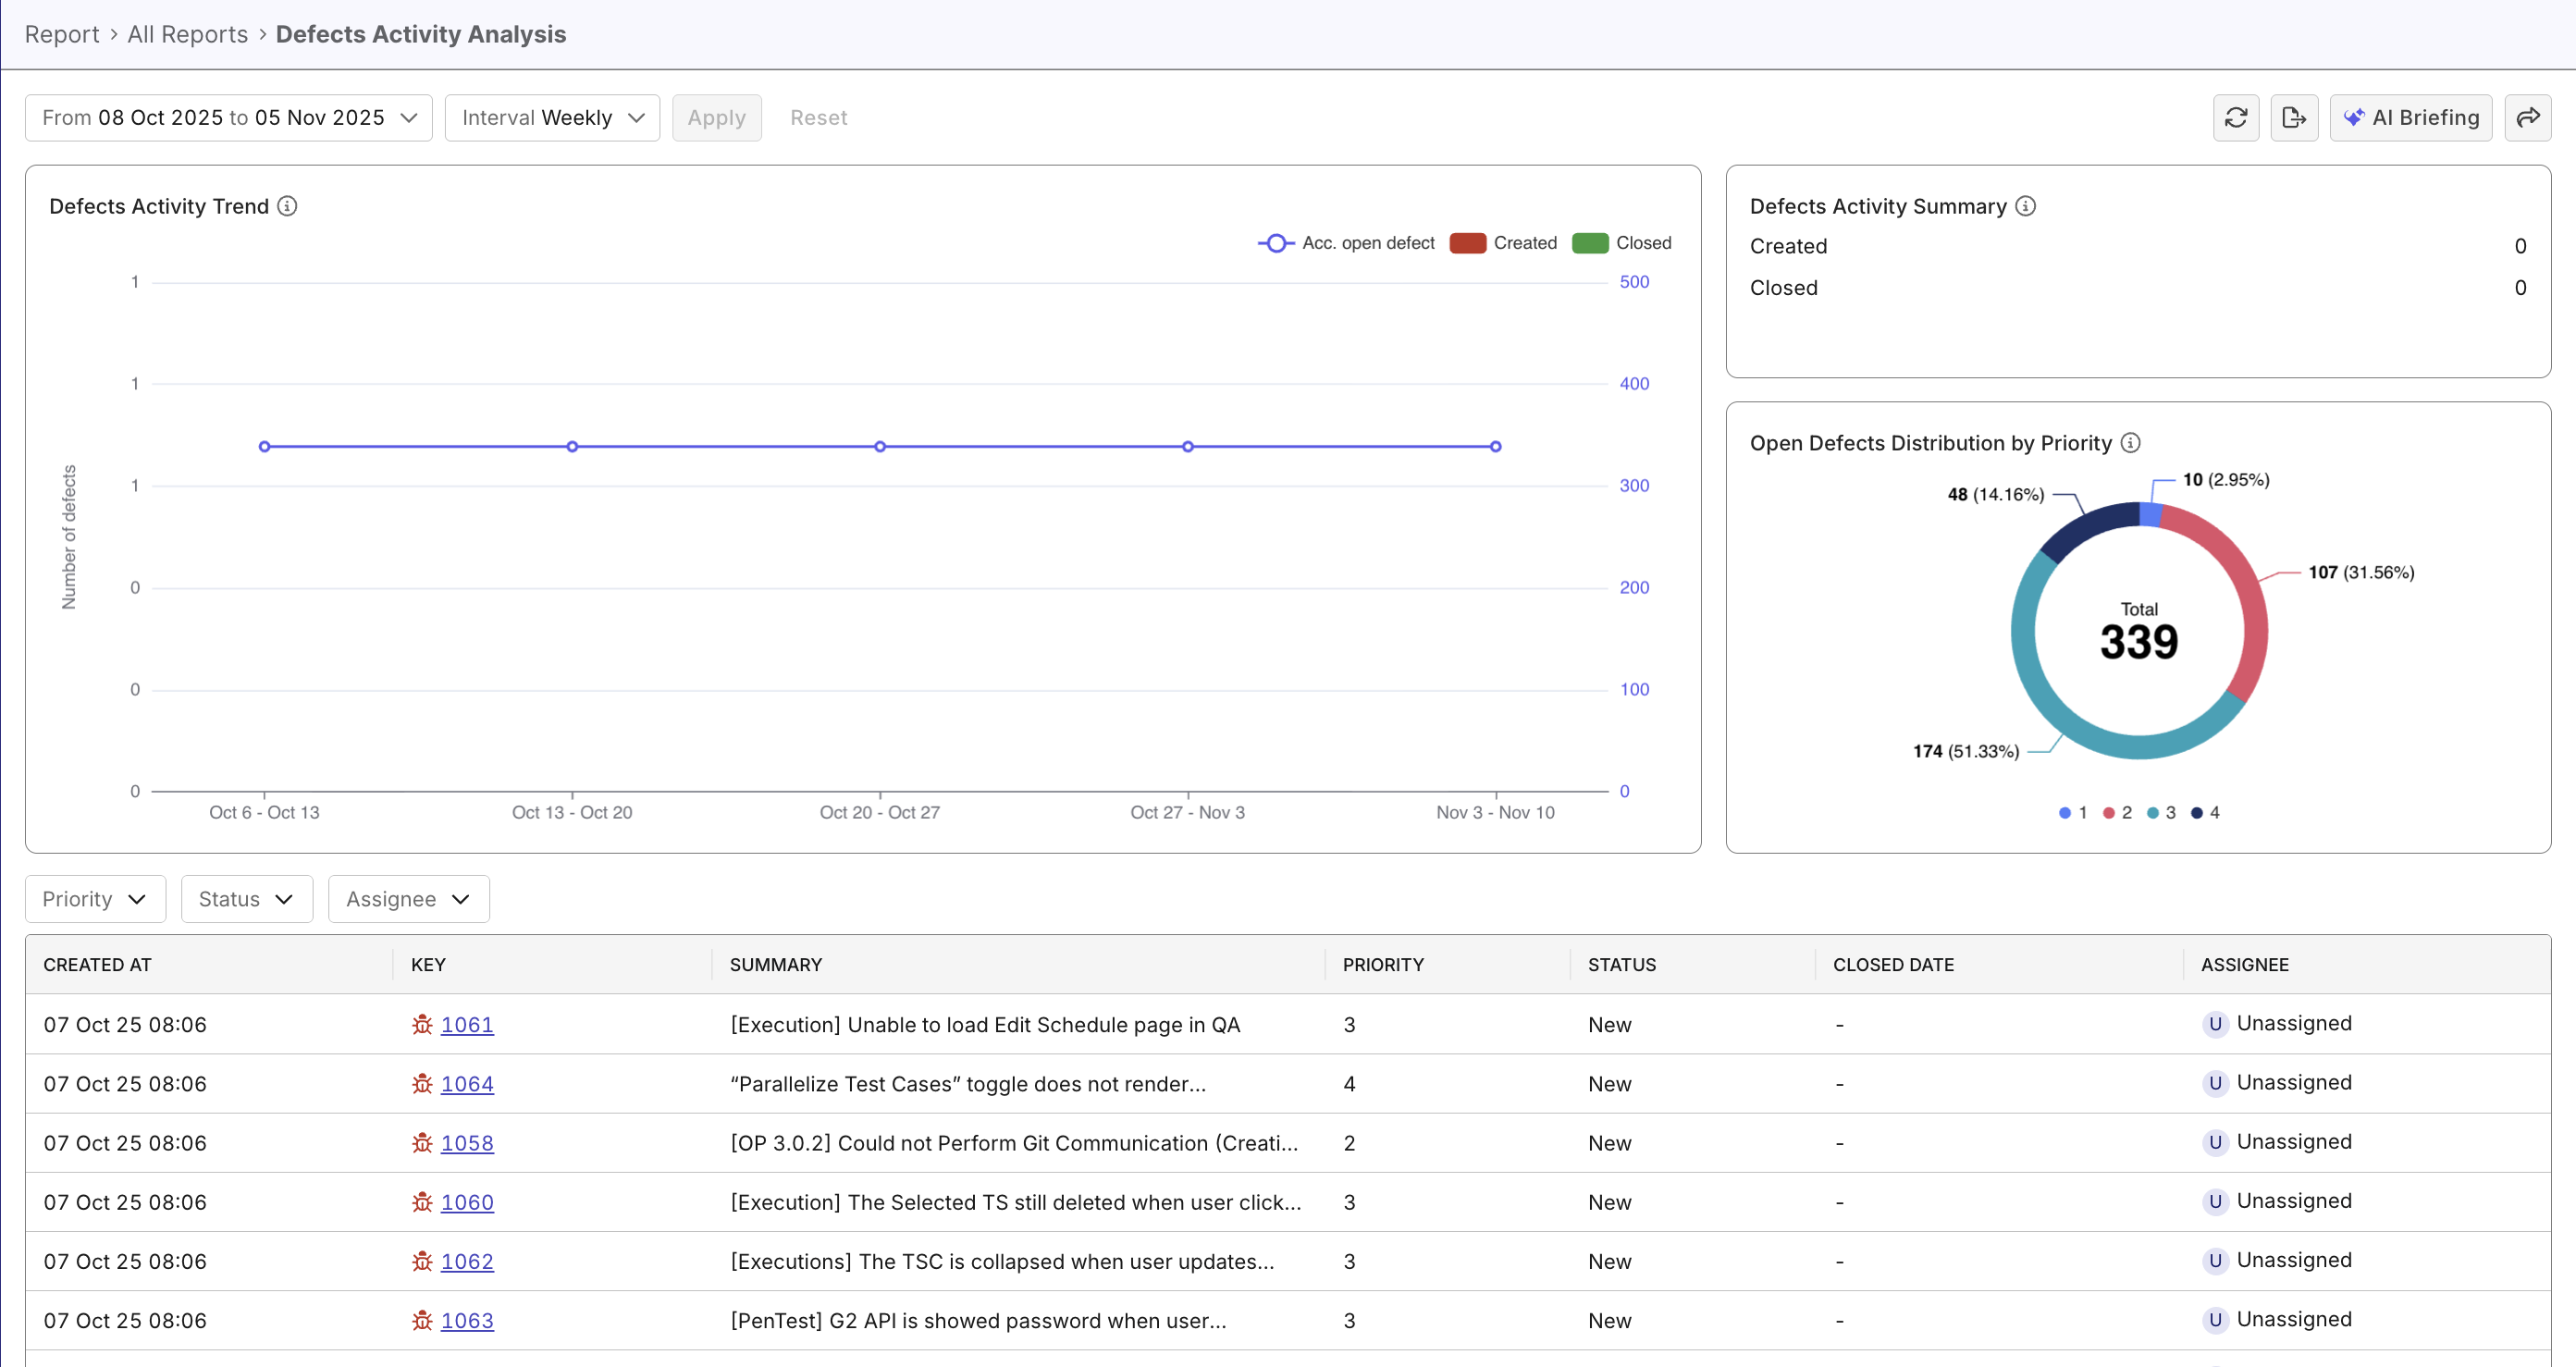
Viewing and analyzing defects trend helps you identify patterns in how defects are created, resolved, and accumulated over time. Analyzing these trends helps spot quality degradation early and provides additional insight to release health. In Katalon True Platform, this could be done with the Defects Activity Analysis Report.
Steps to view defect trends
In Katalon True Platform, you can access the Defects Activity Analysis Report through multiple routes:
-
Via the Analytics & Trends Dashboard: the Defect Activity Trend widget can be expanded to navigate to the Defects Activity Analysis Report.
-
Via Analytics > Reports > Defects Activity Analysis Report.
Once you've accessed the report, follow these steps to analyze defect trends.
Step 1: Configure data scope
- Set data scope and intervals:
- Quarterly analysis: 3 months, weekly interval
- Annual analysis: 12 months, monthly interval
- Sprint analysis: sprint, daily interval
- Release analysis: release, weekly or daily interval
Step 2: Analyze defects trend for insights
Defect priority/severity are Katalon True Platform's native terms, not your ALM tool's. Configure mapping between the terms when configuring your ALM tools.
Common scenarios to look out for:
| Scenario | Meaning |
|---|---|
| - Consistently high green bars - Consistently low red bars at an acceptable threshold Trend line is flat or declining | Defects resolved at a healthy pace, team is keeping up with issues, no strong sign of quality degradation or risks |
| - High green bars for highly severe defects and medium red bars for medium/low severity defects | Team is effectively handling defects at this importance level |
| - Consistently high red-to-green bar ratios - Trend line gradually rising | Incoming quality issues are outpacing resolution, team capacity may be insufficient or bug fixes are taking too long. |
| - Abnormal spike in red bars without rise in green bars - Trend line spike same day/week | Potential bad deployment/feature introduced, or environment issues. |
Ask Katalon AI Assistant to work out abnormal patterns/health risks as pointers, and start your analysis from there.
Step 3: Take action
- Save filters as different views that clearly displays bottlenecks (accumulating defects, unresolved ratio high in severe defects,...)
- Share views to communicate with stakeholders to plan resolution strategies.
- Combine with analyzing defects status to effectively plan resolution strategies.
- Sort defects by dates to prioritize critical defects that take too long to resolve.
- Detect systemic defects (consistently rise at release/sprint start, code merges, or plateau despite team growth) that require process changes, training, or architectural improvements, different from one-off defects.
- When defect trends look manageable, navigate to Release Health dashboard to properly assess release health.