Track automation progress
This document explains how to track test case automation progress throughout a specific period using the Automation Progress Analysis Report
Overview
Measuring automation velocity helps track team's progress towards project goals, and justify investment in test automation.
The Automation Progress Analysis Report provides an overview of your automation status across all test cases, helping QA teams convert rates, identify pending work, and evaluate trends over time.
Steps to track automation progress
In Katalon True Platform, you can access the Automation Progress Analysis Report through multiple routes:
-
Via the Live Monitor Dashboard: the Top 10 Published Automated Tests by Assignee widget can be expanded to navigate to the Automation Progress Analysis Report.
-
Via Analytics > Reports > Automation Progress Analysis Report.
Once you've accessed the report, follow these steps to track automation progress.
Step 1: Configure automation goals
Before analyzing automation progress, set up automation goals to track whether your team is meeting automation targets as your project grows. See Configure readiness criteria for more details.
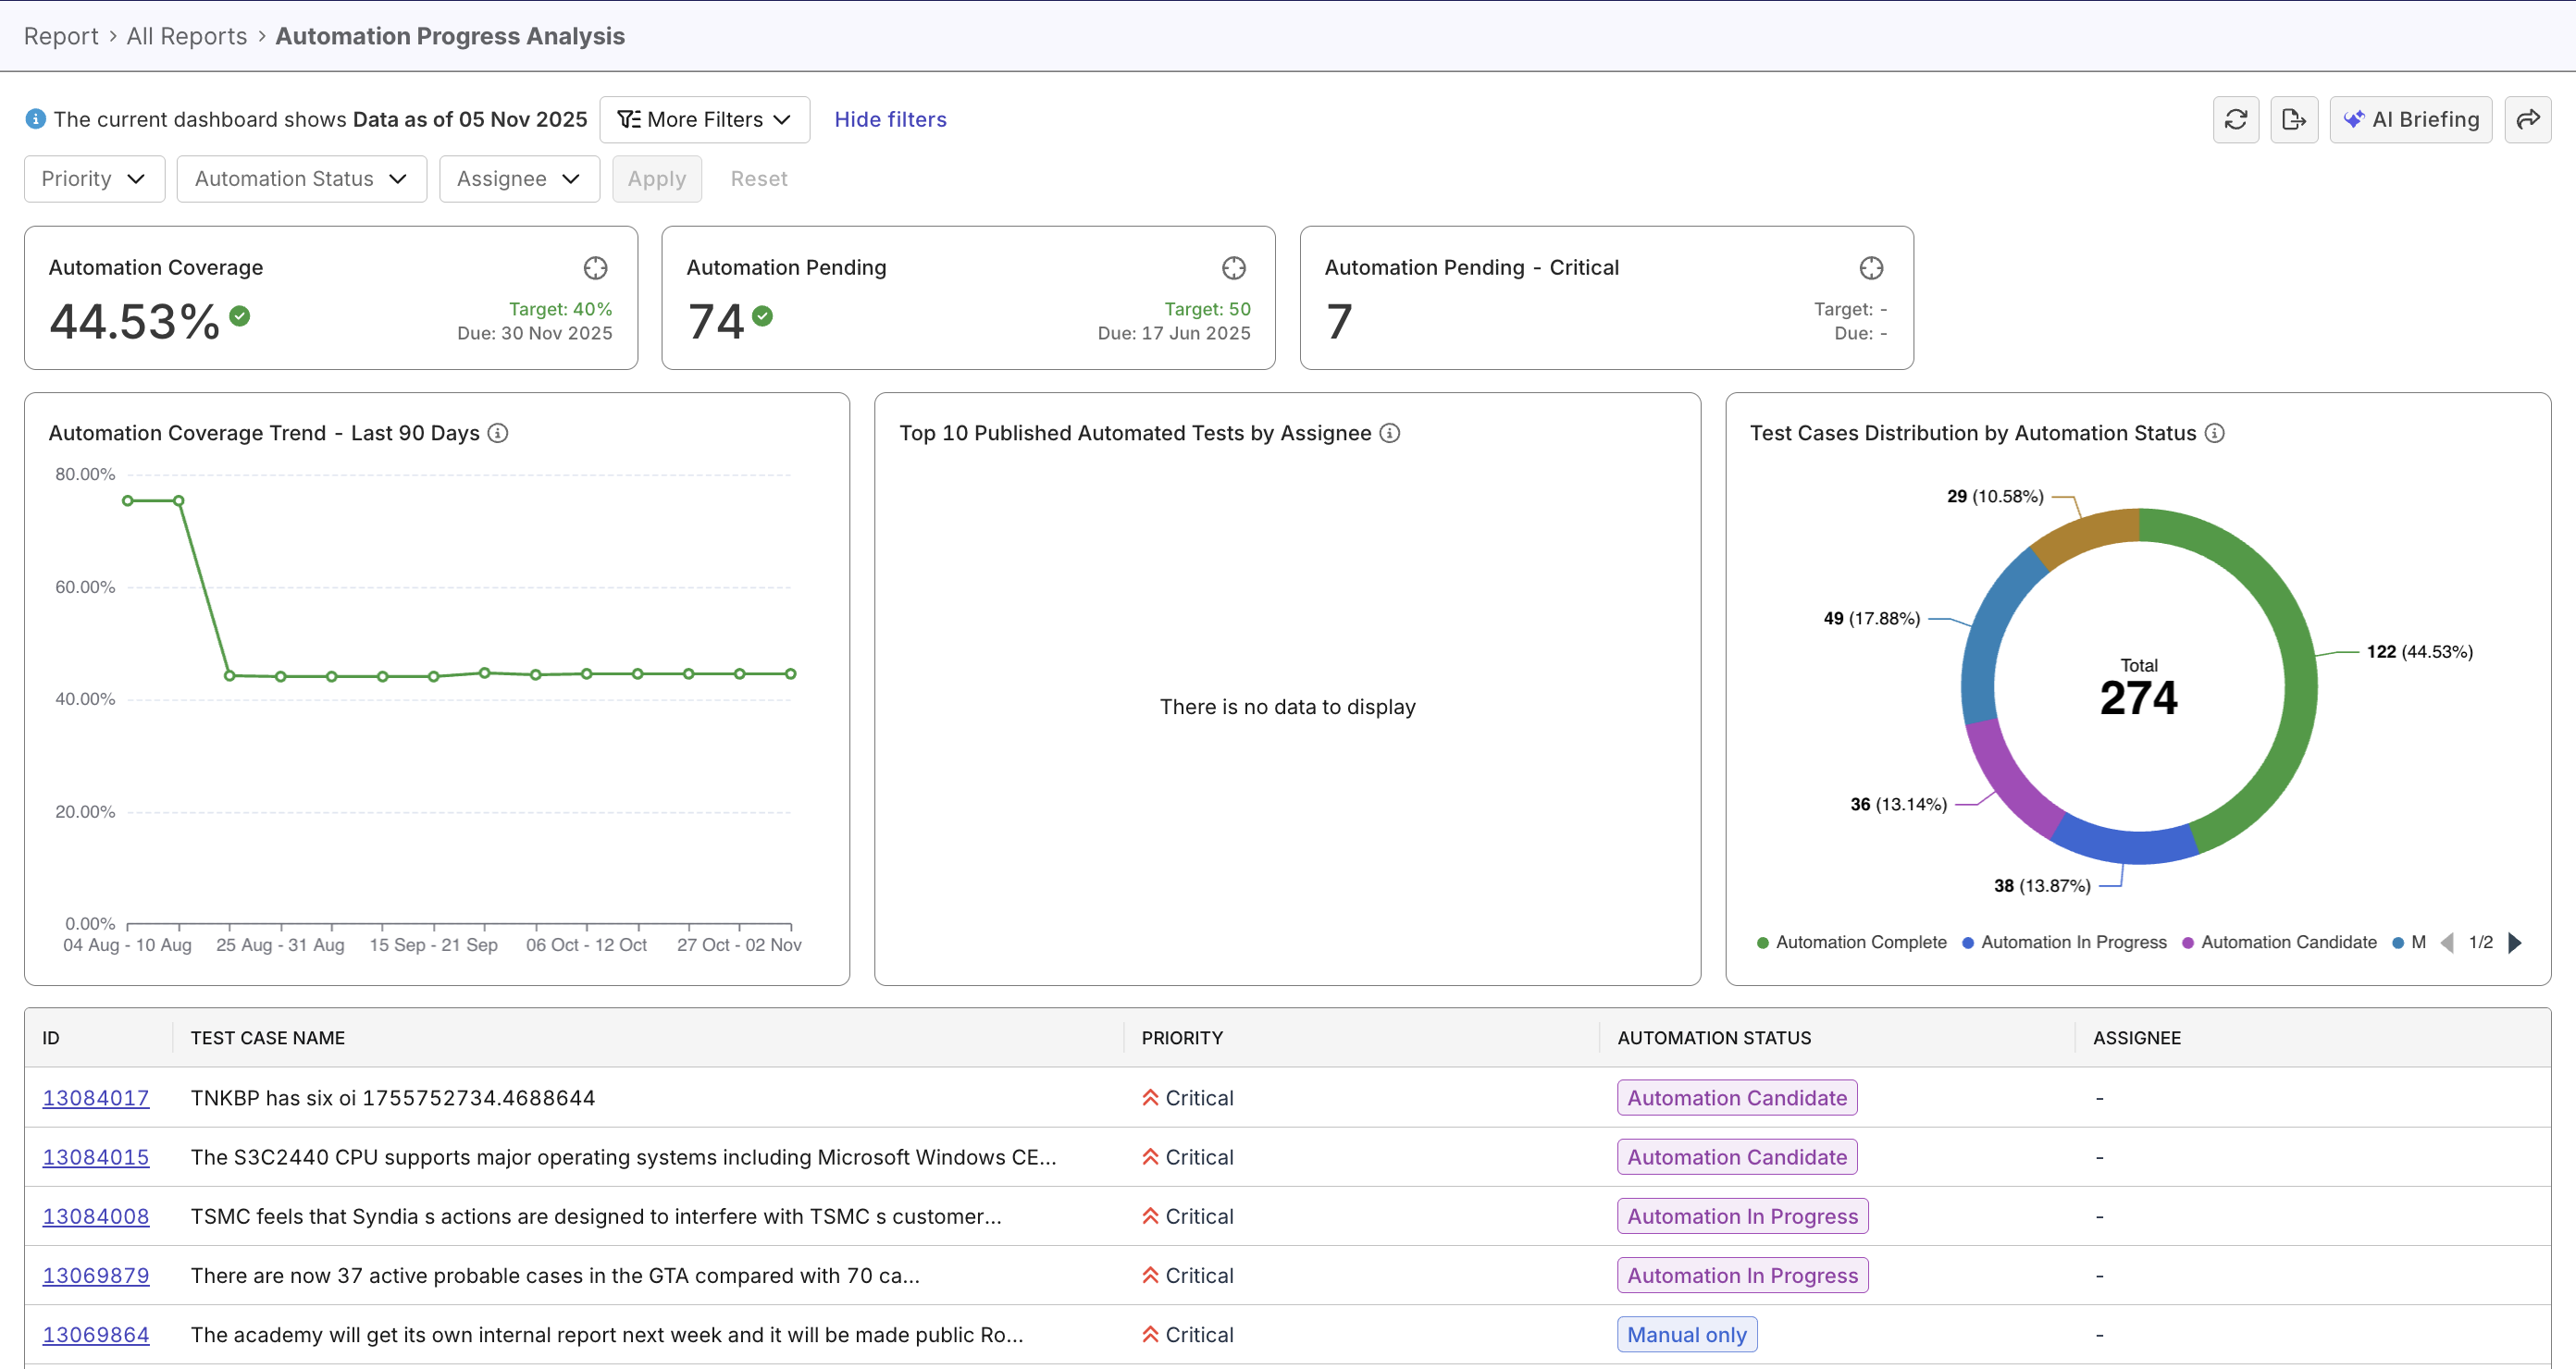
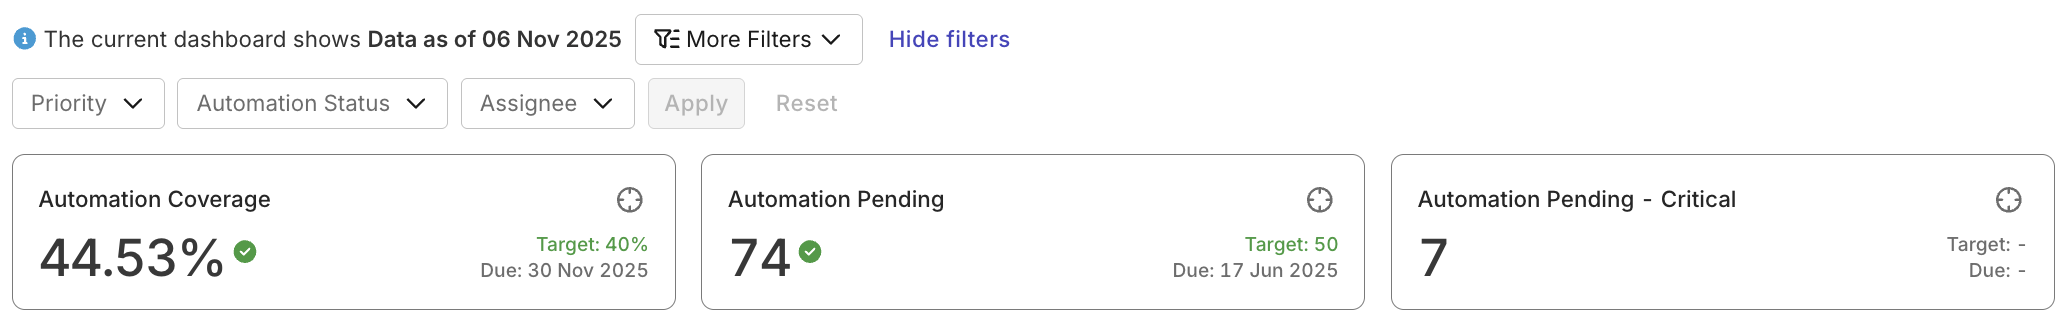
Once configured, you could quickly see if your project is on track, via the summary metrics at the top.
Step 2: Apply filters and analyze data
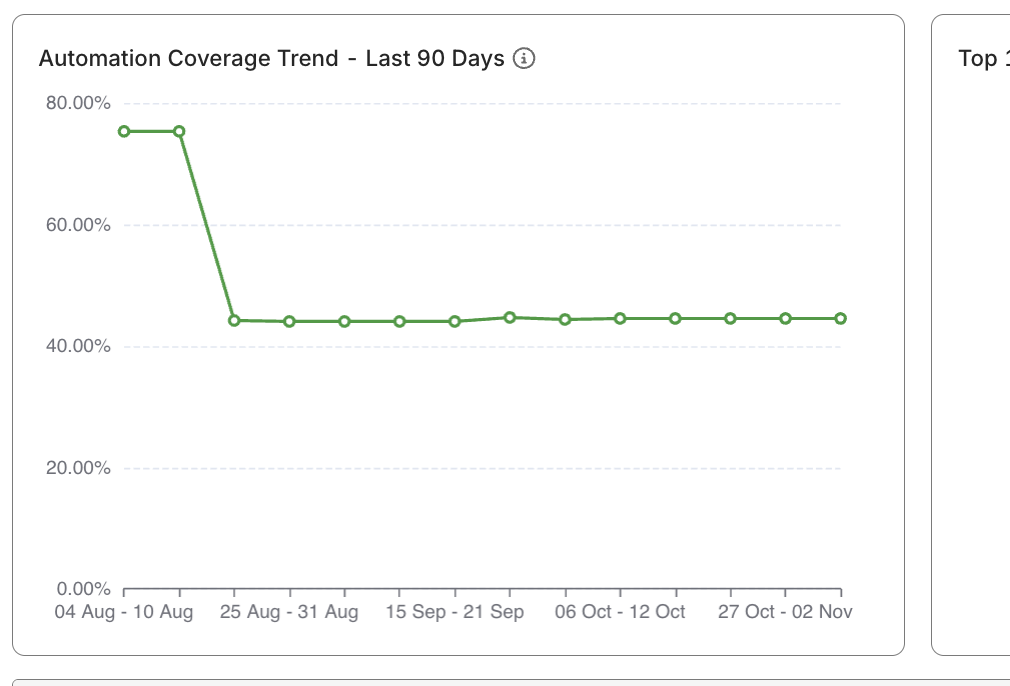
The Automation Coverage Trend widget shows how your project's automation coverage changes overtime. It signals whether automation coverage dips below the weeks prior, or progresses towards your goal.
Filters on this report affects the data table only. Apply filters and interact with the widgets for specific needs:
| Scenario | Steps |
|---|---|
| Identify automation bottlenecks | - Review Automation Coverage Trend - Click on days/weeks with low coverage - Drill down to the table to inspect affected test cases |
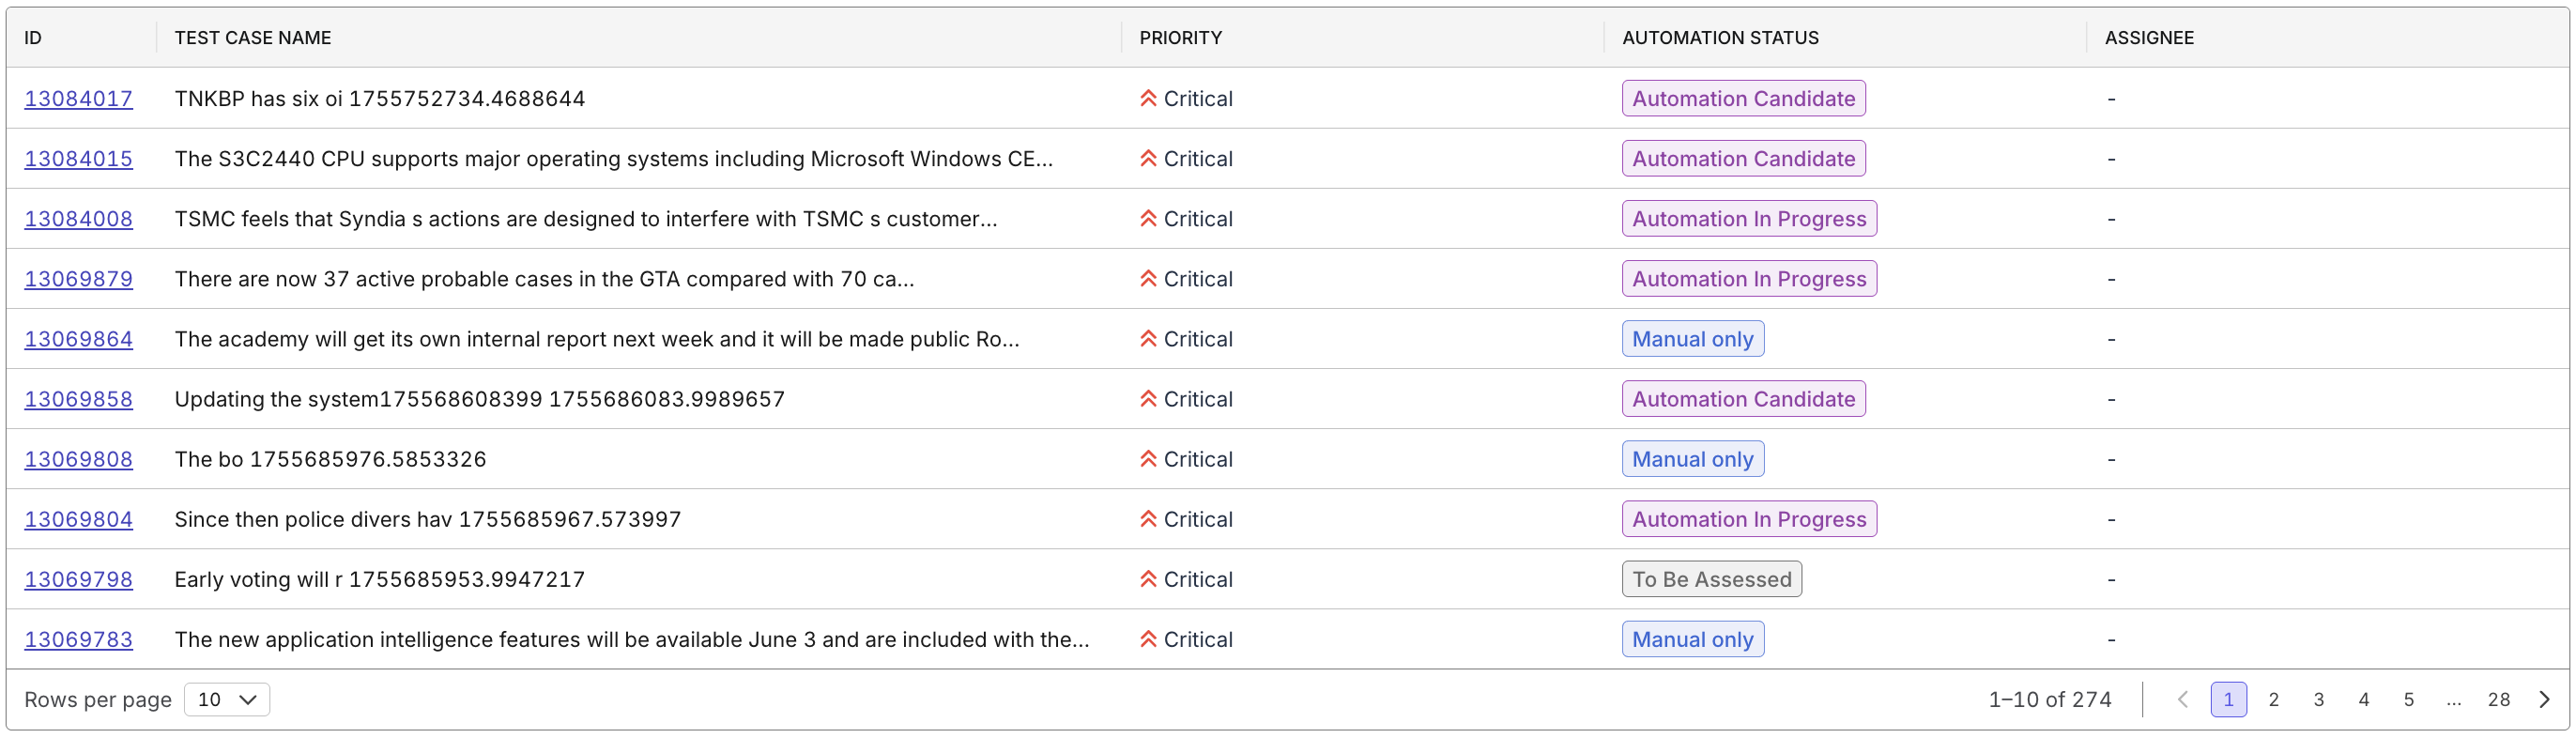
| Investigate root causes of low coverage | After drilling down from the trend chart, analyze the table by Automation Status, Assignee, and Priority to identify blockers (e.g., many “In Progress” or unassigned tests) |
| Find high-value candidates for automation | - Apply filters: Priority = Critical/High - Review Donut Chart for distribution - Select Automation Candidate segment - Use Drill-down Table to identify specific test cases |
| Track individual or team progress | - Apply filter: Assignee and compare data |
| Assess automation backlog | - Use Donut Chart to apply filter_Automation Candidate_, To Be Assessed to gauge backlog size - Click on each test case to view actionable items |
| View manual coverage | - Apply filters: Priority = Critical/High, Automation Status = Manual Only - View table to identify high-risk manual tests |
If you need to understand overall productivity for test case creation from drafting to publishing, see Track testing productivity.
Prompt Katalon AI Assistant for a quick summary of backlog, bottlenecks, or high-value candidates for automation.